VTI - SCHB: A Unique Index Construction But Common Results
2023-08-17 13:30:00 ET
Summary
- SCHB, from Charles Schwab, replicates the performance of the Dow Jones US Broad Stock Market Index, and is Schwab's version of a total-US market ETF.
- The index construction of SCHB is unique, but the results produced by the fund are not significantly different from major competitors.
- SCHB is a top-quality ETF, but investors most likely may choose it because they have a relationship with Schwab.
- In the article, I either directly compare or at least mention 5 possible alternative options deserving of consideration.
(This article was co-produced with Hoya Capital Real Estate.)
For years, the Charles Schwab Corporation ( SCHW ) has been a force in the investment community. In 1975, Charles Schwab seized an opportunity created by recent SEC changes to create a new kind of brokerage—a discount brokerage. In September, Schwab opened its first branch in Sacramento, California.
Some 9 years later, in 1984, Schwab introduced Mutual Fund MarketPlace, with 140 no-load funds. In 1996, following the advent of the internet, web trading went live. During the late-1980s through the early-2000s, the company both grew at a rapid pace and experienced a period of difficulty following the bursting of the dot-com bubble.
Following years as a stalwart in the low-cost mutual fund arena, Schwab entered the quickly-expanding ETF marketplace, launching 4 new ETFs in November, 2009 . Schwab U.S. Broad Market ETF was one of these ETFs.
In reviewing the specifics of SCHB, I came to the conclusion reflected in the title of this article. SCHB makes use of a very unique index construction. However, measured over a long period of time, I can't see any evidence that the results produced by this fund are any different or better than those of major competitors such as Vanguard Total Stock Market Index Fund ETF ( VTI ) and iShares Core S&P Total US Stock Market ETF ( ITOT ).
Let's get into the details of the fund. I will explain the unique methodology used in its index and highlight what would appear to be the beneficial features of this methodology. Next, we will take a look at the results.
SCHB - Digging Into The Underlying Index and Methodology
First of all, from a cost standpoint, SCHB is a very efficient core holding. With a rock-bottom expense ratio of .03%, SCHB matches up directly with VTI and ITOT, the major competitors I referenced above.
The fund seeks to replicate the performance of the Dow Jones US Broad Stock Market Index . Ultimately, this index results in approximately 2,500 securities being included in the fund. To explain how it does so, I will first quote directly from the methodology document provided by S&P Indices, the index provider, and then recapitulate this in simpler terms.
For the annual review, all constituents of the Dow Jones U.S. Total Stock Market Index are ranked, based on their closing prices as of the reference date, by full company market capitalization (all listed share classes) and assigned to size-segment indices in descending market cap order, subject to buffer rules for current index components, starting with the large-cap index.
Companies ranked 600 or larger are automatically assigned to the Dow Jones U.S. Large-Cap Total Stock Market Index. Current companies ranked 900 or higher are selected, in descending market capitalization order, until the index contains 750 companies. Companies ranked below 900 are removed from the index. If the index does not contain 750 companies after applying the buffer, the largest non-constituent companies are added in descending market cap order until the index contains 750 companies.
Companies not selected for the large-cap index ranked 2,000 or higher are automatically assigned to the small cap index. Current small-cap companies ranked 3,000 or higher are selected, in descending market capitalization order, until the index contains 1,750 companies. If the index does not contain 1,750 companies after applying the buffer, the largest non-constituent companies are added until the index contains 1,750 companies.
The 2,500 companies selected for the large-cap and small-cap indices comprise the Dow Jones U.S. Broad Stock Market Index.
I wanted to quote all of that directly for the technically-minded, detail-oriented folks among my readers. For the rest of us, let me see if I can recap that in simple English.
- Ultimately, the index is comprised of 750 large-cap companies and 1,750 smaller companies, for a total of 2,500 constituents.
- The first 750 are generated by taking the largest 600 companies, without exception. From there, the next 300 companies are filtered through various liquidity buffers. Those that make it through are selected, in descending market-cap order, until the next 150 companies are identified.
- A somewhat similar procedure is used to select the remaining 1,750 stocks. First, from the largest 2,000 stocks, any remaining companies meeting the buffer requirements are automatically selected. From there, the index digs down into companies ranked from 2,001-3000 until all 1,750 constituents are identified.
Here's one other detail for your consideration. According to Morningstar, the fund uses an interesting technique to minimize portfolio turnover. It uses buffer rules to keep existing constituents in the portfolio until they fall below the 3000th ranking, reducing unnecessary turnover around the lower cap bound. As a result, turnover is among the lowest in its Morningstar Category. The index rebalances quarterly and reconstitutes annually.
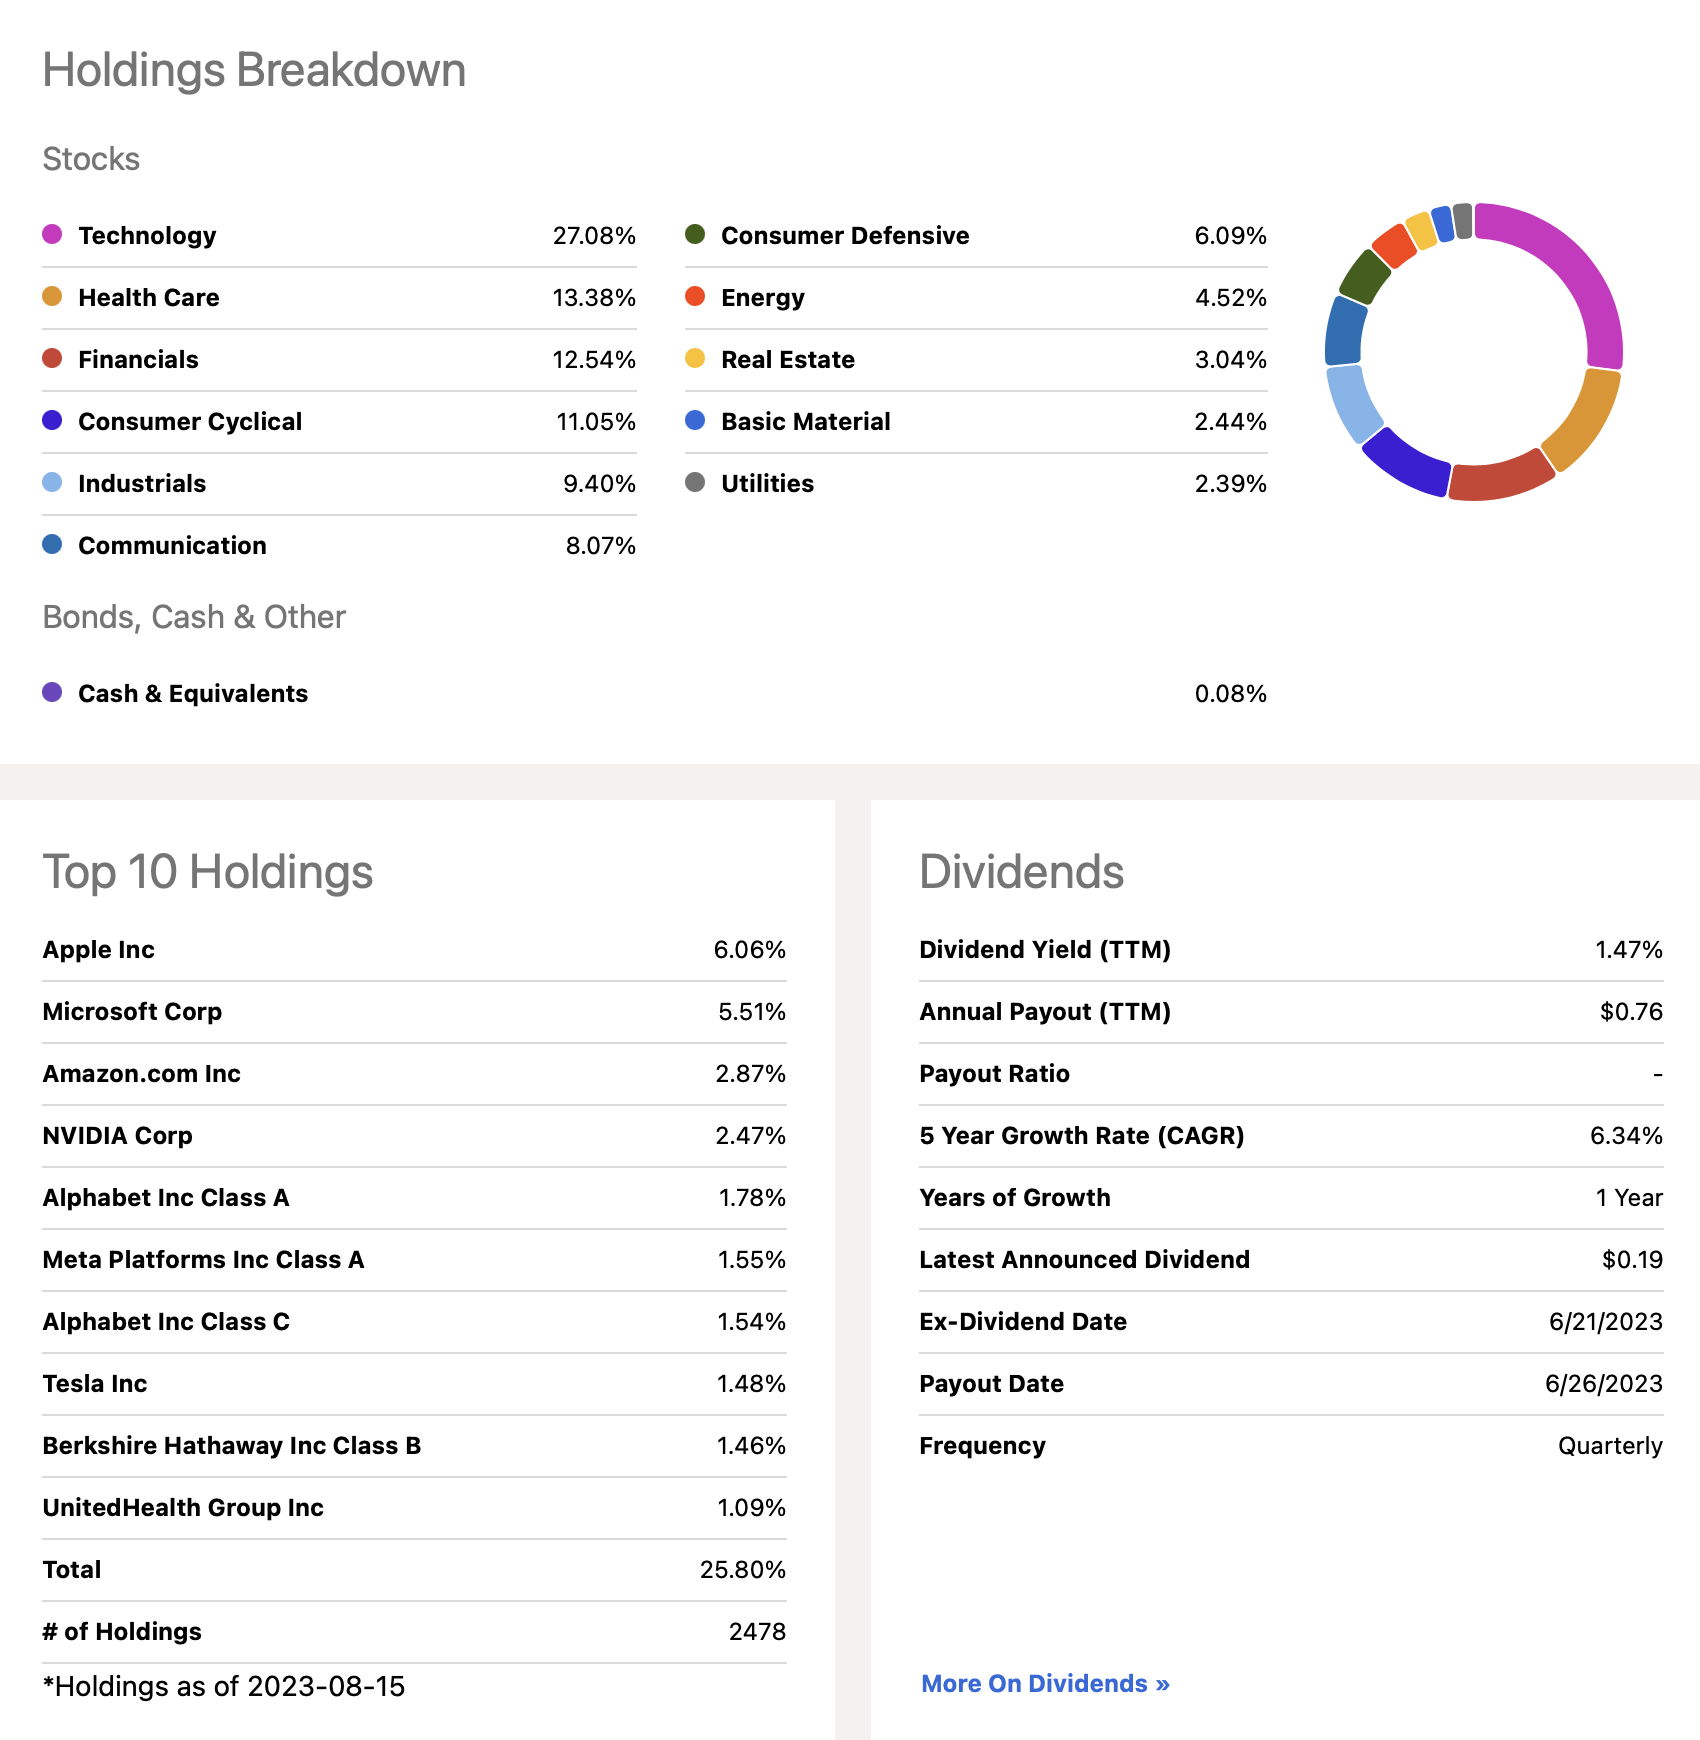
How does this all play out in the final constitution of the fund? As I often do, let's take a look at this most helpful combination graphic from right here on Seeking Alpha.
SCHB: Portfolio Characteristics (Seeking Alpha)
Now here's what is interesting about all of this. I took a look at the equivalent graphics on Seeking Alpha for VTI and ITOT, as well as the best known S&P 500 ETF, SPDR S&P 500 ETF Trust ( SPY ).
Guess what? There is not much difference. As compared to SPY, SCHB is roughly 1.0% underweight overall between the combined sectors of Technology & Health Care, roughly making up the difference by being slightly overweight in Industrials, Financials, and Real Estate. When compared against VTI and ITOT, the differences are even smaller.
SCHB: Examining Comparative Performance
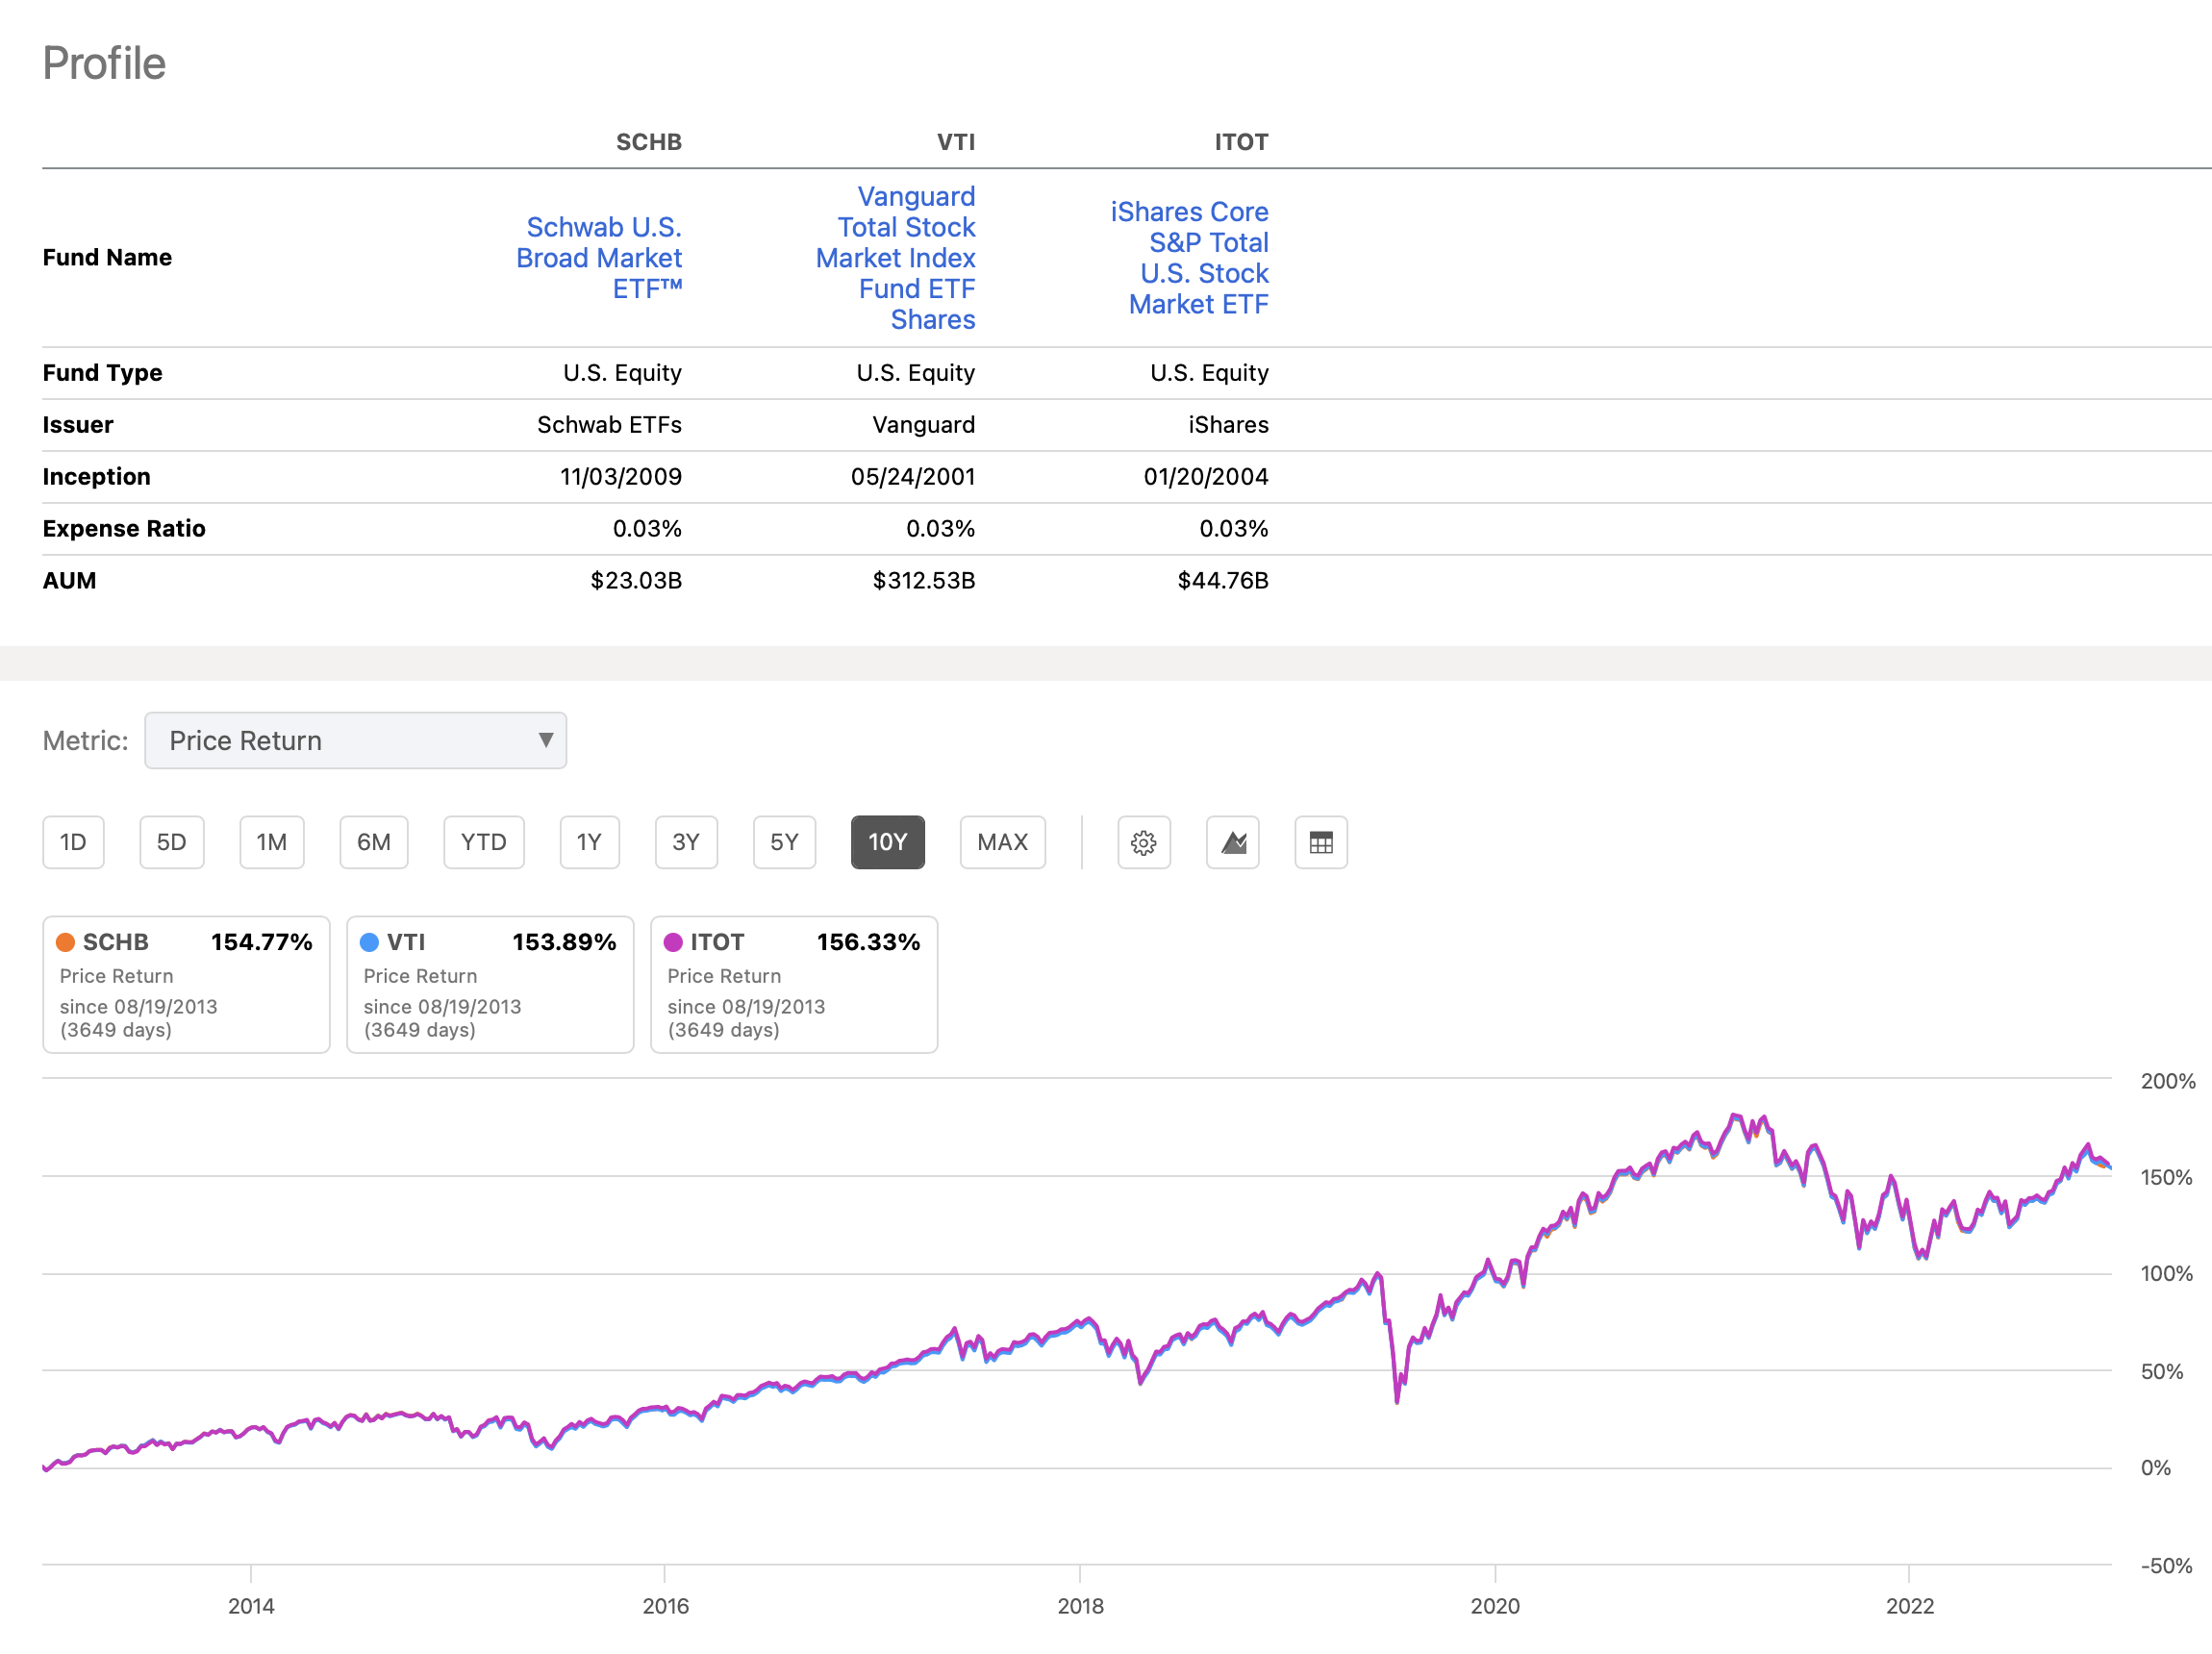
Next, let's turn to performance. I decided to use another helpful tool here on Seeking Alpha, the comparison tool. Using the tool, I started with SCHB and then selected VTI and ITOT as the two peers, or competitors, that I wished to evaluate.
SCHB vs. VTI vs. ITOT: 10-Year Performance Comparison (Seeking Alpha)
To ensure a fair comparison, I examined a full 10-year period. As can be seen, over that period, the total returns from the three ETFs are virtually identical.
To go a step further, while it is not in this graphic, I ran a backtest covering the same time span on SPY. As it happens, at least over this period of time, SPY edged out all 3 of these ETFs, both in terms of total return as well as risk/reward ratio. Going one last step further, I have already satisfied myself that Vanguard S&P 500 ETF ( VOO ) and iShares Core S&P 500 ETF ( IVV ) slightly edge out SPY in terms of total performance, likely due to their lower expense ratios.
Lastly, take a look at one last graphic from my SCHB/VTI/ITOT comparison on Seeking Alpha.
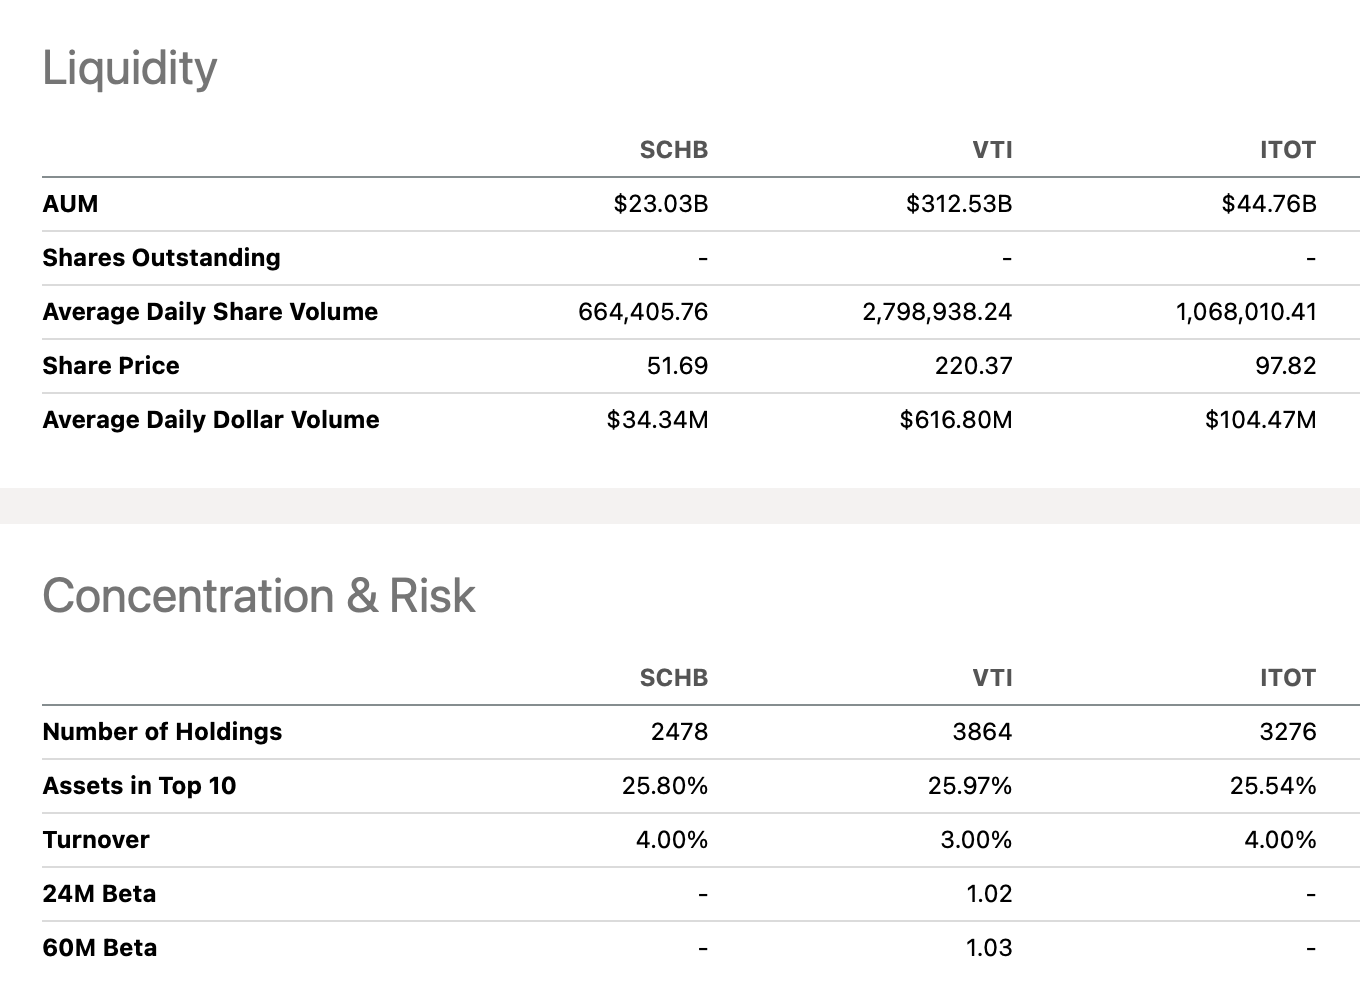
SCHB vs. VTI vs. ITOT: Liquidity Profile (Seeking Alpha)
What this particular one shows is the liquidity profile, as well as concentration and risk.
With respect to liquidity, this basically refers to the question the volume and efficiency with which the ETF trades. This has an effect on the trading spread, the minuscule difference that the transaction between buyer and seller effectively costs them both. To be clear, all 3 of these ETFs are stellar. As you look closely, however, you will notice that ITOT has a higher trade volume than SCHB, and VTI outdoes both by a large margin.
In terms of concentration and risk, we find that SCHB's unique index results in "only" approximately 2,500 holdings, as opposed to well over 3,000 in VTI and ITOT. At the end of the day, however, we have already seen the performance of the three funds over a long period of time is virtually identical.
Summary and Conclusion
As can be seen, SCHB is a top-quality ETF. Basically, this is Schwab's competitor in the total-U.S. market space.
As outlined in this review, Schwab goes about things slightly differently than do its major competitors. I had been curious to determine whether SCHB's unique construction led to superior results. As it turns out, this is not the case.
As a result, it appears to me that the primary reason an investor might select this ETF is if they have some form of relationship with Schwab. Other than that, investors have a choice between this ETF and at least the 5 other options I have mentioned at least in passing in this article, either in terms of tracking the total U.S.-market or the S&P 500, depending on one's preference.
For further details see:
SCHB: A Unique Index Construction But Common Results