SPTM - SCHB: Worth Holding But I Prefer Two Other Total Market ETFs
2024-01-15 21:39:09 ET
Summary
- Schwab's U.S. Broad Market ETF is a low-cost option for capturing the returns of the total market with broad diversification.
- Vanguard's Total Stock Market Index Fund ETF offers a higher dividend yield and maximum diversification, making it a more favorable option for investors.
- SPDR Portfolio S&P 1500 Composite Stock Market ETF has slightly higher long-term performance and is another ETF to consider.
Investment Thesis
Schwab’s U.S. Broad Market ETF ( SCHB ) warrants a hold rating for its ultra low-cost ability to capture the returns of the “total market” with broad diversification. While the fund has the most favorable valuation metrics in comparison to peers, investors may find Vanguard’s Total Stock Market ETF ( VTI ) more favorable for its greater dividend yield and maximum diversification. Additionally, SPDR Portfolio S&P 1500 Composite Stock Market ETF ( SPTM ) is another peer ETF that warrants consideration due to its slightly higher long-term performance. Finally, SCHB has the lowest weight on several key holdings that have strong prospects looking forward.
Fund Overview and Compared ETFs
SCHB is an ETF that seeks to track the total return of the Dow Jones U.S. Broad Stock Market Index . With an inception in 2009, the fund has 2,458 holdings and $25.30B in AUM. Schwab provides the fund to offer a low-cost way to achieve diversification of the roughly 2,500 largest publicly traded U.S. companies. These include large-, mid-, and small-cap equities. However, SCHB is cap weighted. Therefore, its top holdings are predominantly big tech as I will cover in further detail later. Its largest sector weights are information technology (26.22%), financials (13.19%), and health care (13.15%).
For comparison purposes, other broad market ETFs examined are VTI, iShares Core S&P Total U.S. Stock Market ETF (ITOT), and SPTM. VTI seeks to track the performance of the CRSP U.S. Total Market index . Therefore, similarly to SCHB, it includes large-, mid-, and small-cap equities with a blend between value and growth. VTI is slightly heavier on information technology (31.25%) and its second heaviest sector is consumer discretionary at 14.32%.
ITOT seeks to track the investment results of a broad-based index composed of U.S. equities in general. Like SCHB and VTI, ITOT’s heaviest sector weight is IT (27.47%) but it is also heavy on financials (13.51%), and healthcare (12.84%). Finally, SPTM seeks to provide the returns of the S&P Composite 1500 Index . The fund is heavy on IT (27.37%), followed by financials (13.29%), and then healthcare (12.65%).
Performance, Expense Ratio, and Dividend Yield
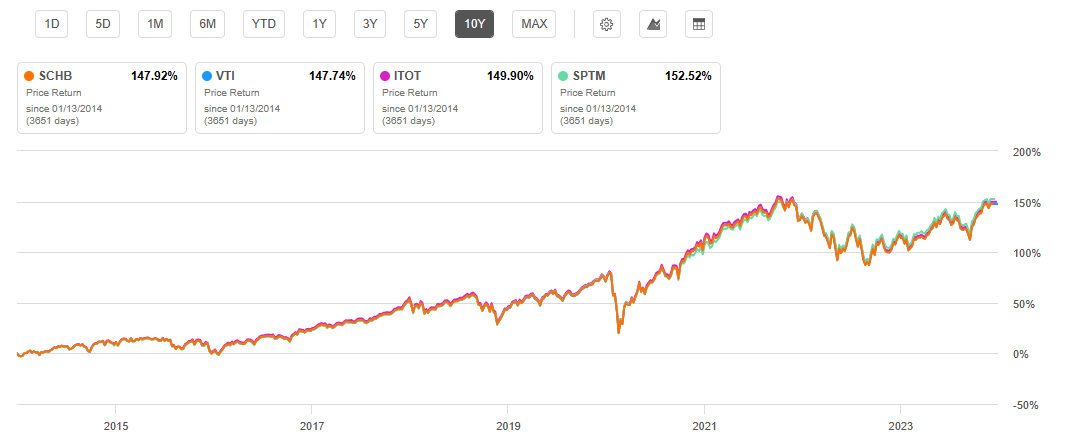
Because of the broad-based strategy seen by all the total market ETFs compared, their long-term performance is very similar. SCHB has a 10-year CAGR of 11.44%. By comparison, VTI has a 10-year CAGR of 11.44% and ITOT’s 10-year CAGR is 11.51%. SPTM has the highest 10-year CAGR at 11.64%. One of the best qualities of SCHB and compared total market ETFs is their ultra-low expense ratios. With an expense ratio of 0.03%, SCHB is on par with other broad market ETFs examined.
10 Year Total Price Return for SCHB and Peer Broad-Based ETFs (Seeking Alpha)
While expense ratios are identical among compared ETFs, their dividend yields and dividend growth rates vary slightly. SCHB has the lowest dividend yield at 1.40% along with a 5.38% dividend 5-year CAGR. ITOT has the highest dividend yield at 1.48%. SPTM has the greatest dividend growth rate over the past five years at a 7.44% CAGR.
Expense Ratio, AUM, and Dividend Yield Comparison
| SCHB |
| VTI |
| ITOT |
| SPTM |
| Expense Ratio |
| 0.03% |
| 0.03% |
| 0.03% |
| 0.03% |
| AUM |
| $25.30B |
| $348.70B |
| $49.40B |
| $7.67B |
| Dividend Yield TTM |
| 1.40% |
| 1.44% |
| 1.48% |
| 1.44% |
| Dividend Growth 5 YR CAGR |
| 5.38% |
| 5.55% |
| 4.97% |
| 7.44% |
Source: Seeking Alpha, 13 Jan 24
SCHB Holdings and Key Differences
SCHB’s top 10 holdings hold over 26% of the total weight of the fund. These are predominantly information technology holdings. Because SCHB’s peer broad-based ETFs are also cap-weight and highly diversified, their holdings are roughly the same. However, as I will discuss, even slight differences can result in different performance looking forward.
Top 10 Holdings for SCHB and Peer Broad Market ETFs (Key Differences Bolded)
| SCHB – 2,458 holdings |
| VTI – 3,761 holdings |
| ITOT – 2,634 holdings |
| SPTM – 1,511 holdings |
| MSFT – 6.15% |
| AAPL – 6.35% |
| MSFT – 6.19% |
| MSFT – 6.51% |
| AAPL – 5.84% |
| MSFT – 6.34% |
| AAPL – 5.83% |
| AAPL – 6.18% |
| AMZN – 3.04% |
| AMZN – 3.05% |
| AMZN – 3.01% |
| AMZN – 3.22% |
| NVDA – 2.92% |
| NVDA – 2.47% |
| NVDA – 2.90% |
| NVDA – 3.09% |
| GOOGL – 1.81% |
| GOOGL – 1.77% |
| GOOGL – 1.81% |
| GOOGL – 1.92% |
| META – 1.77% |
| META – 1.64% |
| META – 1.78% |
| META – 1.87% |
| GOOG – 1.54% |
| GOOG – 1.49% |
| GOOG – 1.54% |
| GOOG – 1.63% |
| BRK.B – 1.42% |
| TSLA – 1.46% |
| BRK.B – 1.42% |
| BRK.B – 1.51% |
| TSLA – 1.35% |
| BRK.B – 1.44% |
| TSLA – 1.30% |
| TSLA – 1.43% |
| LLY – 1.09% |
| UNH – 1.15% |
| LLY – 1.10% |
| LLY – 1.16% |
Source: Multiple, compiled by author on 13 Jan 24
All ETF investors know that a fund’s future performance is tied to the returns of its individual holdings. SCHB warrants a hold rating overall because of its comparatively lower weight on several key holdings compared to peer broad market ETFs. Although these weight differences are small, they can add up over time. Key differences include SCHB’s lower weight on Microsoft Corp. ( MSFT ), Berkshire Hathway Inc. ( BRK.B ), and Eli Lilly and Company ( LLY ).
SCHB’s Lowest Weight on Microsoft
The first difference is SCHB’s lowest weight on MSFT. While SCHB has 6.15% weight on Microsoft, this is the lowest compared to other broad market ETFs. Due to Microsoft’s strong quantifiable indicators, this lower weight may result in a disadvantage for SCHB. Despite being a mammoth in mega-cap big tech, Microsoft still had a 10.8% YoY EBITDA growth and 30.3% YoY CAPEX growth. Furthermore, the company remains highly profitable with a 69.5% gross profit margin and 35.3% net income margin. Even with a 62% positive price return over the past year, the company is primed for additional growth. One example of an AI-powered project that will continue propelling MSFT is its 365 Co-pilot which is estimated to generate $7.3 billion of incremental annual recurring revenue.
SCHB’s Lowest Weight on BRK.B
The second potential disadvantage is SCHB’s lower weight on Berkshire Hathaway. While this weight difference is minor, it represents another likely disadvantage compared to peer ETFs. Warren Buffett’s company is massively diversified and remains highly successful with multiple key indicators pointing towards greater returns. For example, the company had an 18.05% YoY revenue growth and 62.5% YoY working capital growth. Despite these strong metrics, its EV/EBITDA over the past twelve months stands at 6.99, which is comparatively low, being 39% lower than its sector median.
SCHB’s Lowest Weight on LLY
Finally, the third difference representing a drawback for SCHB is a comparatively low weight on Eli Lilly. At 1.09% weight, SCHB has less LLY compared to all other examined ETFs. VTI does not have LLY in its top 10 but still holds 1.14% weight on the company. Eli Lilly is seeing strong growth indicating a forward EBITDA growth of 13.2% and 74% YoY CAPEX growth. Additionally, it is extremely profitable at a 78.7% gross profit margin and a 46.86% return on common equity. However, a key drawback is its current high valuation including a P/E ratio of 103.42, or 264% higher than its sector median.
Valuation and Risks to Investors
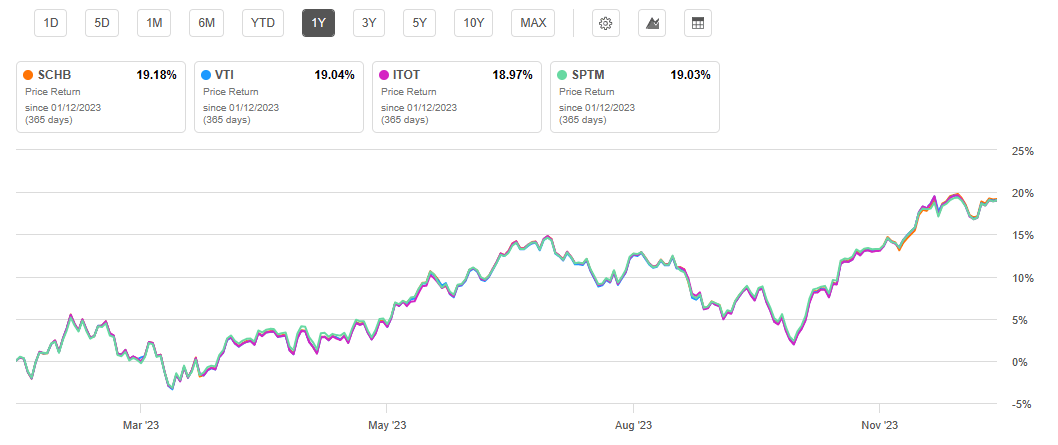
SCHB is currently trading at $55.62 at the time of writing this article. This is near the upper limit of its 52-week range of $44.57 and $56.00 but below its all-time high $56.85 in January 2022. Over the past year, SCHB has slightly outperformed other broad market ETFs. However, like its long-term performance history, this difference is slight.
One Year Total Return: SCHB and Peer Exchange Traded Funds (Seeking Alpha)
SCHB demonstrates valuation metrics slightly more favorable in comparison to its peer ETFs. For example, its price-to-earnings ratio is on the lower end of other broad-based ETFs at 21.81. Additionally, its price-to-book ratio is the lowest at 3.67. This lower valuation overall can likely be credited to a slightly lower weight on mega-cap, big tech stocks that currently have high valuations.
Valuation Metrics for SCHB and Peer Competitors
| SCHB |
| VTI |
| ITOT |
| SPTM |
| P/E ratio |
| 21.81 |
| 21.8 |
| 22.57 |
| 22.91 |
| P/B ratio |
| 3.67 |
| 3.7 |
| 4.02 |
| 3.90 |
Source: Compiled by Author from Multiple Sources, 13 Jan 24
Investors seeking a passively managed fund to buy and hold would do well to consider any of these four broad-based, low-cost funds examined in this article. They have many similarities resulting in roughly the same risk level and long-term performance. However, due to SCHB’s slightly lower weight on several key holdings discussed, I expect the other ETFs to marginally outperform.
Concluding Summary
SCHB is a broad-based fund with very low expenses. Its long-term performance is nearly the same as other peer ETFs. However, Vanguard’s VTI has a higher dividend yield with even greater diversification than SCHB. Additionally, SPTM has demonstrated greater long-term performance. Looking at valuation metrics, SCHB is slightly more favorable looking at its P/E and P/B ratios. While each holding's weight is almost the same for each examined ETF, SCHB has the lowest weight on MSFT, BRK.B, and LLY. Due to strong quantifiable metrics for each of these holdings, SCHB may slightly underperform its peer ETFs looking forward.
For further details see:
SCHB: Worth Holding, But I Prefer Two Other Total Market ETFs