RDVY - SCHD: A Base For This 3% Yielding 3 ETF Portfolio
Summary
- SCHD is a top dividend growth ETF, but it's not perfect. In a recent article, I described how poorly it ranked on diversification and growth.
- Fortunately, it's easy to fill these gaps. I'll take you through my process of finding two complementary ETFs, and provide a fundamentals-based comparison of 20 dividend and value ETF alternatives.
- The 3-ETF suggested portfolio delivers a 3% dividend yield with double-digit dividend growth, is better-balanced across industries, trades at 16.42x forward earnings, and has a 0.055% effective expense ratio.
- Join me in the comments section! Let me know which two ETFs you'd select and why, and I'll be pleased to run the comparisons for you.
Article Purpose
Two months ago , I compared the Schwab U.S. Dividend Equity ETF ( SCHD ) with 100 other dividend and value U.S. Equity ETFs. Like many Seeking Alpha analysts, I think SCHD is a great one to buy. However, my 32 sub-factor analysis revealed it ranked only average on valuation and market sentiment and poorly on diversification and growth. Therefore, it's prudent to round out your portfolio with complementary dividend ETFs that take care of these shortcomings. I identified 20 potential candidates with low industry overlap with SCHD and narrowed that down to two based on fundamentals. This article presents the results of the combined portfolio, as well as the fundamentals for every ETF discussed. I hope you enjoy the read.
SCHD Overview
Performance and Dividends
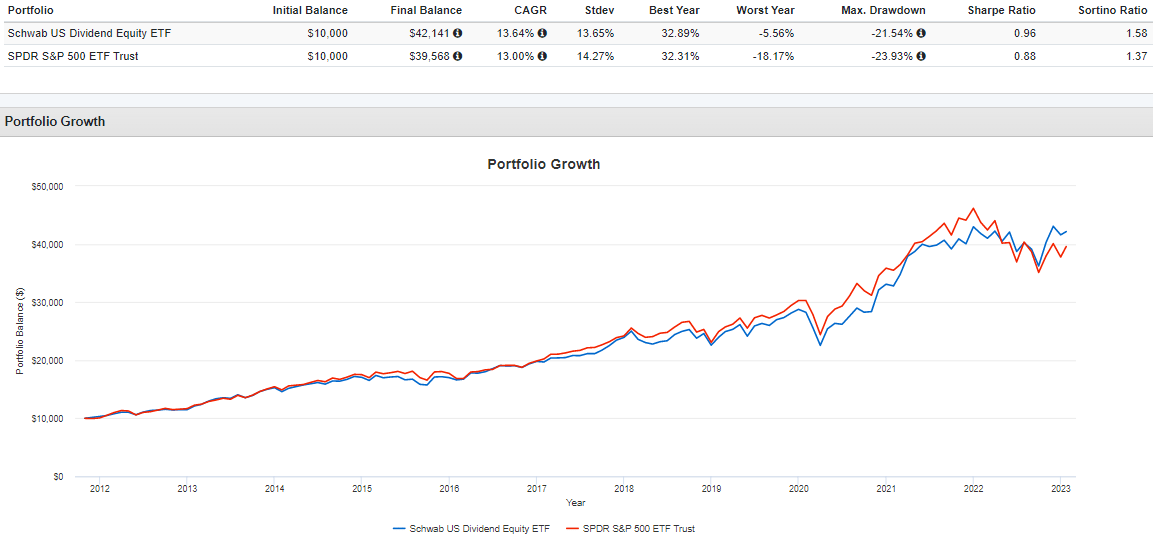
SCHD tracks the Dow Jones U.S. Dividend 100 Index, selecting 100 U.S. securities with at least ten consecutive years of dividend payments. The Index excludes REITs, and the screens are free cash flow to total debt, return on equity, indicated dividend yield, and five-year dividend growth. These factors were a winning combination since SCHD launched in October 2011 - it outperformed the SPDR S&P 500 ETF ( SPY ) by 0.64% per year.
In May 2021, I backtested the Index to 1999 and determined that SCHD, had it launched earlier, would have succeeded during periods of market stress, like the tech crash in the early 2000s and the Great Financial Crisis in 2008. I performed this analysis to assuage the concerns of readers not wanting to Index in an unproven ETF. Overall, the Index is a long-term success.
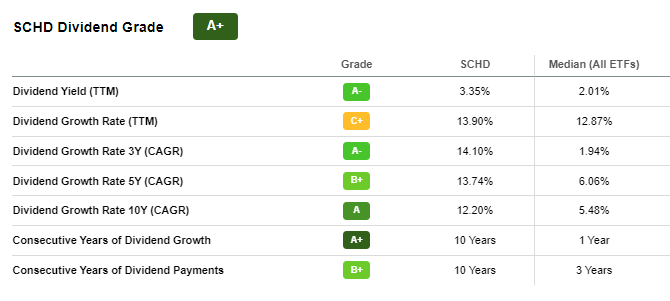
In addition to a rock-bottom 0.06% expense ratio, SCHD captures the attention of income investors for its solid 3.35% starting yield and its 13.74% historical five-year dividend growth rate. Like its constituents, SCHD has raised dividends for ten consecutive years and earns an overall "A+" Dividend Grade based on Seeking Alpha's Factor System.
Fundamentals: Identifying Problem Areas
These are great results, but my previous positive reviews relied on other factors. After examining the fundamentals of 100 other dividend and value ETFs, I found that SCHD scored:
- #2 on fund basics (assets under management, volume, fees)
- #89 on diversification (by company, industry, and sector)
- #21 on market volatility (two- and five-year betas)
- #1 on dividends (historical and expected dividend yield and growth)
- #82 on growth (sales, EBITDA, earnings per share)
- #52 on valuation (price-earnings, price-cash flow, price-sales)
- #14 on profitability (ROE, ROA, ROTC, Cash-Total Debt, EBITDA Margins)
- #10 on price momentum (price vs. 50D, 100D, 200D moving averages)
- #52 on market sentiment (sales and earnings surprises, earnings revisions)
- #1 on risk-adjusted returns (three, five, and ten-year)
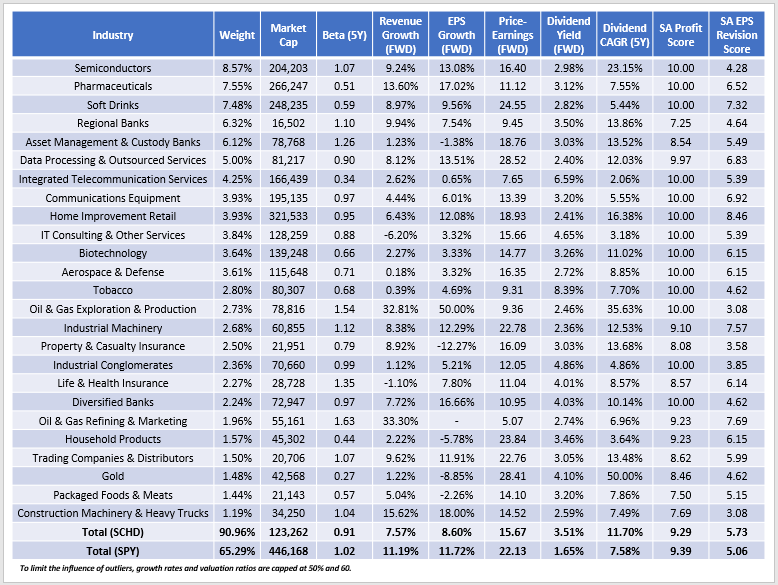
SCHD scores in the top quartile on many metrics, though it could use some help with diversification and growth. To put some numbers to these metrics, consider the following snapshot for its top 25 industries, with summary metrics for SCHD and SPY in the final rows.
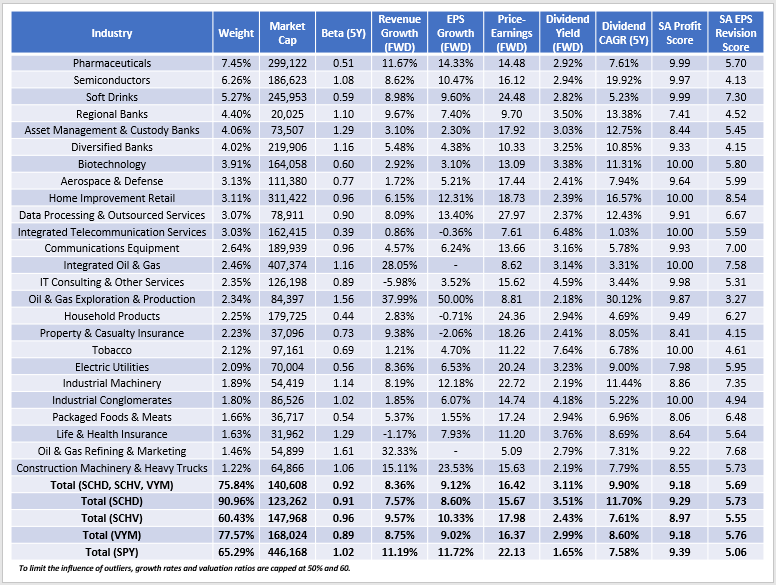
First, 90.96% of SCHD's assets are in its top 25 industries, compared to 65.29% for SPY. In my last article, several readers expressed how they preferred this high concentration level as it's the only way to guarantee a different-enough portfolio that can generate alpha. That's correct, but the challenge is determining the optimal number of holdings. I recently reviewed the Invesco S&P 500 Top 50 ETF ( XLG ) and concluded that 50 stocks were too few. SCHD's 100 may be sufficient, but it may not be, and pursuing additional diversification through complementary ETFs is worthwhile. The challenge is finding ones that avoid SCHD's top industries like Semiconductors, Pharmaceuticals, Soft Drinks, and Regional Banks - the latter being popular among high-yield ETFs but historically risky in recessions.
Second, SCHD has a sales and earnings growth problem, trailing SPY by 3-4% and ranking just 82nd best out of the 100 analyzed two months ago. Financial industries like Regional Banks and Asset Management & Custody Banks have single-digit or negative earnings growth expectations. Analysts expect flat earnings growth for Verizon Communications ( VZ ), representing the Integrated Telecommunication Services industry. Here, I'll be looking for ETFs with double-digit earnings growth, but that typically comes with sacrifices like higher volatility or valuation.
Third, SCHD's 5.73/10 EPS Revision Score, derived from individual Seeking Alpha Grades, is substantially better than SPY's 5.06/10. It's one reason why value and dividend-oriented ETFs have outperformed lately - they don't hold Apple ( AAPL ) and Microsoft ( MSFT ), which have "D+" and "F" grades. In addition, SCHD's last quarter sales and earnings surprises rank only #59 and #75 out of the 100 sampled two months ago. Therefore, market sentiment is one area we may be able to improve.
Finding Complementary ETFs
Addressing Problem #1: Diversification
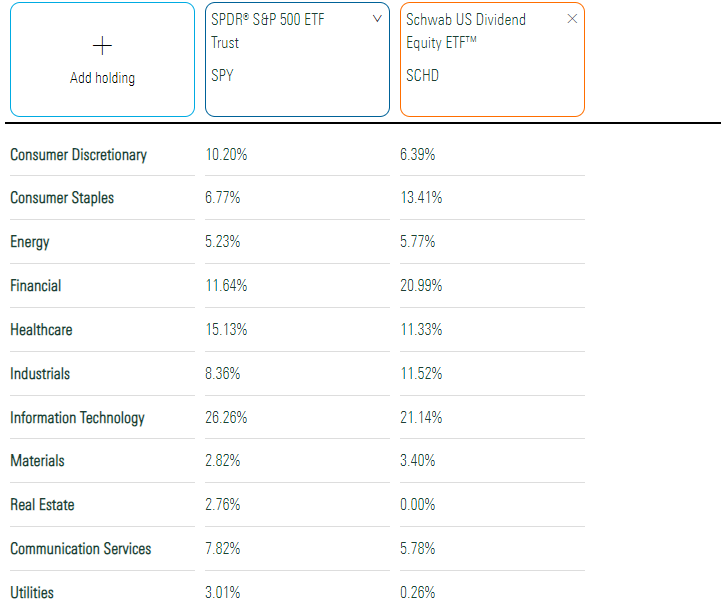
The first problem I want to solve is diversification because SCHD is potentially over-concentrated. Earlier, I highlighted how 90.96% of assets are in the top 25 industries. Furthermore, 75.38% of assets are in the top 25 holdings, and SCHD holds about 21% each in Financials and Technology stocks. Given how poorly these sectors performed in two significant market crashes, it's not unreasonable to want some extra exposure to inflation-friendly sectors like Energy and defensive ones like Utilities. I wrote several times in 2022 about how the Utilities sector is an excellent play despite competition with rising U.S. Treasury Yields. Plus, Utilities tend to pay decent dividends, so we should be able to find several worthy candidates.
Sector diversification is helpful and easy to determine because most fund provides highlight this information. However, I go one step further and examine an ETF's industry diversification. The reason is that stocks within a sector sometimes have different volatility levels. For example, S&P 500 Oil & Gas Equipment & Services stocks have a 1.83 five-year beta compared to 1.18 for Integrated Oil & Gas companies. In the Financials sector, the Asset Management & Custody Bank stocks that SCHD favors are the most volatile, with a 1.30 five-year beta. In contrast, insurance companies are typically more stable. These differences matter, but it isn't easy to understand them by looking at a fund's sector exposures and scanning its top holdings.
My process was to look for dividend and value-oriented ETFs with low industry overlap. I identified 20 potential candidates and their corresponding overlaps with SCHD's top 25 industries.
- SPDR S&P 500 Value ETF ( SPYV ): 35.48%
- Vanguard Russell 1000 Value ETF ( VONV ): 40.53%
- Schwab Fundamental U.S. Large Company ETF ( FNDX ): 40.70%
- Invesco S&P 500 High Dividend Low Volatility ETF ( SPHD ): 41.57%
- SPDR S&P Dividend ETF ( SDY ): 41.91%
- ProShares S&P 500 Dividend Aristocrats ETF ( NOBL ): 42.37%
- Invesco High Yield Equity Dividend Achievers ETF ( PEY ): 42.49%
- SPDR S&P 500 High Dividend ETF ( SPYD ): 43.21%
- Schwab U.S. Large Cap Value ETF ( SCHV ): 46.97%
- Vanguard Value ETF ( VTV ): 49.29%
- Fidelity Dividend ETF for Rising Rates ( FDRR ): 49.31%
- iShares Select Dividend ETF ( DVY ): 49.49%
- WisdomTree Total Dividend ETF ( DTD ): 49.79%
- First Trust Rising Dividend Achievers ETF ( RDVY ): 49.97%
- Vanguard Dividend Appreciation ETF ( VIG ): 50.10%
- WisdomTree U.S. Dividend Growth ETF ( DGRW ): 50.70%
- iShares Core Dividend Growth ETF ( DGRO ): 52.46%
- WisdomTree U.S. High Dividend Fund ( DHS ): 55.71%
- iShares Core High Dividend ETF ( HDV ): 60.96%
- Vanguard High Dividend Yield ETF ( VYM ): 63.45%
All provide at least some diversification benefits if paired with SCHD. I know several readers who own the Dividend Aristocrats through NOBL and SDY, and it's easy to see why. SDY solves the Utilities issue with 14.97% exposure, while NOBL has just 4.70% exposure to Technology stocks, providing a nice balance to SCHD's 21.14%.
I'm also interested in DVY, PEY, and SPHD, as they all have at least 18% Utilities sector exposure. Given how SCHD weights based on free-float market capitalization, it's crucial to select an alternatively-weighted ETF to capture some of these lesser-known names. Except for NextEra Energy ( NEE ), the largest by market capitalization is Duke Energy ( DUK ) at #99 on the S&P 500.
Finally, large-cap value ETFs like SPYV, VONV, and VTV should be in the mix. They aren't dividend-focused, but the diversification benefits are clear. To illustrate, SPYV has just 35.48% exposure to SCHD's top 25 industries. Its leading industries include Systems Software, Health Care Equipment, and Electric Utilities - three SCHD virtually ignores.
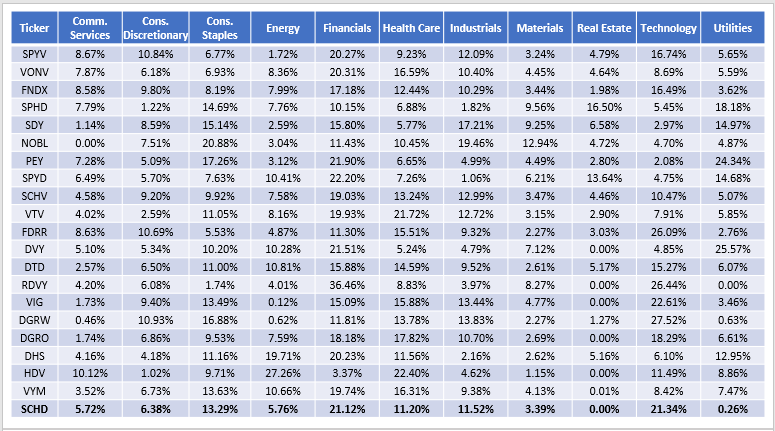
The following table summarizes the sector exposures for all 20 ETFs. This table highlights SDY, SPYD, and SPHD as solutions if you want some Real Estate exposure. Finally, value ETFs like VONV, SCHV, and VTV are well-balanced across most sectors. They may complement SCHD well should their fundamentals look attractive.
Addressing Problem #2: Growth
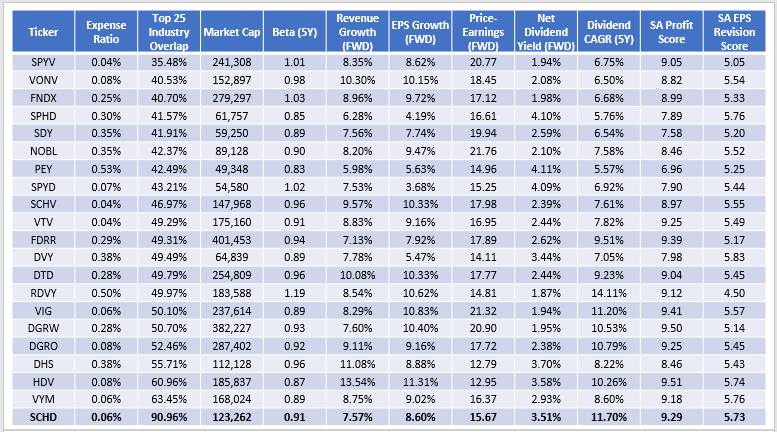
The next step is to select two ETFs that address SCHD's biggest weakness: poor growth. The challenge is to do so in a way that upholds its strong areas like dividends and profitability. Consider how these 20 score on the same fundamental metrics described earlier.
SCHD's fundamentals are strong. The growth estimates look decent given the competition, its 15.67x forward earnings valuation is on the low side, and no other fund rivals its high dividend yield and growth rate combination except for HDV. The 9.29/10 Profitability Score is excellent, and even SCHD's 5.73/10 EPS Revision Score is among the best. Past performance aside, these reasons are why I like it as a base holding and why it's possibly your "default buy."
The Schwab U.S. Large Cap Value ETF makes sense from a diversification perspective. Its industry overlap with SCHD is low and has double-digit expected earnings growth. The 17.98x forward earnings valuation is reasonable, and although its 2.39% dividend yield could be better, it's still better than other popular ETFs like VIG, DGRO, and DGRW. You might also consider VONV, but SCHV's dividend yield sets it apart.
For the second ETF, I considered the iShares Core High Dividend ETF but decided against it because of its extreme concentration in Energy. Instead, I selected the Vanguard High Dividend Yield ETF . It's already well-diversified on its own, with 77.57% of assets in its top 25 industries (compared to 90.96% for SCHD). Finally, its valuation is relatively low, and its Profitability and EPS Revision Scores are sufficient.
Suggested Mix: 50% SCHD, 25% SCHV, 25% VYM
SCHD has superior fundamentals and, therefore, should have a higher weighting. Adding 25% to both SCHV and VYM produces the following mix:
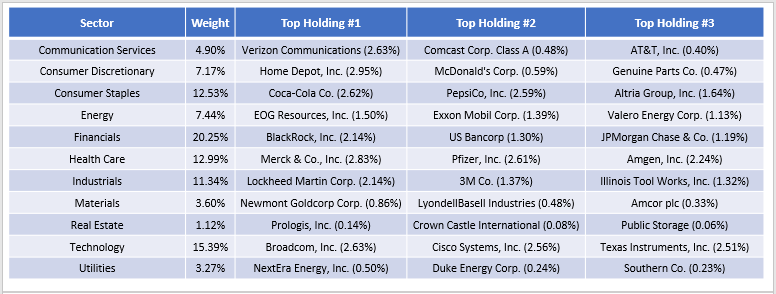
As a result, Technology exposure is a more reasonable 15.39%, while Energy and Utilities combine for 10.71% compared to 6.03% for SCHD alone. The top holdings are mostly blue chips like Verizon Communications , Home Depot ( HD ), Coca-Cola ( KO ), and Lockheed Martin ( LMT ), but let's take a look at how this 3 ETF portfolio looks fundamentally.
The combined portfolio has 75.84% of assets in its top 25 industries compared to 90.96% for just SCHD. Furthermore, only three industries have 5% or more exposure compared to six with SCHD, so these additions significantly improved diversification. Notably, the overall structure of the portfolio mainly stayed the same. This portfolio has a 0.92 five-year beta, trades at 16.42x forward earnings, has a 3.11% gross dividend yield, and has a 9.90% five-year dividend growth rate. And, since SCHV and VYM are low-cost ETFs, net distributions should be above 3%.
Adding SCHV and VYM didn't negatively impact SCHD's quality or earnings momentum, as measured by its 9.18/10 and 5.69/10 Profitability and EPS Revision Scores. The 8.36% and 9.12% estimated sales and earnings growth rates are slightly better and likely the best we can do without impacting valuation. NOBL, VIG, and DGRW all have double-digit earnings growth rates but trade above 20x earnings. I also considered RDVY, but it's heavy on Technology stocks and has a 1.19 five-year beta, and that would take SCHD's defensive composition in a direction I'm uncomfortable with.
Conclusion
I wrote this article to remind readers that SCHD is not perfect and that it's prudent to address its shortcomings: poor diversification and low growth. Fortunately, it's easy to solve these problems with ETFs. I identified ETFs with low industry overlap and selected two that would improve growth potential without sacrificing SCHD's positive features. Adding SCHV and VYM will still deliver a 3% dividend yield with near-double-digit dividend growth but will result in a better-diversified portfolio with slightly more growth potential.
What do you think? Did I select suitable complementary ETFs, or would you choose a different two? Please let me know in the comments section below, and be sure to check back in March as I cover SCHD's much-anticipated annual reconstitution. Thank you for reading.
For further details see:
SCHD: A Base For This 3% Yielding, 3 ETF Portfolio