VYM - SCHD: This 3.90% Yielding Quality Dividend Growth ETF Is Back In Buy Territory (Rating Upgrade)
2023-10-26 01:22:38 ET
Summary
- SCHD features a 3.90% expected yield and the best combination of value/profitability in its category. A low 0.06% expense ratio means shareholders get to keep most of the underlying distributions.
- SCHD has struggled in the last year, underperforming 70% of U.S. Equity ETFs. Despite an excellent ten-year track record, we must acknowledge SCHD's key weakness: low earnings growth.
- Earnings growth is important because it funds dividend growth. You can't have one without the other, but fortunately, there isn't a dividend ETF available that consistently selects 100 high-quality stocks.
- This buffer will serve long-term investors well. Furthermore, today is an excellent time to buy because Wall Street analysts are finally on board. SCHD's solid 6.09/10 EPS Revision Score suggests "enough is enough".
- This article compares SCHD's fundamentals at length with alternatives like VYM, DIVB, FDVV, and SPY. It also includes a detailed Excel workbook highlighting dozens of fundamental metrics for nearly 1,000 U.S. stocks, sourced 100% from Seeking Alpha.
Introduction
The Schwab U.S. Dividend Equity ETF ( SCHD ) is probably the most covered ETF on Seeking Alpha, consistently garnering hundreds of comments from engaged dividend investors who appreciate its 3.81% dividend yield, eleven-year dividend growth streak, and ten-year total returns track record that rivals the SPDR S&P 500 ETF ( SPY ). However, I, like many others, have grown weary of bombastic projections and discussions about how SCHD is the only dividend ETF you'll ever need. I own SCHD, but that hasn't stopped me from warning readers about its substantial decline in estimated earnings growth rates over the last two years. The result has been slower-than-usual dividend growth and flat total returns since 2022.
As explained below, SCHD has a bright future, and based on strong profit, value, and sentiment scores, I have upgraded my rating on the fund to a "buy. Still, SCHD bulls and bears both must acknowledge the facts, which are that:
- 632/895 U.S. Equity ETFs outperformed over the last year
- 246/816 U.S. Equity ETFs outperformed over the last two years
- 181/713 U.S. Equity ETFs outperformed over the last three years
- 179/648 U.S. Equity ETFs outperformed over the last four years
- 97/603 U.S. Equity ETFs outperformed over the last five years
- 115/487 U.S. Equity ETFs outperformed over the last seven years
- 77/363 U.S. Equity ETFs outperformed over the last ten years
Bears should acknowledge that SCHD is a "survivor." Less than 50% of U.S. Equity ETFs trading today have a ten-year history, and SCHD is one of them, with performance in the top 21% over that period. Bulls should acknowledge that SCHD's recent performance is underwhelming and give weight to the warnings I've issued lately about how it's become a low-growth fund. There's no rule that the last ten years will repeat.
That's one angle I will address. But first, I want to deal with potentially misleading conclusions investors and analysts might draw by relying on third-party data providers like Morningstar. Below, I will explain why Morningstar analysts do not expect SCHD to outperform SPY over the next decade substantially, describe the assumptions that go into those projections, and have a little fun along the way by showing you how easy it is to manipulate the numbers to support a pre-determined view. I hope you enjoy this lengthy read, and keep an eye out for the Excel workbook link near the end of the article that includes fundamental metrics 100% sourced from Seeking Alpha.
SCHD Fundamentals: Provided By Morningstar
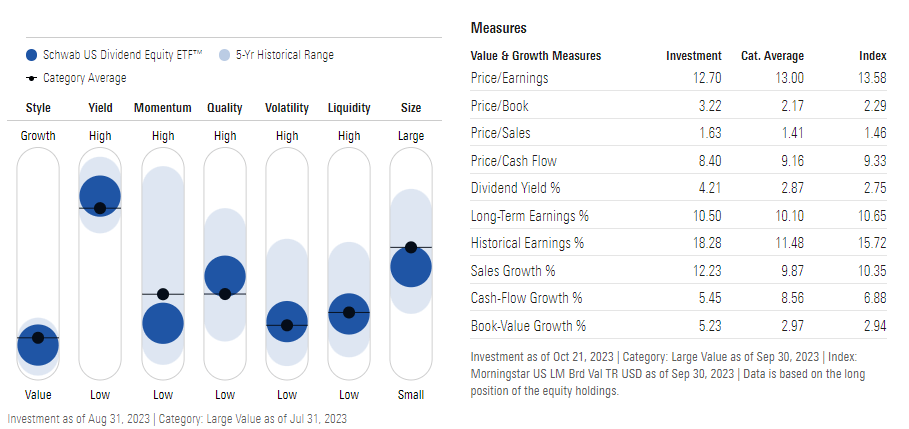
Morningstar provides the following fundamental metrics for SCHD. You can search for any ETF in the search bar at the top left and then click on the "Portfolio" tab for these details.
Before analyzing these metrics, it's crucial we know what they mean. Morningstar defines these terms on various sections of their website, and I've summarized some of the key ones we'll be discussing today as they relate to portfolios, not stocks.
Valuation Ratios: P/E, P/B, P/S, P/CF
Effective November 30, 2005, Morningstar changed its methodology for calculating trailing twelve-month valuation ratios like price-earnings, price-book, price-sales, and price-cash flow for portfolios. Morningstar now uses the harmonic weighted average, which is always a lower value than the simple arithmetic weighted average. To illustrate the difference, consider a two-stock portfolio with the following price-earnings ratios and weightings:
- Stock ABC: 20x / 70%
- Stock DEF: 10x / 30%
The arithmetic weighted average P/E is what you're probably most familiar with and is calculated as follows:
- (0.70 x 20) + (0.30 x 10) = 17.00x
The harmonic weighted average P/E is calculated as follows:
- (0.70 + 0.30) / (0.70/20 + 0.30/10) = 15.38x
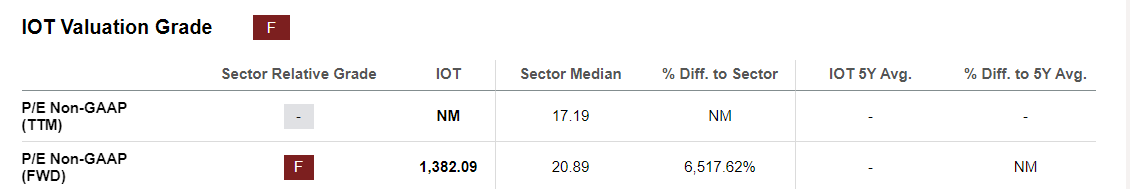
Therefore, the first takeaway is how investors relying on Morningstar metrics should refrain from cross-comparing valuation ratios of portfolios and stocks. The calculation is different, and you'll end up being biased in favor of ETFs because of their perceived lower valuations. One solution is to calculate the arithmetic weighted average P/E yourself. For this, you'll need the individual stock P/E's, their portfolio weights, and a way to control for outliers. Morningstar caps ratios at 60, which I've found is reasonable. To illustrate, the average U.S. stock with a calculable forward P/E (i.e., positive estimated earnings) trades at 26.21x forward earnings. However, only 5.19% of stocks have forward P/E's above 60, with the highest being Samsara ( IOT ) at 1,382.09. It would be wrong for that figure to substantially impact an ETF's estimated P/E because an extra $0.02 per share in earnings would cut that valuation in half, given how the company only has $0.02 in estimated EPS.
It's these little things that can make calculating a fund's valuation tricky, but as analysts, we aim to be reasonable. I calculate these ratios for 850 U.S. Equity ETFs weekly, and when I cover an ETF in detail, I note the outliers to ensure I'm appropriately representing the fund's valuation. If there are too many, I'll let readers know and admit that I don't have a good grasp on the ETF's valuation. Communicating uncertainty is more valuable than fudging the numbers to support a pre-determined view.
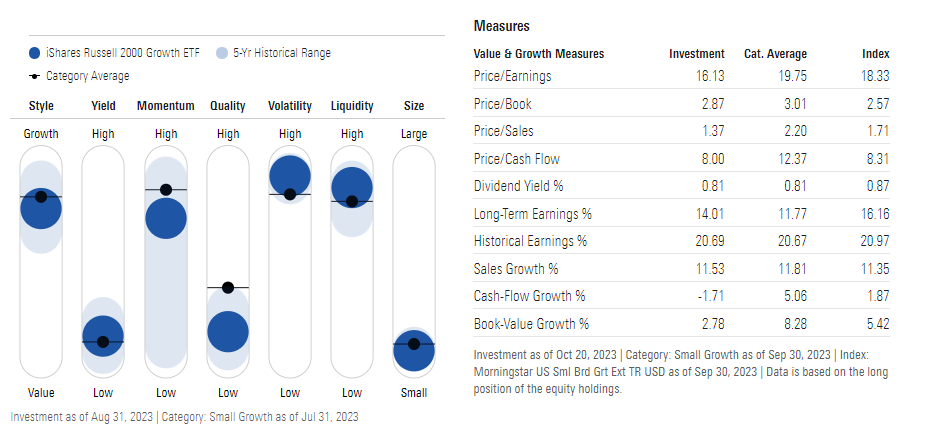
Still, there is one key piece of information that needs addressing, and that is how to account for companies with negative earnings. Negative numbers aren't allowed in the harmonic weighted-average calculation, so Morningstar excludes them. For a highly profitable ETF like SCHD, this is fine. However, for many small-cap ETFs, the result is a deceptively low valuation because so many stocks aren't counted in the calculation. One solution is to apply the same 60 cap to unprofitable stocks, essentially punishing a company for not making money. Another is to look at valuations alongside profitability metrics, and Seeking Alpha's Factor Grade system is a great tool to highlight issues quickly. For example, the iShares Russell 2000 Growth ETF ( IWO ) appears to trade at an attractive 16.13x forward earnings, per Morningstar. However, 22.08% of the fund by weight have negative earnings and, thus, aren't included in Morningstar's calculations. A further 6.80% of the fund have forward P/Es above 60.
Using Seeking Alpha's P/E estimates, I get close to the 16.13x figure above (16.96x). However, consider these alternative calculations:
- harmonic weighted average without the cap: 17.16x
- harmonic weighted average with cap applied to unprofitable stocks: 20.19x
- arithmetic weighted average with cap applied to unprofitable stocks: 32.22x
So which number is most reasonable? I wish I had the definitive answer, but the main takeaway is to know how easy it is to manipulate a fund's valuation. If you're relying on tables like these to make investment decisions, make sure you're familiar with the sensitivity of the inputs.
Long-Term Projected Earnings Growth Rate
For portfolios, Morningstar's long-term earnings growth rate is the share-weighted average of the projected earnings growth estimates for all stocks in the portfolio. The link above notes how the share-weighted average is more accurate than the asset-weighted average for this calculation, which surprised me and, again, represents a different way of arriving at what you might assume to be a standard calculation.
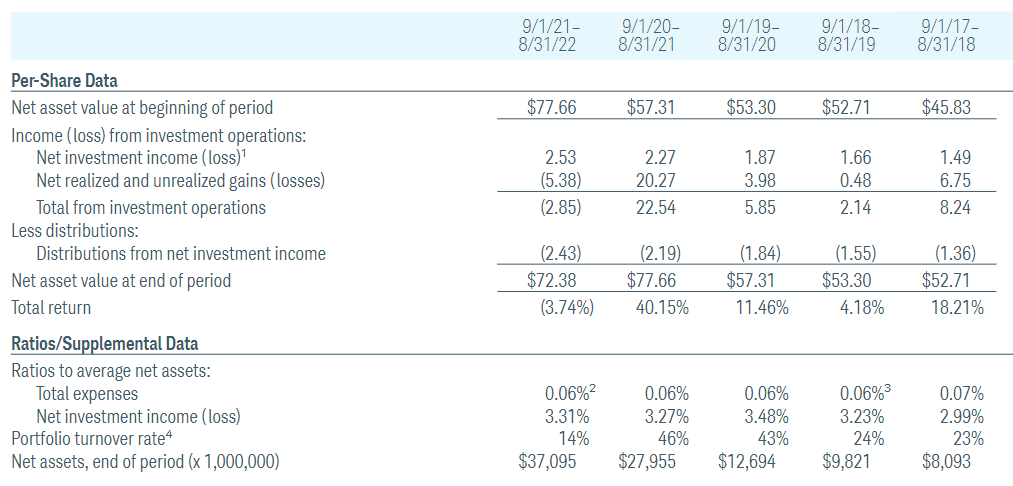
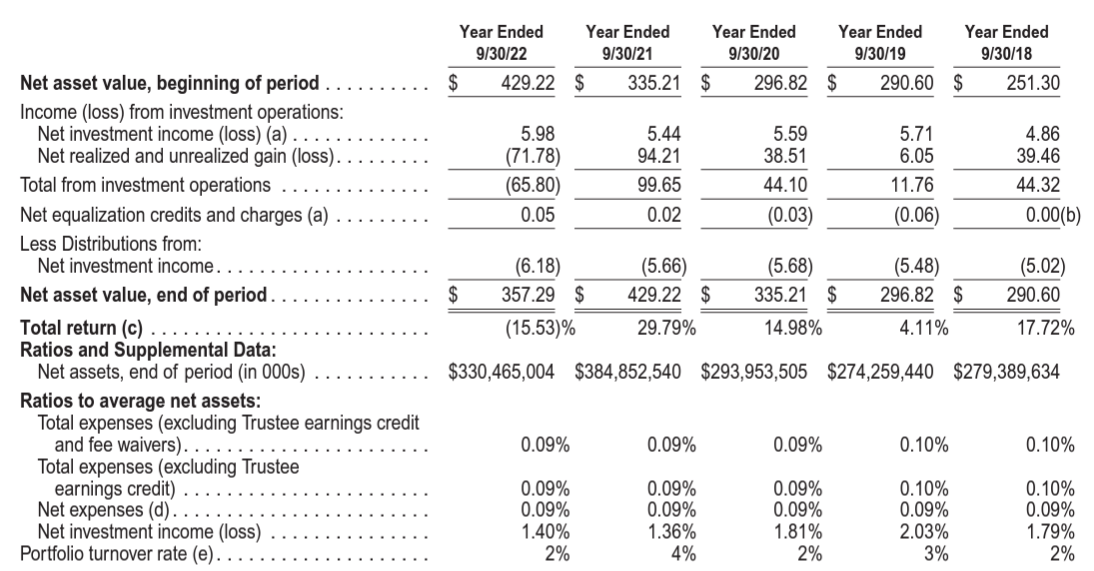
Morningstar generates this figure in-house, but the inputs are from "available third-party analysts' estimates of three- to five-year EPS growth." As a result, it's inappropriate to try to use this figure to project out anything more than five years, as I've seen in other articles. These numbers are also unreliable for rules-based funds like SCHD because of portfolio turnover. Per the table below, SCHD's portfolio turnover rate was just 14% for the most recent fiscal year. However, it was 46% and 43% in the prior two years.
Remember that SCHD is a value ETF, so it will naturally gravitate towards cheaply-valued, high-dividend stocks with lower earnings growth rates. As a value investor, you must accept this setup, which sometimes comes with less risk, and hope that valuations will normalize in your favor. Finally, remember that Morningstar's long-term projected earnings growth rates are merely snapshots of the fund today, similar to a company's balance sheet. It's inappropriate to apply this over the long term unless there's a reasonable expectation of low turnover, like with SPY. As shown below, its turnover is consistently between 2-4% per year.
Similarly, technical analysts have success analyzing low-turnover ETFs like SPY because the holdings and weights are relatively stable. In contrast, those attempting technical analysis on ETFs like SCHD with higher turnover run the risk of failing to account for holdings changes. For example, why would someone care about an ETF's price movements one month ago if it just reconstituted and has 100% different holdings? It's just one more reason why you should analyze ETFs and stocks differently.
Finally, as it relates to the long-term projected earnings growth rate, Morningstar doesn't appear to use any caps in this calculation. It's likely not too problematic, as long-term growth rates are smoothed. However, there's still the issue of how to address unprofitable companies where EPS growth rates cannot be calculated. Again, this is fine for ETFs like SCHD but could be a problem for funds holding many small-cap stocks.
Dividend Yield
The quoted dividend yield is the weighted average dividend yield of all stocks in the portfolio. Using Seeking Alpha metrics, I calculated this to be 3.96% on a forward basis and 3.94% on a trailing basis vs. the 4.21% figure provided above. Although Morningstar's figures are slightly outdated as of October 21, 2023, the difference usually is more negligible, so I assume it's due to errors in either of the two data sources. Either way, it's not a big concern. After deducting SCHD's 0.06% expense ratio, SCHD should yield approximately 3.90% at current prices.
Long-Term Projections: Fun, But Useless
I've already warned against the dangers of making long-term projections using Morningstar data. However, let's assume you still want to do it to see what total returns are possible. As a reminder, here's the table we're dealing with:
There are two components to a stock's total return: share price changes plus dividends, or more broadly, distributions. Note how only one of these statistics (dividends) is listed in the table above. You shouldn't treat long-term earnings growth as the same as share price appreciation, but some do it, and it can result in extraordinarily inaccurate projections. To illustrate, if you were to add SCHD's 4.21% yield and 10.50% long-term projected earnings growth rate figures together, annualize them, and compare them to what SPY offers, you'll get the following:
- Three-Year Total Returns: 50.94% vs. 46.52%
- Five-Year Total Returns: 98.61% vs. 89.02%
- Ten-Year Total Returns: 294.47% vs. 257.29%
You can take it up a notch and assume that SCHD is undervalued and that markets will realize this pricing error over your time horizon. We're dealing with big numbers here, so a 26% undervaluation (35% to recover) will put you at a 400% total return projection over ten years, 143% better than SPY.
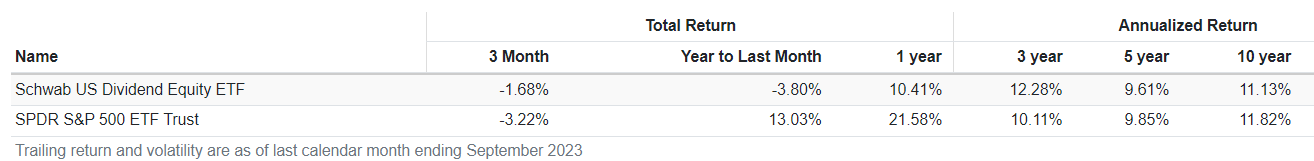
However, to believe this, you must also ignore how Morningstar's chart also lists an 18.28% historical earnings growth rate, which implies a 22.49% annualized total return when combined with the 4.21% yield. As shown below, this was far from the case and should be a red flag for any analyst considering this method.
The crucial error I purposely made is assuming the long-term projected earnings growth rate is equivalent to analyst's share price appreciation expectations. If you were to add an ETF's dividend yield to this figure, you'd violate one of the basic rules of dividend investing, which is that there is no free lunch. Companies pay dividends out of earnings, and the dividend amount on the ex-dividend date automatically reduces the share price. Effectively, this approach double counts the yield, and that 294.47% ten-year total return figure for SCHD is reduced to 171.41%, a 123.06% overstatement. That doesn't even factor in an ETF's portfolio turnover rate, changes to the long-term earnings growth rate beyond five years, and the challenges in assessing which style of investing markets will favor over an extended period.
In essence, this analysis is a fun exercise in math manipulation but doesn't provide any value to investors. Instead, my approach is to look at a variety of fundamental metrics, see how they compare with the alternatives, and judge if the odds favor a buy rating. Let's do that next, and I want to start by evaluating SCHD's composition at the sector and industry levels.
SCHD Analysis
Sector and Industry Composition
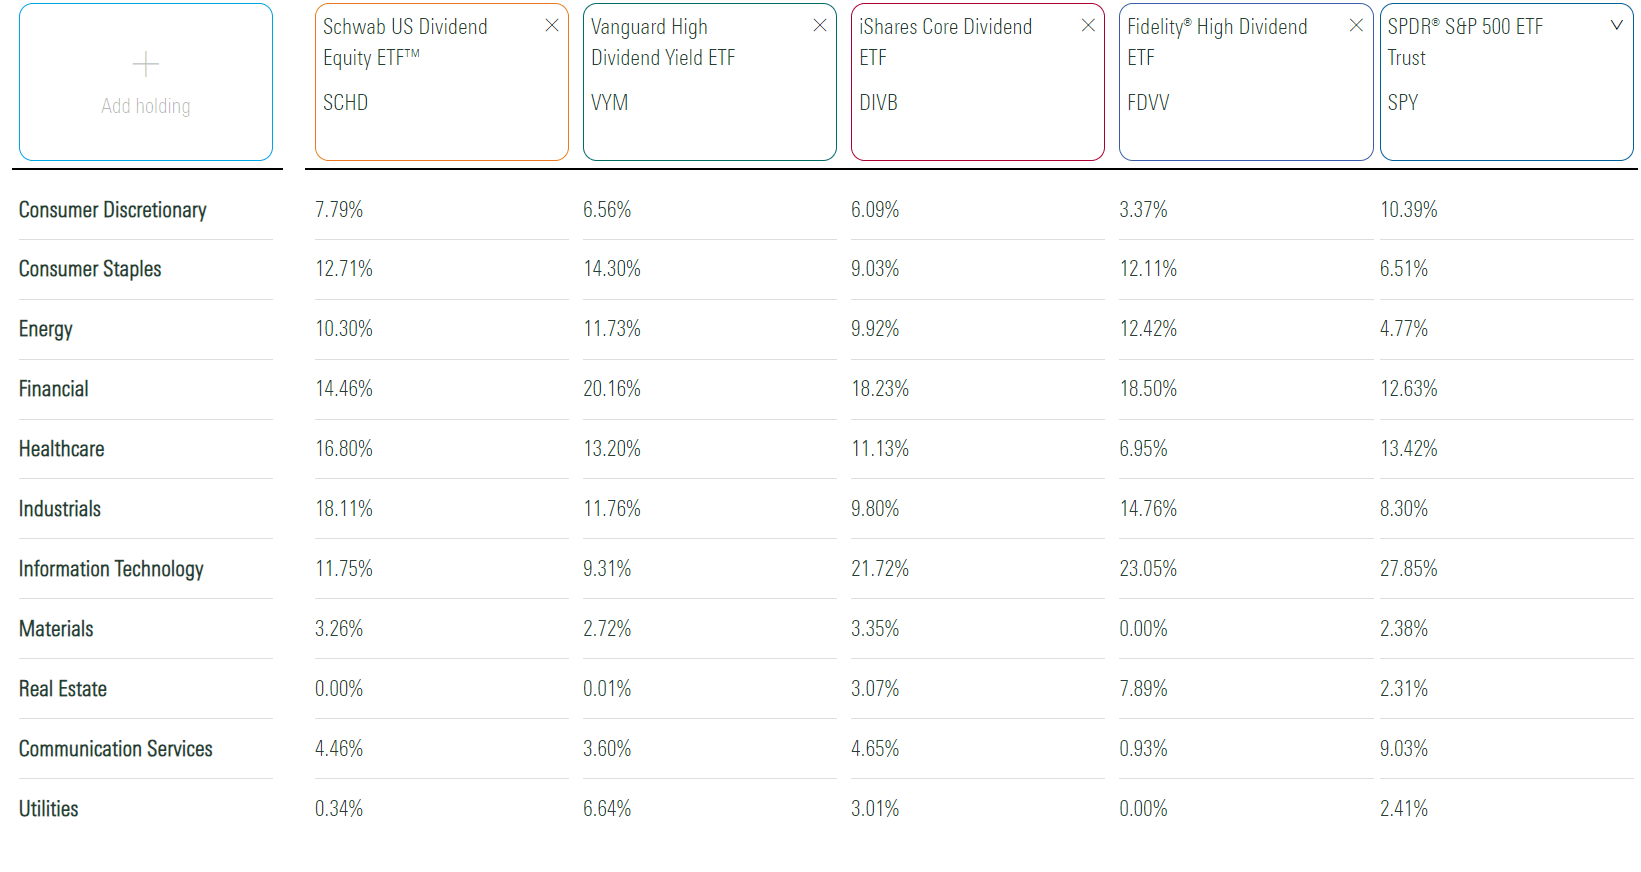
The following table highlights sector exposures for SCHD. As comparators, I've included SPY, the Vanguard High Dividend Yield ETF ( VYM ), the iShares Core Dividend ETF ( DIVB ), and the Fidelity High Dividend ETF ( FDVV ). Except for SPY, these are other high-dividend funds you might want to consider.
At the sector level, SCHD is reasonably well-diversified. No sector accounts for more than 20% of the portfolio, and zero Real Estate exposure means all distributions are qualified. FDVV has the greatest exposure to Technology stocks, so it likely has higher earnings growth potential. Meanwhile, SCHD and VYM have more significant allocations to Consumer Staples, a sector that outperformed last year but has struggled in 2023. SCHD also overweights Industrials at 18.11%, mainly consisting of investments in the Human Resource & Employment Services (5.04%), Air Freight & Logistics (3.71%), and the Aerospace & Defense (3.47%) sub-industries.
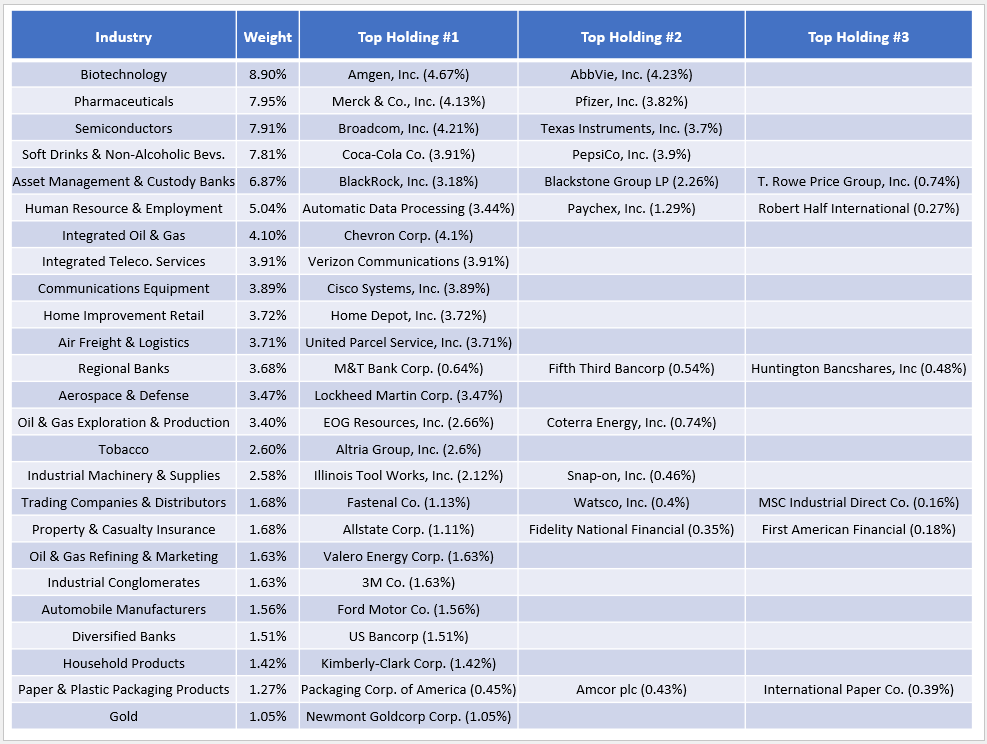
For additional detail, I've created a table of SCHD's top sub-industries, including the top three holdings (where applicable) in each. As shown, Biotechnology (8.90%) is the largest sub-industry, which includes Amgen ( AMGN ) and AbbVie ( ABBV ). Next is Pharmaceuticals (7.95%), followed by Semiconductors (7.91%) and Soft Drinks & Non-Alcoholic Beverages (7.81%).
Overall, SCHD's top 25 sub-industries total 92.94% of the portfolio. By comparison, VYM, DIVB, FDVV, and SPY have 76.13%, 75.13%, 86.47%, and 69.04% of assets in their top 25 sub-industries. Therefore, SCHD is the least diversified of the four at this level, which is why I've previously argued that it's insufficient on its own. A complementary investment in a broad market fund like SPY would work, or strategic combinations of other dividend ETFs for income-focused investors.
SCHD Fundamentals
The following table highlights selected fundamental metrics for SCHD's top 25 holdings, with comparisons to the four previously mentioned ETFs in the bottom rows.
Chart Source: The Sunday Investor; Data Source: Seeking Alpha
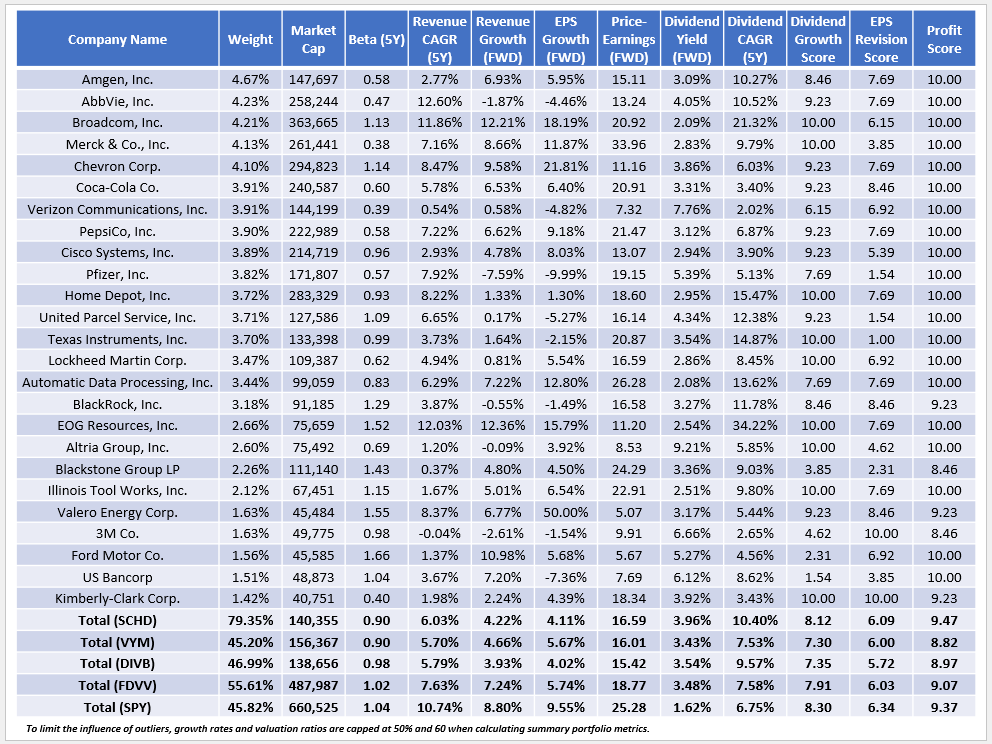
I have six observations:
1. SCHD and VYM have identical 0.90 five-year betas, implying similar volatility with the broader market. DIVB, which recently underwent a strategy shift toward high-yield stocks, and FDVV have five-year betas close to SPY.
2. One-year revenue growth estimates are lower than the five-year historical annualized growth rate across the board. For SCHD, the difference is 1.81% (4.22% vs. 6.03%), and the difference is similar for DIVB, FDVV, and SPY. VYM has held up a bit better, and its EPS growth rate is 1.56% better than SCHD's, too (5.67% vs. 4.11%). Therefore, despite a weaker track record, VYM might be better positioned than SCHD in growth-favored markets. The same is true for FDVV and SPY.
3. The sub-industries responsible for SCHD's lower growth rates are mainly Biotechnology and Pharmaceuticals. Here's a snapshot of growth metrics for the top ten sub-industries, totaling 60.09% of the portfolio.
Chart Source: The Sunday Investor; Data Source: Seeking Alpha
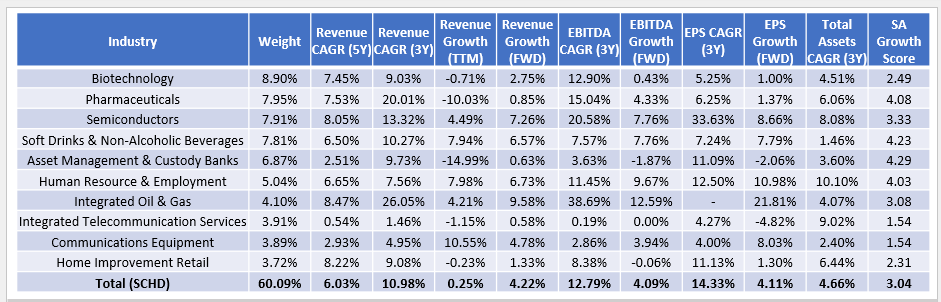
SCHD's low 3.04/10 growth score, which I derived using individual Seeking Alpha Growth Grades, is far lower than SPY's 4.94/10 score. This score is an excellent way to wrap up all the other growth metrics provided and demonstrates why SCHD will likely not substantially outperform SPY over the next decade. It could do better, especially if the value factor is favored. However, it's incorrect to argue that SCHD's selection process somehow selects the best, highest-quality growth stocks trading at a nine-point discount on forward earnings (16.59x vs. 25.28x, arithmetic weighted average) vs. SPY. That would be the "free lunch" argument I referenced earlier.
4. While SCHD isn't a good growth ETF, it consistently does several things well that value investors will appreciate. Namely, its selections are always highly profitable. As detailed in my annual reconstitution update , SCHD's Profit Score changed from 9.34/10 to 9.53/10. Today, it's 9.47/10 and backed by weighted average metrics like 24.23% EBIT margins, a 15.64% return on total capital, and 17.53% free cash flow margins. Furthermore, 98/100 companies are cash flow positive over the last twelve months, and the two that aren't have a combined weight of just 0.52%. Finally, debt loads are manageable, with a weighted-average long-term debt-to-total capital ratio of 0.49, comparable to the other three dividend funds. However, it's SCHD with the highest overall profit and value scores.
Chart Source: The Sunday Investor; Data Source: Seeking Alpha
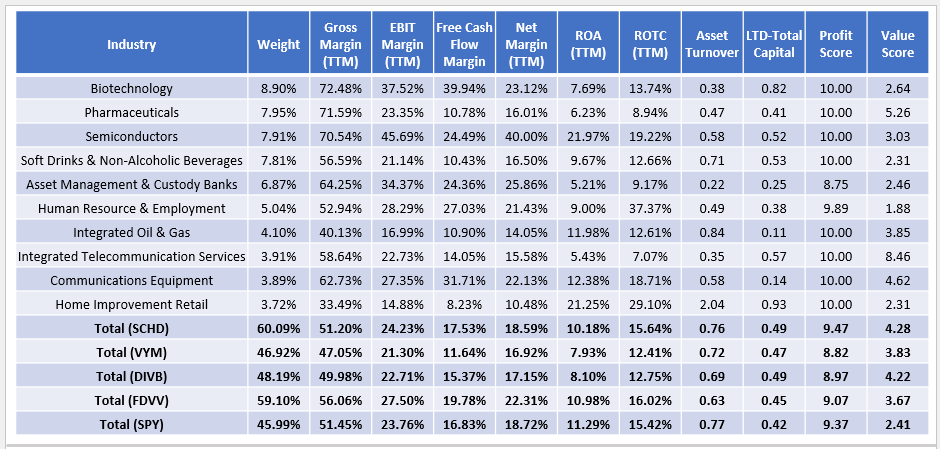
If someone handed you these results without the tickers and asked you to pick the best value portfolio, which one would you choose? I'd pick SCHD. VYM and DIVB have potential quality problems, as indicated by their lower ROA and ROTC figures, while FDVV and SPY are more growth-oriented and trade at higher valuations.
The main downside is that even SCHD's 4.28/10 value score is poor, but the solution isn't easy. You could go the extreme value route and buy the Global X Super Dividend U.S. ETF ( DIV ), which has a 7.50/10 value score. Unfortunately, its 6.92/10 profit score is a deal-breaker, and that's reflected in poor long-term returns. Next is the Invesco High Yield Equity Dividend Achievers ETF ( PEY ) with a 6.91/10 value score, but it's a high-fee fund and includes several small- and mid-cap stocks, lowering its profit score to just 6.88/10. FDVV is probably the next-best solution. The iShares Core High Dividend ETF ( HDV ) is the only other high-dividend ETF with solid profit and value scores (9.28/10 and 4.16/10), but you'd have to be satisfied with 23% exposure to Energy stocks.
The takeaway is that when it comes to high-quality, high-dividend ETFs trading at attractive valuations, it's slim pickings. Criticizing SCHD in favor of blend or growth ETFs like SPY and QQQ is fair game. However, many SCHD owners seek more income and safety, and finding a better alternative is challenging.
5. SCHD's constituents have a weighted average 3.96% gross dividend yield, or 3.90% after fees. Furthermore, its constituents have raised dividends by an annualized 10.40% over the last five years and have an 8.12/10 Dividend Growth Score. These metrics are best-in-class and another reason why SCHD is so popular. The ETF itself is on an 11-year dividend growth streak, rivaled only by VYM and lower-yielding ETFs like SPY, XLV , XLU , VTV , IJJ , and XLF .
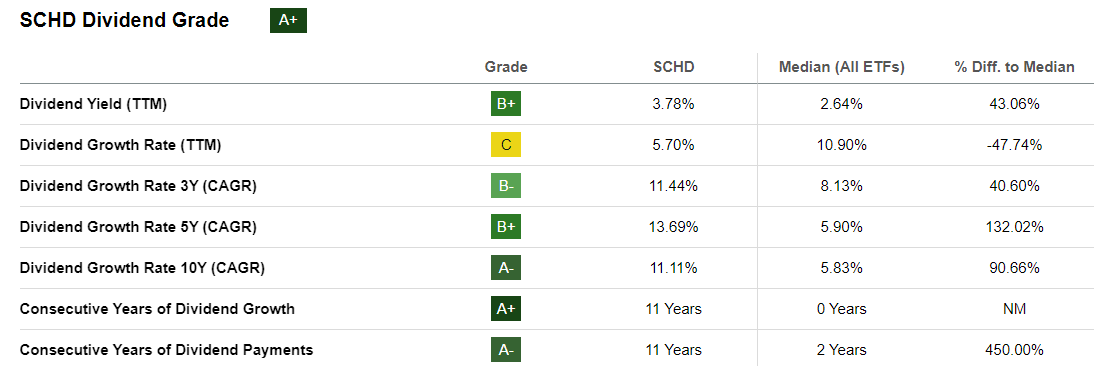
As I have in previous articles, I want to reiterate that SCHD's dividend growth rate will likely slow, so be careful about plugging in an 11.11% ten-year dividend growth rate into your yield on cost forecasts. Remember that dividends are paid out of earnings, and it's not prudent for management to grow dividends faster than earnings for long. This is why we've seen SCHD's dividend growth rate slow to 5.70% over the last year.
6. Lastly, I'm excited to see a dramatic improvement in SCHD's EPS Revision Score, which measures short- and long-term changes in Wall Street analyst earnings expectations. The 6.09/10 score is the best it's been all year and suggests the ETF is primed for a turnaround. For reference, the other scores I've recorded this year are as follows:
- January: 5.73/10
- March: 4.55/10
- May: 4.86/10
- July: 5.44/10
- September: 5.63/10
- Current: 6.09/10
Sometimes, a change in analyst sentiment is all that's needed to drive a stock or an ETF's price higher. And, when supported by attractive fundamentals, as is the case here, the odds are in SCHD's favor.
Finally, if you're curious how I've compiled all of this data, it's 100% sourced from Seeking Alpha. I've attached an Excel Workbook you can use to follow along, which includes the fundamental metrics and weightings for all holdings in the five ETFs evaluated today. Please let me know if you would like assistance navigating the workbook.
Investment Recommendation
Seeking Alpha is currently running a " Best Value Idea " competition, and I firmly believe SCHD is one of the best value ETFs investors can own today. It trades at just 16.59x forward earnings, has a 3.90% expected dividend yield, and has an excellent 11-year dividend growth track record. Furthermore, its 9.47/10 profit score is category-leading, and for the first time this year, its constituents have favorable EPS revisions. For these reasons, I've upgraded my rating on SCHD to a "buy."
Thank you for taking the time to read this lengthy review. I hope you learned something new, and if you'd like to know how other dividend ETFs compare fundamentally, please leave a comment below.
Editor's Note : This article was submitted as part of Seeking Alpha's Best Value Idea investment competition , which runs through October 25. With cash prizes, this competition -- open to all contributors -- is one you don't want to miss. If you are interested in becoming a contributor and taking part in the competition, click here to find out more and submit your article today!
For further details see:
SCHD: This 3.90% Yielding Quality Dividend Growth ETF Is Back In Buy Territory (Rating Upgrade)