SDY - SCHD Vs. SDY: Which Dividend ETF Is The Better Buy?
2023-06-02 08:30:00 ET
Summary
- SCHD has outperformed SDY since its listing date but the degree of outperformance hasn’t been consistent.
- SDY implements higher barriers during the preliminary stage of screening, but SCHD’s screening process is more elongated and fine-tuned.
- The more cheaply valued SCHD looks more enticing from a structure and income angle.
- SDY looks like a better defensive bet, whilst key pockets of its portfolio look oversold.
Introduction
The Schwab U.S. Dividend Equity ETF ( SCHD ), and the SPDR S&P Dividend ETF ( SDY ) are often bandied around as the go-to ETF options for dividend investors. The former gives greater emphasis to the fundamentals and the sustainability of dividend plays, whilst the latter focuses on stocks that have grown their dividends for at least two decades.
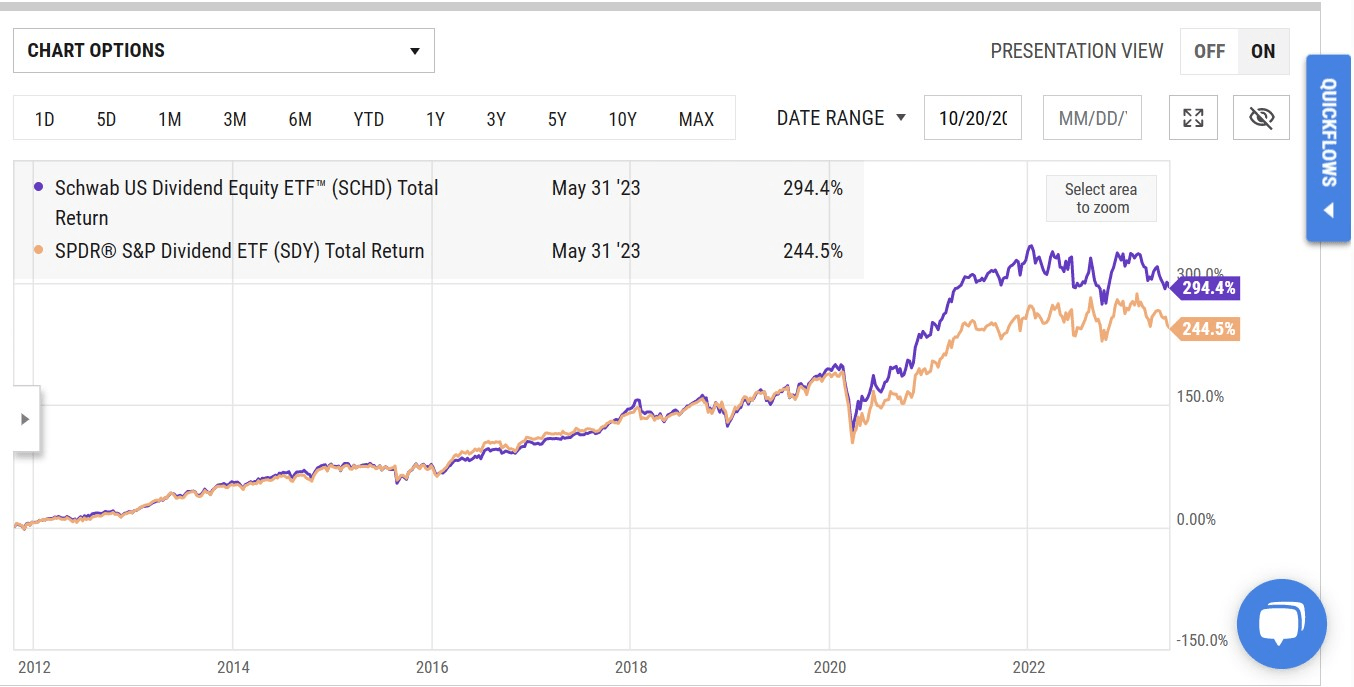
If one were to look at aggregate returns since SCHD’s inception back in Oct 2011 (SDY began its trading history 6 years prior to SCHD, in Nov 2005), it has come out on top, but do consider that this outperformance hasn’t been uniform, and much of it took place during the post-pandemic phase.
SCHD and SDY: Key Screening Considerations
For the uninitiated, SCHD tracks the Dow Jones U.S. Dividend 100 Index, a subset of the Dow Jones U.S. Broad Stock Market Index. Meanwhile, SDY follows the S&P High Yield Dividend Aristocrats Index, a subset of the S&P Composite 1500.
During the initial phase of stock selection, it’s evident that SDY levies more exacting standards than SCHD. For context, SDY expects its prospective stocks to have grown their dividend annually for 20 straight years, whereas SCHD’s expectation is limited to just 10 years of dividend payments (regardless of annual dividend growth during those 10 years). Admittedly, just because a company does not grow its dividend every year does not necessarily make it a bog-standard stock, as it could be reinvesting excess funds to enhance its IP/asset base, pay down debt, or even pursue bolt-on M&As every other year, which in turn may help bid up valuations. Also note that during SCHD’s secondary screening phase, where it seeks to determine a composite score (more on this later), it does consider the 5-year dividend growth rate of potential stocks.
SDY also has more stringent standards when it comes to the liquidity of these stocks; SDY focuses on stocks that have a 3-month average daily value traded figure of over $5m, whereas SCHD’s liquidity threshold is much lower at $2m per day on average (on a 3-month basis, here as well).
Eventually, SDY’s stocks are weighted on the indicated annual dividend yield basis. SCHD, on the other hand, goes through a few more layers of screening, where its stocks are first ranked by indicated dividend yield, and then the top 50% move on to the next stage. In the following stage, these stocks are put through a rigorous fundamental test with the goal of arriving at a composite score of the fundamental screeners including FCF to Debt, Return on Equity, etc. Eventually, the top 100 based on the composite score make it to the index where they are cap weighted).
The big takeaway from this section is that whilst SDY implements higher quantitative thresholds in weeding out stocks in the preliminary stage, SCHD’s screening process is more elongated and fine-tuned.
How Should Investors Compare These ETFs?
In order to determine which ETF is the better pick, we’ve measured these two products across six different parameters and picked a winner within each category. Here are our thoughts:
Structure
SCHD is the more stable portfolio and faces less pressure from transaction costs. Last year its annual turnover ratio came in at only 14%, around 1000bps lower than SDY, where typically 1 in 4 stocks are churned every year.
Then, one of the first things that long-term investors will look for is the expense ratio, and here too SCHD has a clear edge; its expense ratio of just 0.06% is roughly 6x lower than SDY’s corresponding figure.
SCHD’s low-cost feature makes it a very popular pick in the dividend investing space. For context, note that even though SCHD came to the bourses 6 years after SDY, it has managed to accumulate an AUM figure that is over 2x higher.
With more market participants flocking to the SCHD counter, liquidity is never a problem (average daily dollar volumes are ~5x that of SDY) with the bid-ask spreads at lowly levels. Those numbers make SCHD the more suitable vehicle for those who are fastidious about good fills and have a trading mindset.
ETF.com, Seeking Alpha
Dividend credentials
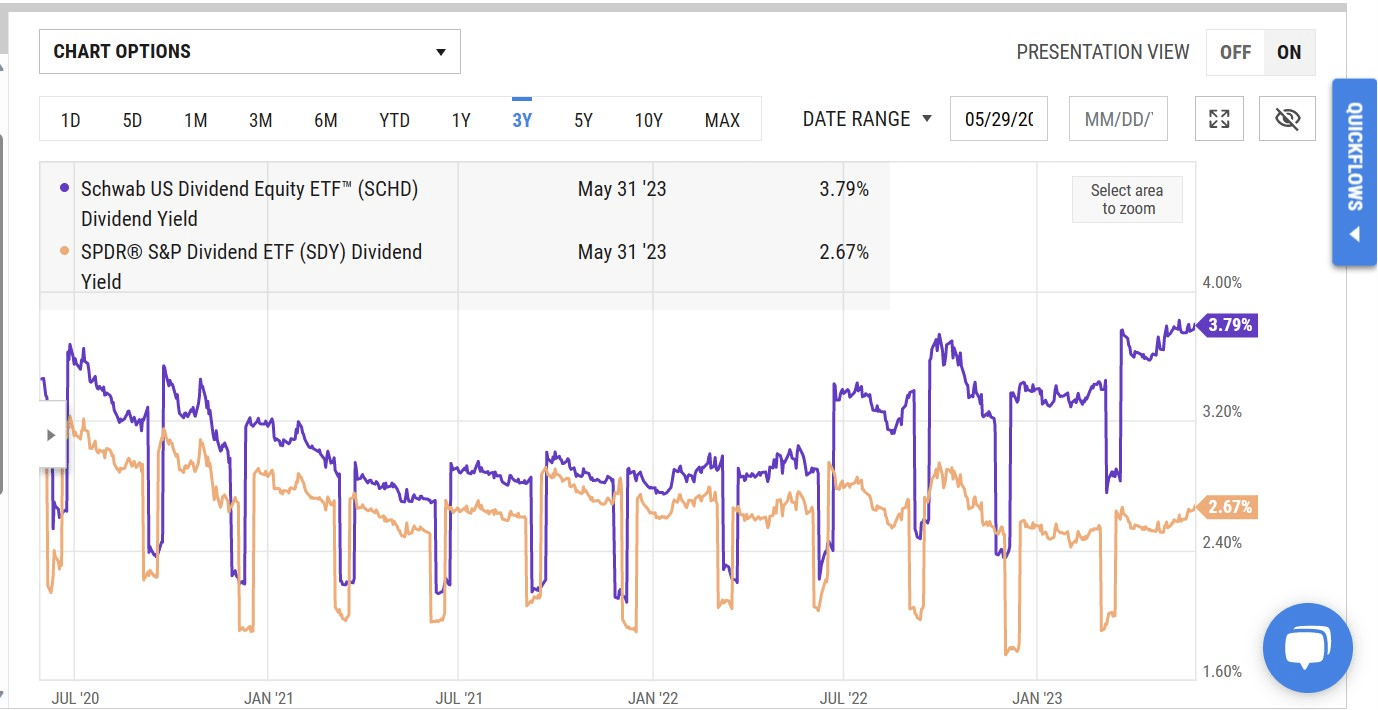
SCHD has always offered a superior yield to SDY, but around a year ago, the difference was barely 30bps. These days, it is well over 100bps. That isn’t all; if you pursue SCHD at this juncture, you’ll be locking in a figure that is 60bps higher than its own historical yield average (4-year). Conversely, with SDY, its current yield is sub-par, coming in around 5bps lower than its historical average.
Since SDY focuses on stocks that grow their dividends, one would hope that it could be generous with its dividend growth track record. Unfortunately, its dividend growth credentials are quite underwhelming as it has only grown at single-digit CAGR levels both on a 3-year, and 5-year basis. In contrast, the ETF which does not place a lot of emphasis on dividend growth has actually been a lot more generous in growing its dividends. Both in the short and medium term, it has grown its dividends in double-digit terms.
Seeking Alpha
Portfolio exposure and technical considerations
If you're keen on diversification, SDY should be your preferred bet. Not only does it cover a larger number of stocks ( 272 stocks versus 104 stocks for SCHD), it is also not top-heavy quite unlike SCHD. Even though SCHD covers over 100 stocks, much will depend on the top-10’s performance, as they account for 42% of the total portfolio in aggregate. With SDY, the holdings are more well spread out, with the top 10 accounting for only 16% of the portfolio.
Seeking Alpha
Even though both ETFs have industrials as the top sector, we feel that SCHD is a tad more aggressive in its positioning, whereas SDY is more of a defensive play.
With SDY, the 4 main defensive sectors (staples, healthcare, utilities, and real estate) account for 44% of the total portfolio, whereas these sectors only account for 30% of SCHD’s portfolio. If you think that risk sentiment could turn in H2-22, SDY would be better positioned to cope with drawdowns. Incidentally, SCHD does not have any exposure to utilities or real estate, two sectors that are also susceptible to rising rate environments. With the rising rate environment close to petering out, you could argue that money starts flowing back to these sectors.
One also gets the sense that SCHD is a little more exposed to pockets that look overbought ; tech and communication services have been the shining lights of the markets in recent months, but with valuations at sky-high levels, one does wonder if further outsized gains will be possible at these levels.
Morningstar
If one views both these ETFs from a different lens (market-cap differentials), one gets a similar takeaway. SCHD is currently heavily exposed to large-and-mega cap stocks (80% of the total holdings) whereas only one-third of SDY’s portfolio comes from that cohort. Conversely, the rest of SDY’s portfolio (67%) comes from small and mid-caps.
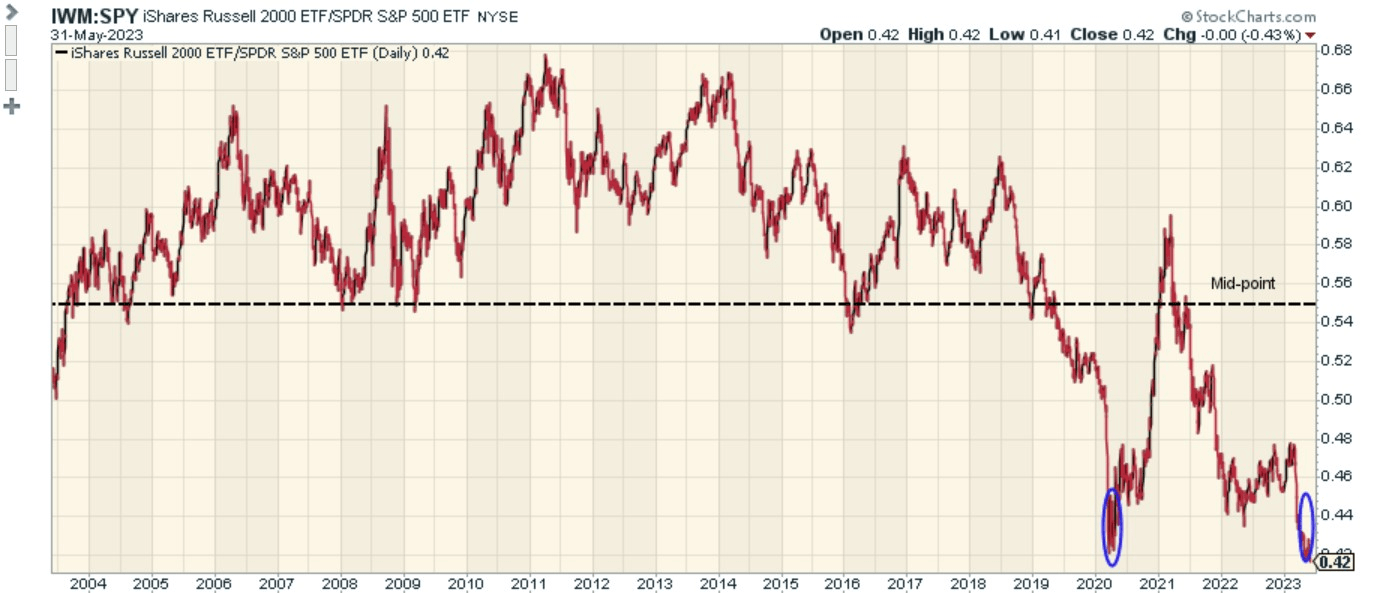
Clearly, mega-caps and large caps are in a good way but if you believe in the notion of mean-reversion in the markets, you should hang your hat on the small and mid-caps bucket at this juncture. The chart below highlights how oversold constituents of the Russell 2000 look, in relation to the mega and large-cap-based S&P 500. Also consider that this ratio has now dropped to the pandemic-era lows, a terrain from where it previously staged a smart comeback.
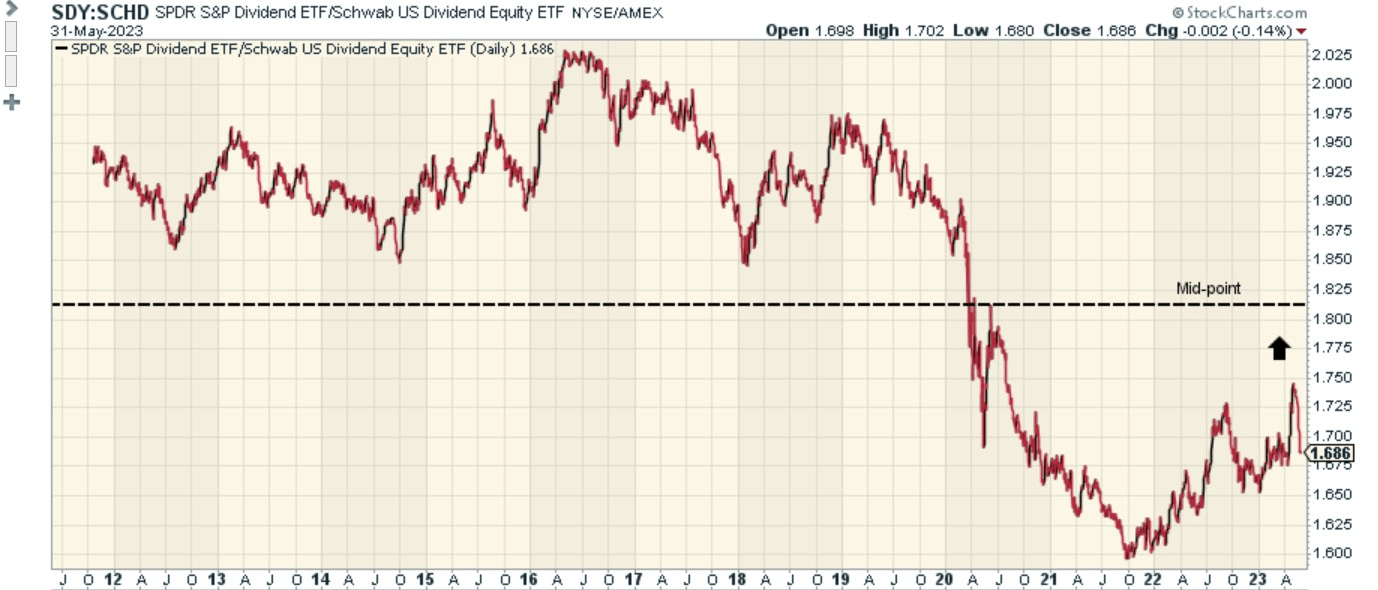
Even if you want to dismiss the small and large-cap ratio and focus on just SDY and SCHD per se, note that the mean-reversion theme currently favors SDY as the SDY: SCHD ratio is currently in the lower half of the life-long range and is around 8% off the mid-point.
Forward Valuations
According to YCharts, both SDY and SCHD will likely offer similar weighted average earnings growth potential of 7% or so, over the next 5 years. However, interestingly enough, with SCHD you’ll have to pay a lower forward P/E to get that level of earnings growth. As per YCharts, SCHD currently trades at a forward P/E of 13.6x , a 20% discount to SDY’s corresponding multiple of 17 x.
Bottom Line
We find it difficult to pick one clear winner, as there are good reasons to get behind both SCHD and SDY. Granted, SCHD has a lot more things going for it, including its superior structure, the income angle, and cheap forward valuations. However, given how oversold some of SDY's key pockets look, you can't write off the potential of a comeback at these levels. SDY also looks better positioned to protect your portfolio if risk sentiment turns south.
For further details see:
SCHD Vs. SDY: Which Dividend ETF Is The Better Buy?