VIG - SCHD Vs VIG: Which Is The Better Dividend ETF?
2023-10-06 09:25:00 ET
Summary
- Building a successful portfolio starts with a strong foundation and diversification.
- Vanguard Dividend Appreciation Index Fund ETF is the largest dividend-focused ETF with a strong track record.
- Schwab US Dividend Equity ETF has underperformed recently, but could benefit from a broad rally in Q4.
When it comes to building a successful portfolio that has the ability to build wealth over the long term, you will often hear investors say the same thing, it starts with having a strong foundation.
If you are someone that does not want to take a lot of risk, why would you have a single small-cap stock as one of your largest holdings, right, it would not make sense.
Instead, having a strong, diversified base is how you can achieve both results and a sense of safety at the same time.
The easiest way to do this is by utilizing an ETF or an Exchange Traded Fund. ETFs are one investment, but they give you ownership in hundreds and sometimes thousands of different stocks.
It is the best and easiest way to diversify your portfolio in a quick manner.
As such, today we are going to compare two of the largest and most popular dividend focused ETFs to determine which of them is the better buy in my opinion. The two ETFs we will be covering today include:
- Vanguard Dividend Appreciation Index Fund ETF (VIG)
- Schwab US Dividend Equity ETF (SCHD)
2 Top Dividend ETFs
Dividend ETF #1 - Vanguard Dividend Appreciation Index Fund ETF
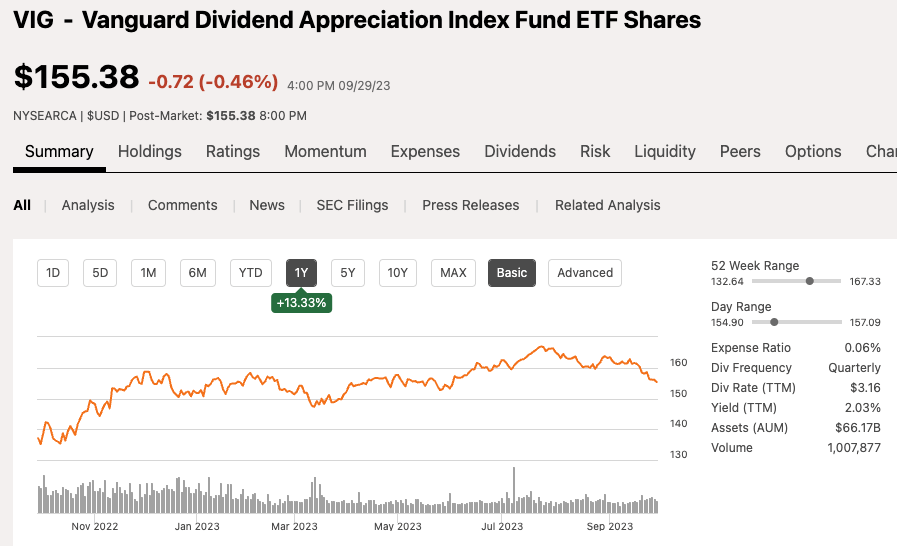
VIG is the largest dividend-focused ETF on the market today with $66 billion in assets under management, which holds them in the top 20 largest ETFs on the market today.
Over the past 12 months, VIG shareholders have enjoyed a 13% gain in share price, which is good but has slightly underperformed the S&P 500's 18% gain over the same period.
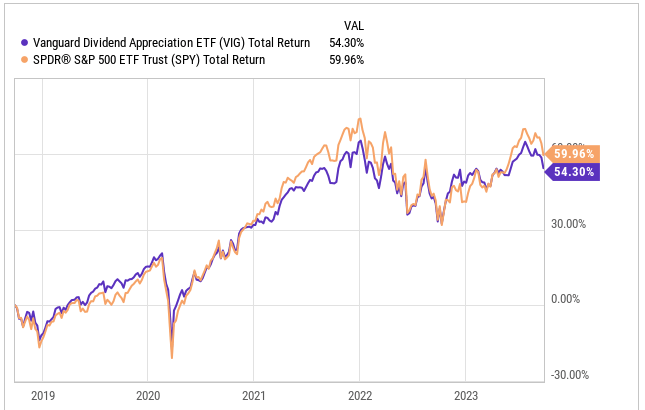
VIG has traded in lockstep with the S&P 500 for many years, as we can see in the chart below, the total return between both the S&P 500 and VIG is separated by roughly 5%.
VIG as an ETF comes with a gold star rating from the likes of Morningstar, which is the highest rating you can get from them. To be eligible for a gold star rating, the investment is expected to obtain a "positive alpha" moving forward.
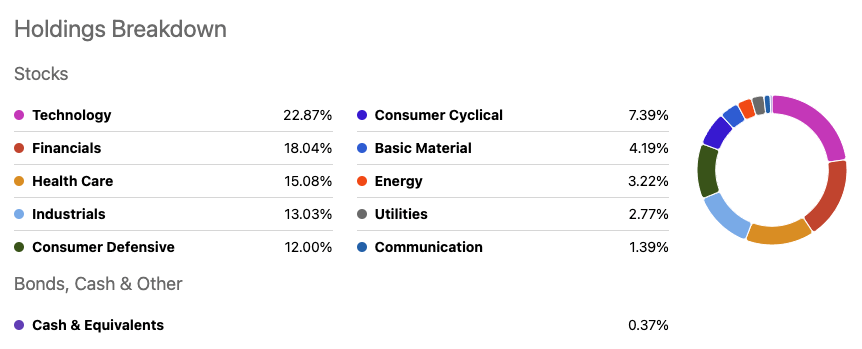
Given that VIG has traded closely with the S&P 500, this tells me they likely have a larger exposure to the technology sector, which has been the clear leader along with communication services over the past 12 months.
Checking out the top sectors below, we can see just that, the ETF has the largest amount of exposure to the technology sector, which makes up nearly 23% of the entire fund. The sectors to follow. balance out the fund with a mix of defensive and cyclical sectors. The top 5 sectors make up 81% of the entire ETF.
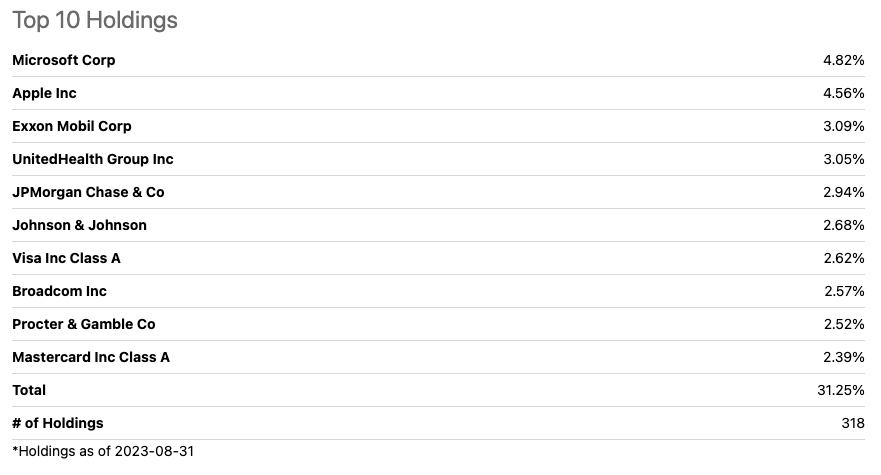
Here is a closer look at the top individual holdings within the ETF:
As expected, Microsoft (MSFT) and Apple (AAPL) claim the top two spots, accounting for 4.8% and 4.6% of the fund, respectively. However, from there we get a good mix of companies from energy, to health care, to financials, which is one reason many investors like VIG.
In total, VIG has 318 positions and the top 10 positions account for 31% of the ETF.
Looking more closely at the top three positions of MSFT, AAPL, and Exxon Mobil (XOM), let's see how their valuations stack up compared to recent history. Obviously, the top three positions do not tell you the whole story for an ETF, but it can help.
Here is a look at the top 3 positions' forward P/E compared to their 5-year historical average:
- Microsoft is trading at a forward P/E of 28.8x compared to a 5-year average of 32.3x.
- Apple is trading at a forward P/E of 26.2x compared to a 5-year average of 25.4x.
- Exxon Mobil is trading at a forward P/E of 12.5x compared to a 5-year average of 16.1x.
Exxon and Microsoft are both trading below their five-year averages, although I believe MSFT's five-year average is a bit inflated from the most recent run. The company's 10-year average is closer to 28x, which is more reasonable in my opinion.
VIG was formed back in 2006 and, as you could probably already guess, it is managed by The Vanguard Group. The fund seeks to track the performance of the S&P U.S. Dividend Growers Index that measures the investment return of common stocks of companies that have a record of increasing dividends over time.
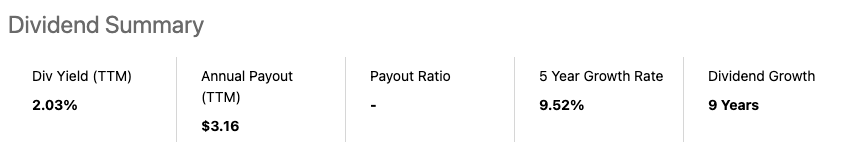
In terms of the dividend, shareholders currently earn a dividend yield of 2% and over the past five years, shareholders have seen the dividend grow at an average annual clip of nearly 10%. The dividend itself has grown for 9 consecutive years.
Dividend ETF #2 - Schwab US Dividend Equity ETF
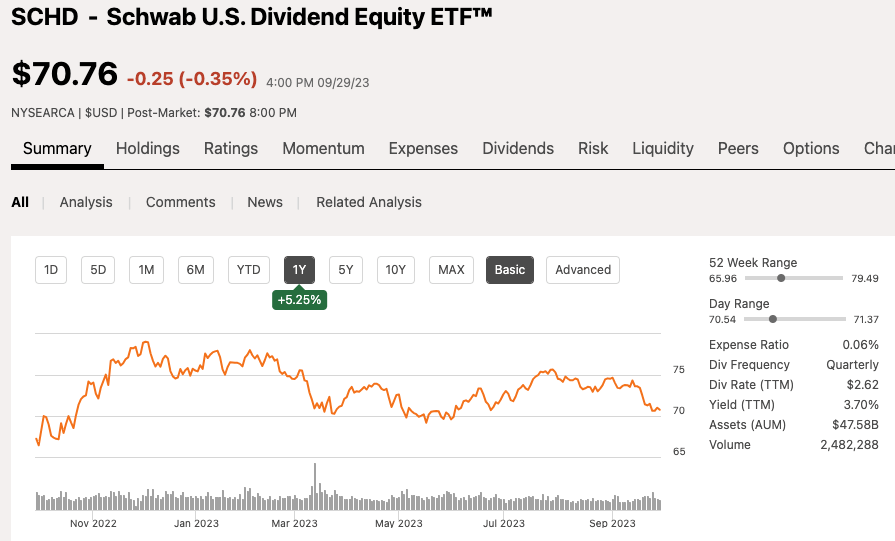
Now moving on to what has largely become the most popular dividend ETF on the market with SCHD. The ETF currently has $47.5 billion in AUM, nearly $20 billion below that of VIG. SCHD is on the verge of passing VYM, which would make it the second-largest dividend focused ETF, behind VIG.
Over the past 12 months, SCHD shares have underperformed, climbing only 5% over that period, but we will talk more about why in a second.
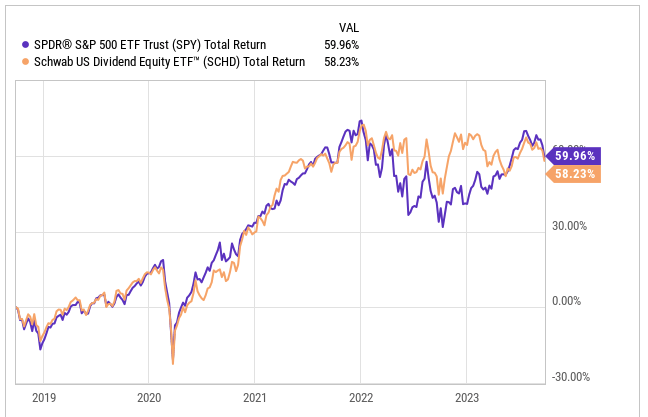
The underperformance is rare for SCHD because if you look back over the past five years, SCHD has actually been outperforming the S&P 500. Due to the underperformance over the past 12 months, the S&P 500 has taken a slight 1% lead over SCHD looking back over a five-year period. That is impressive from SCHD's standpoint.
Like VIG, SCHD also receives a gold star rating from the likes of Morningstar for its positive returns in the past and expected returns going forward.
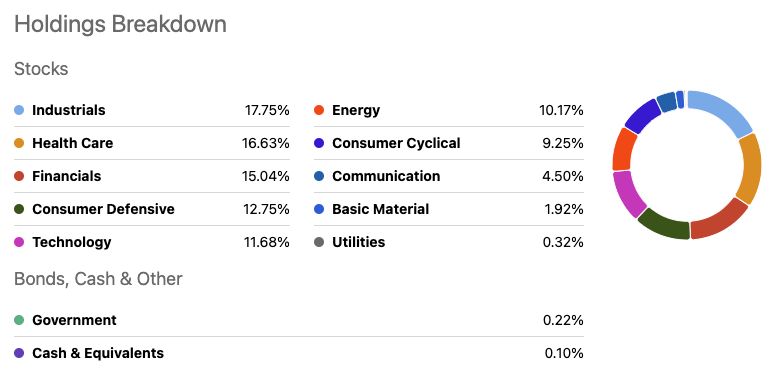
The primary reason for the underperformance of SCHD compared to the S&P 500 over the past 12 months is largely due to the fund having a lack of overexposure to technology. Looking at VIG earlier, we saw technology was the top sector, but when you look at SCHD, technology is the fifth-largest sector within the fund having only 11.7% exposure, roughly half that of VIG. As we know, technology and communication services have led the charge in 2023.
Here is a look at the top sectors:
Here is a closer look at the top individual holdings within the ETF:
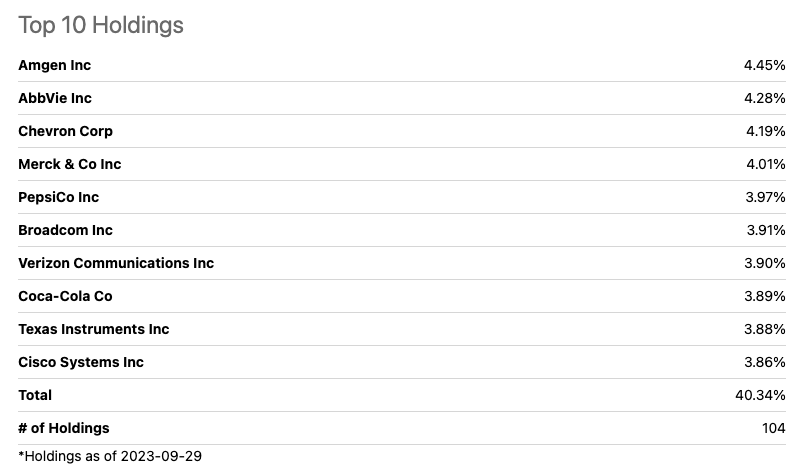
When looking at the top 10 holdings, Broadcom (AVGO), Texas Instruments (TXN), and Cisco Systems (CSCO) are the only technology companies, with the last two being spots 9 and 10.
In total, SCH has 104 positions and the top 10 positions account for 40% of the ETF. About a third of the total positions of VIG and a higher concentration on the top 10 positions.
Let's now look at the valuation for the top three positions within SCHD which are Amgen (AMGN), AbbVie (ABBV), and Chevron Corp (CVX)
Here is a look at the top 3 positions' forward P/E compared to their 5-year historical average:
- Amgen is trading at a forward P/E of 13.7x compared to a 5-year average of 14.1x.
- AbbVie is trading at a forward P/E of 13.5x compared to a 5-year average of 11.7x.
- Chevron is trading at a forward P/E of 11.7x compared to a 5-year average of 14.3x.
The top 3 positions for SCHD are flipped, with two of the top three trading below historical valuations. Given SCHD's lack of technology exposure, it has hurt its performance in 2023, but it also owns a lot of positions that look undervalued. We looked at the top 3, but as you go down the list you will come across even more positions that are undervalued, and this adds to the intrigue of the ETF moving forward.
However, on the flip side, if technology continues to outperform every other sector as it has, then SCHD will continue to lag.
In terms of the dividend, SCHD is unique as it is really not a high-yield ETF, but the yield is higher than high-yield focused ETFs like HDV and VYM. SCHD currently yields a dividend of 3.7% plus it packs a strong dividend growth record, having a five year CAGR of nearly 14% and a dividend that has grown for 11 consecutive years.
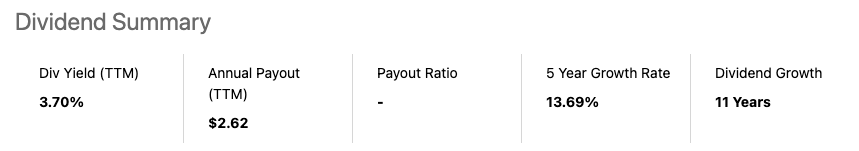
Investor Takeaway
Both of these ETFs are great choices, but if I had to choose one right at this moment, it would be SCHD. The reason being is that the technology sector has had an amazing run and could be a bit overvalued at the moment, thus if we get a broad rally in Q4, SCHD is bound to benefit.
As I mentioned in the SCHD section, from a valuation standpoint, a lot of the top holdings appear undervalued, which is why I am looking to add to my position while the ETF is down at these levels. I would like to see the technology exposure increased at the next reconstitution next year, but in the meantime, I get technology exposure from my VOO investment as well as QQQ, so not really concerned about missing out if technology continues to lead.
If we fall into a recession, technology could suffer there as well, thus a more diversified portfolio like SCHD has could prove to be safer as well.
Again, both ETFs are great.
In the comment section below, let me know which of these ETFs you prefer more, SCHD or VIG?
For further details see:
SCHD Vs VIG: Which Is The Better Dividend ETF?