VYM - SCHD: What's Driving This Leading Dividend Growth ETF To Underperform?
2023-06-12 14:27:25 ET
Summary
- SCHD is the ultimate long-term core holding for dividend growth investors. Its 3.69% dividend yield, double-digit dividend growth rate, 0.06% expense ratio, and consistently-high profitability scores are reasons to own.
- However, SCHD is having its worst year on record relative to 64 competing dividend ETFs. Its 7.09% decline through May beat just 17% of peers, compared to 18% in 2014.
- The reason is because the market is placing less importance on SCHD's 16x forward earnings valuation and more on its low 5% estimated earnings growth rate.
- Until this changes, total return investors shouldn't rush to buy more. Therefore, I've maintained my hold rating on SCHD.
Investment Thesis
Undoubtedly, the Schwab U.S. Dividend Equity ETF ( SCHD ) is an excellent play for long-term dividend growth investors. Historically, it's delivered double-digit dividend growth, and its high 3.69% starting dividend yield means investors can quickly draw meaningful income from a portfolio of high-quality stocks. However, I caution readers to temper short-term expectations because SCHD is having its worst year on record, and it's no mystery. Low expected sales and earnings growth alongside weak earnings momentum are the key drivers, and based on my fundamental analysis compared to other divided ETF alternatives, there's no reason to back up the truck just yet. I look forward to explaining why in more detail below.
SCHD Overview
Strategy Discussion
I will only briefly discuss SCHD's strategy, as most readers are familiar with the fund. Please see my March 2023 Index Reconstitution article here for a more detailed discussion.
SCHD tracks the Dow Jones U.S. Dividend 100 Index, selecting 100 U.S. securities (excluding REITs) that:
- have paid dividends for ten consecutive years.
- have a minimum $500 million float-adjusted market cap.
- have a minimum $2 million three-month average trading volume.
Securities passing these screens are ranked by dividend yield, with the top half qualifying for the next step. Afterward, the Index ranks securities by four factors:
- free cash flow to total debt.
- return on equity.
- indicated dividend yield.
- a modified five-year dividend growth rate formula.
The top 100 securities qualify, but the Index only removes a current constituent if they fall outside the top 200 to limit turnover. Finally, the Index rebalances quarterly in March, and components are weighted based on float-adjusted market cap with a maximum of 4% weighting per security.
Recent Performance
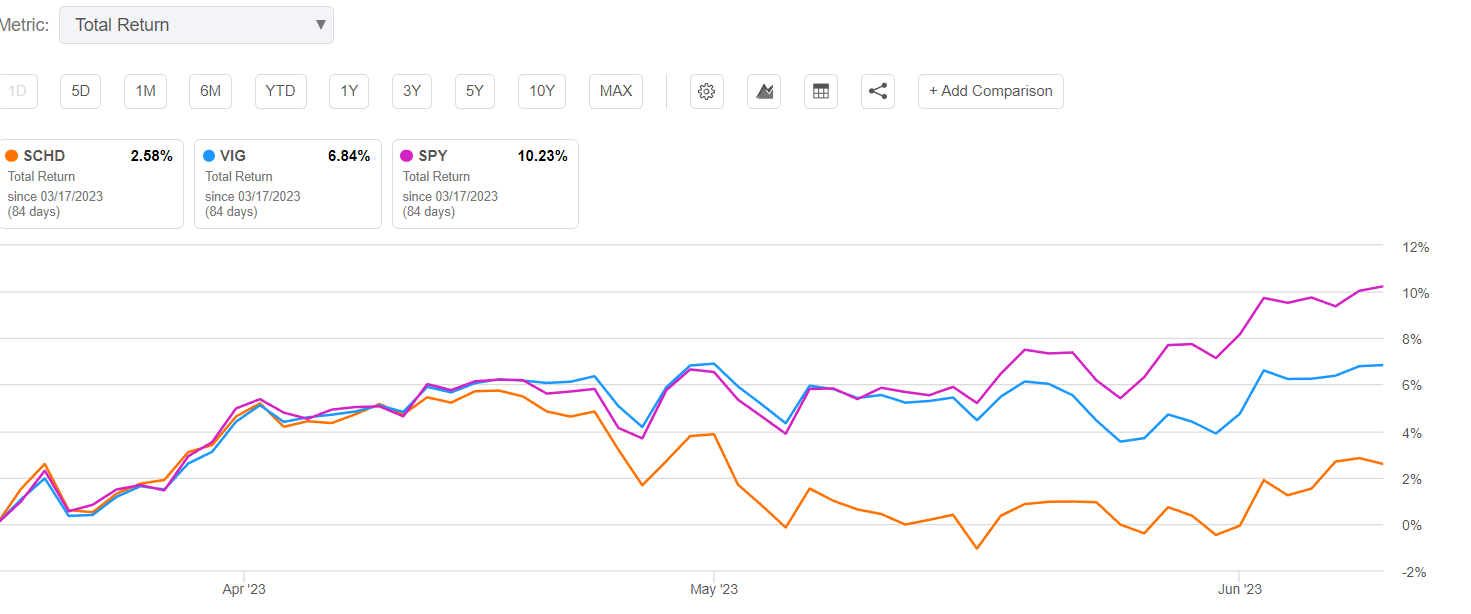
SCHD is having its worst year on record, on an absolute basis and relative to 64 other dividend ETFs. SCHD declined 7.09% through May, worse than its 5.56% loss in 2018, and has only outperformed 17% of peers YTD. SCHD beat just 18% of peers in 2014, but also gained 11.68% that year. Arguably, 2023 stings more. As a dividend growth fund, SCHD needs solid capital appreciation, too. If constituents' prices are declining while the broader market is rising, then it's likely because they aren't on as solid footing. SCHD has lagged behind the more growth-focused Vanguard Dividend Appreciation ETF ( VIG ) and the SPDR S&P 500 ETF ( SPY ) by 4.26% and 7.65% since its Index reconstituted.
Recent Performance Drivers
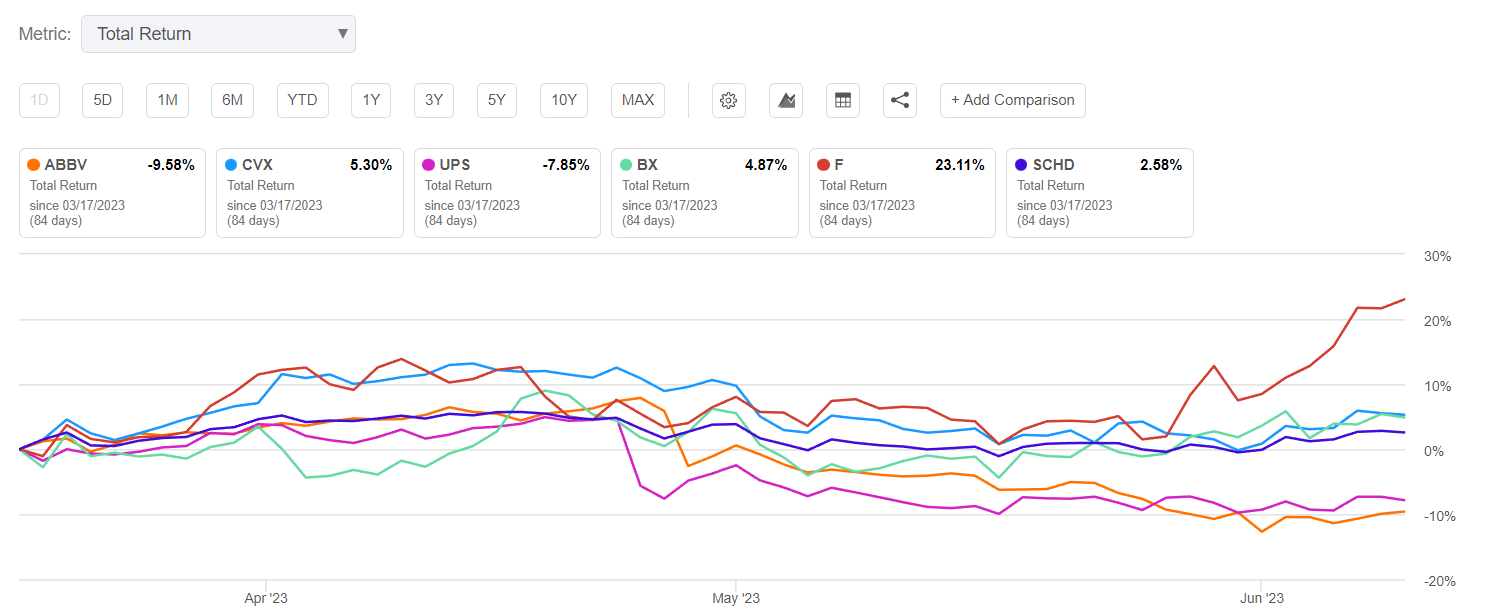
In my reconstitution summary, I noted five key additions: AbbVie ( ABBV ), Chevron ( CVX ), United Parcel Service ( UPS ), Blackstone ( BX ), and Ford ( F ). Ford received the most criticism based on my interpretation of other articles' comment sections. However, it's gained 23.11% since it was added, eclipsing the other four.
Instead, AbbVie is the main disappointment, declining by 9.58%. At the time, it had a negative estimated sales and earnings growth rate and a disastrous 1.54/10 EPS Revision Score. Quality remains high because that's what the Index screens for. But investors ignore these crucial metrics at their peril. While SCHD will never be a high-growth ETF, sufficient sales and earnings growth is required to fund dividend growth, so we must be careful not to let those figures drop too low.
SCHD's 25 added constituents experienced a 1.41% price decline between March 20 and June 9, while SCHD's price increased by 1.73%. In contrast, SCHD's 25 deleted stocks gained 2.36% since March 20, led by 7.43% and 5.28% price returns for IBM ( IBM ) and Prudential ( PRU ). Still, the net impact was negligible at approximately 0.56%, and the more significant reasons for SCHD's underperformance were poor growth and EPS Revision Scores.
To illustrate, the average price return for constituents with negative estimated earnings growth and an EPS Revision Score below 5/10 was a 5.35% loss. Examples are Pfizer ( PFE ), Verizon Communications ( VZ ), and AbbVie. For those with positive estimated earnings growth and a score above 5/10, the average price change was a 3.20% gain. Examples include Broadcom ( AVGO ), Cisco Systems ( CSCO ), and Coca-Cola ( KO ). Therefore, it's a good idea to consider these metrics that SCHD does not screen for if you're looking for a big buying opportunity rather than dollar-cost averaging into the fund.
Long-Term Performance and Dividends
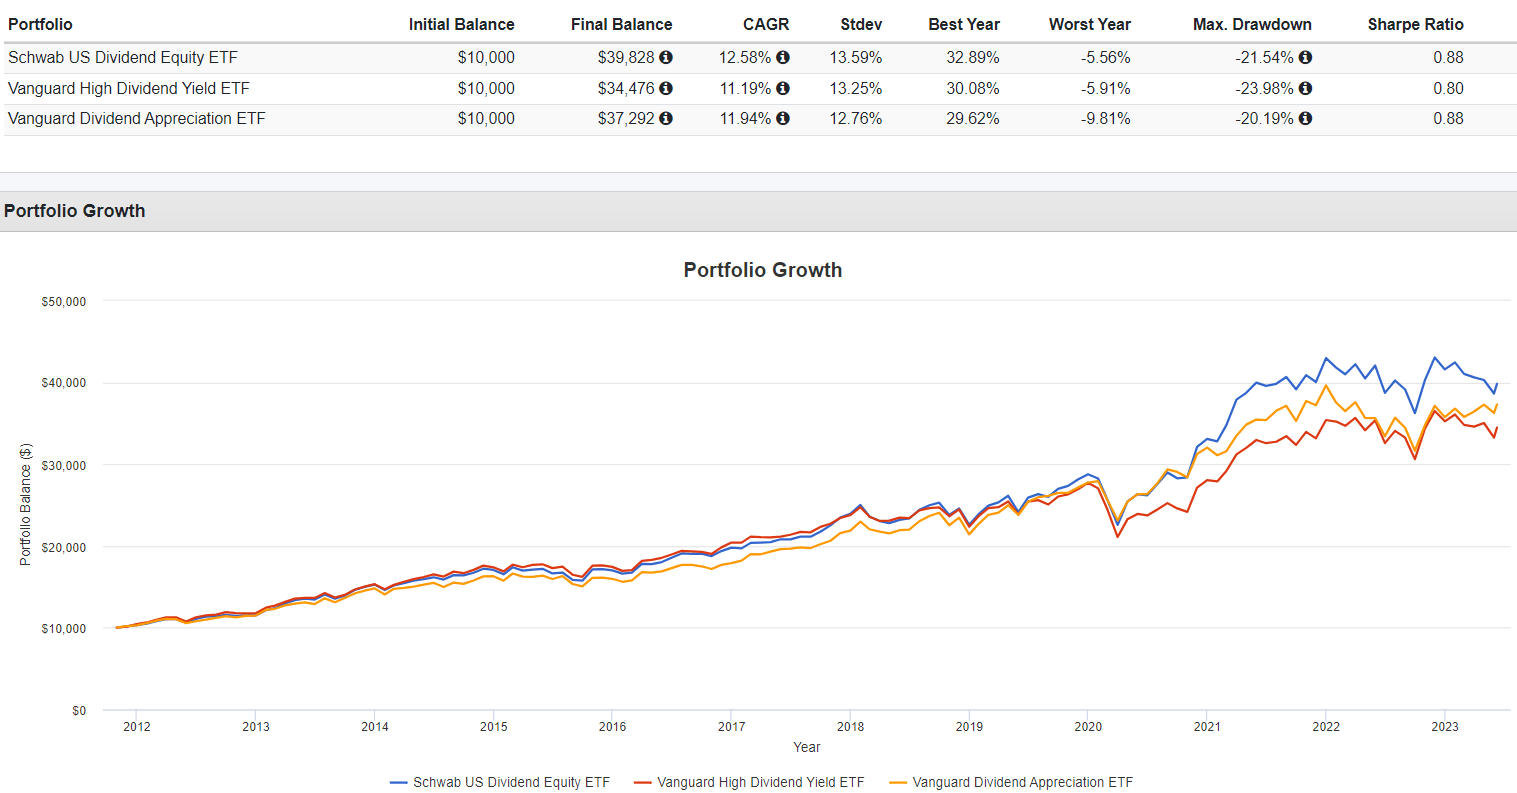
There's no denying SCHD's excellent long-term track record. If you are dollar-cost averaging and looking to build a high-quality portfolio that will distribute sufficient income several years from now, it's a no-brainer. Also, SCHD delivers relatively consistent returns. As discussed here , SCHD ranked in the first two performance quartiles 80% of the time in a peer group of 78 large-cap dividends and value ETF peers. That's not luck, and even with a lackluster 2023, it's still ahead of the Vanguard High Dividend Yield ETF ( VYM ) and VIG by 1.38% and 0.66% per year, respectively.
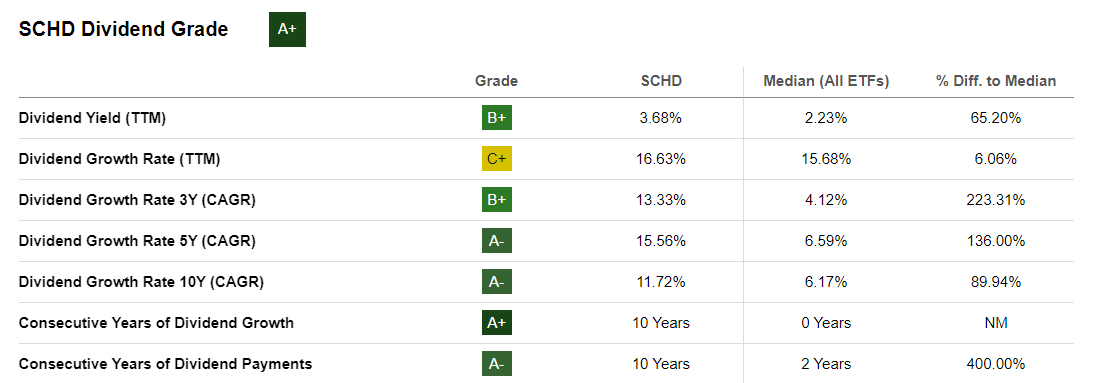
SCHD accomplishes this because of a screening process that combines quality and valuation. The return on equity screen is the most obvious way it ensures high profitability. Screening out the bottom 50% of securities by dividend yield is the valuation screen, since price and yield are inversely related. The free cash flow to debt screen suggests constituents have enough cash to raise dividends. Finally, the five-year dividend growth screen finds companies have demonstrated a willingness to raise dividends consistently. These criteria work well together, and why SCHD has a perfect A+ Seeking Alpha Dividend Grade.
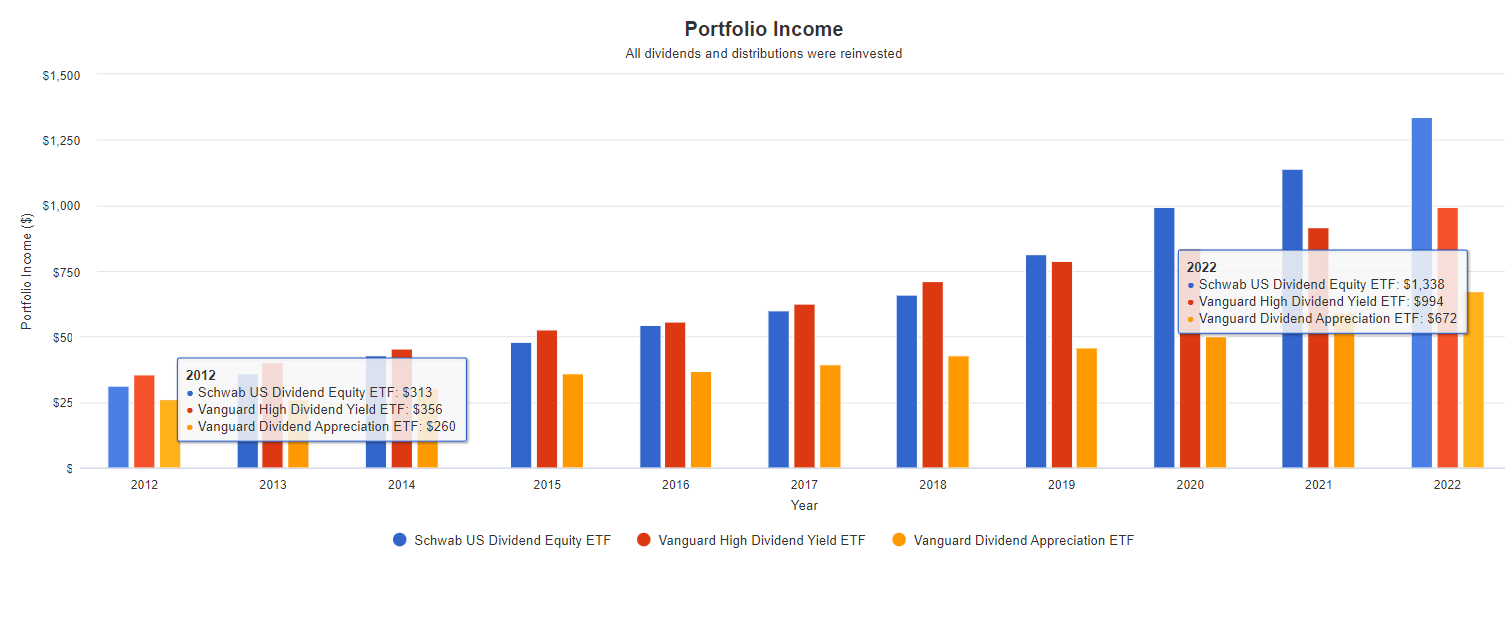
SCHD's trailing yield is 3.68%, with double-digit three-, five-, and ten-year dividend growth rates. Furthermore, it has a ten-year dividend growth streak, second only to the VYM among dividend-focused funds. To illustrate the effect, here's what your portfolio income would have been in 2022 had you invested $10,000 in January 2012 and opted to reinvest dividends.
SCHD's annual income increased from $313 to $1,338, or an annualized 15.64% over ten years, compared to 10.81% and 9.96% for VYM and VIG. Without reinvestments, the rates are 12.22%, 7.40%, and 7.75% for the three funds, so you can see how much of an impact your decision to reinvest has.
SCHD Fundamentals
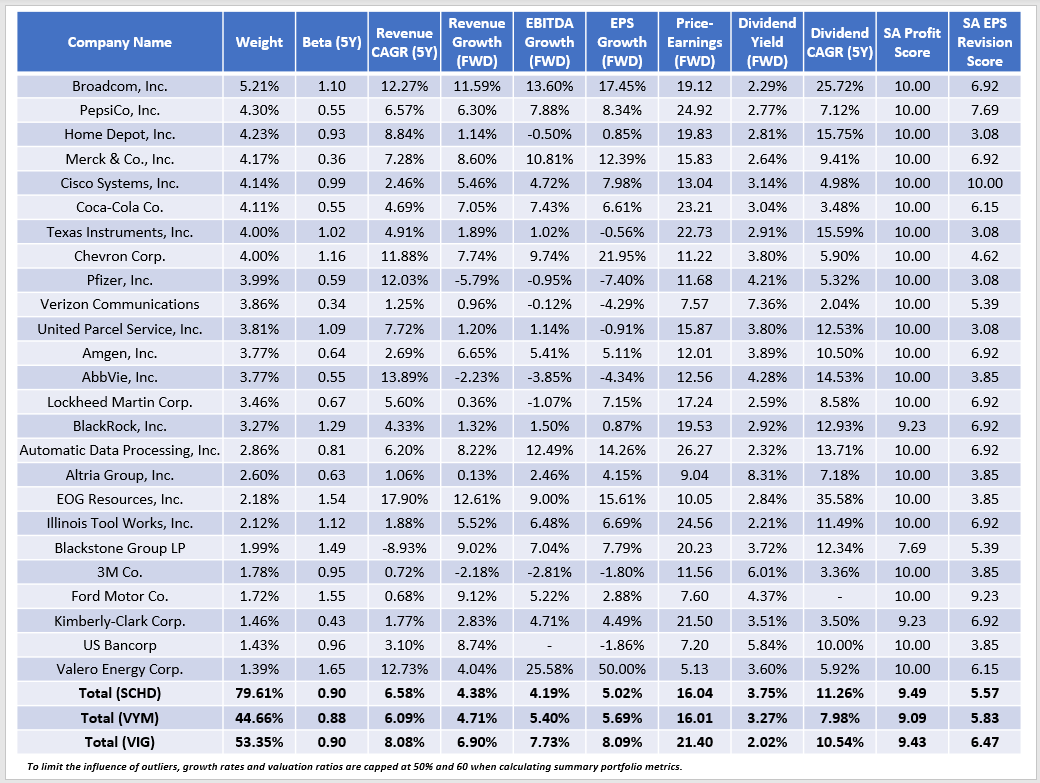
SCHD's fundamentals have improved over the last several months. However, I believe its current holdings are inferior to VIG and, to a lesser extent, VYM. Consider the following selected metrics for SCHD's top 25 holdings.
A few observations:
1. SCHD is relatively concentrated, with 80% allocated to its top 25 assets. I mentioned this before as a potential drawback, but one that's easily fixed by holding one or more well-diversified ETFs.
2. The five-year betas for all three ETFs are around 0.90, the standard for the large-cap dividend category.
3. SCHD's Index yield is 3.75%, and with a low 0.06% expense ratio, investors should net approximately 3.69%. That's 0.48% and 1.73% better than VYM and VIG. With an 11.26% five-year dividend growth rate, SCHD's constituents have demonstrated more willingness to increase dividends than these peers.
3. SCHD and VYM trade at 16x forward earnings, while VIG trades at a five-point premium. Not shown above, SCHD and VYM also trade at 13.75x trailing cash flow, but SCHD is more expensive based on trailing sales (3.70x vs. 3.00x).
4. Growth remains an issue for both SCHD and VYM. At its reconstitution date, SCHD's estimated EPS growth rate lagged VIG by 2.72% and traded at a 7.98-point discount on forward earnings. Those figures are 3.07% and 5.34 today, virtually unchanged since April.
5. SCHD's EPS Revision Score increased from 4.55/10 in March to 5.57/10 today, reflecting improved market sentiment. There's still a significant 0.90-point gap with VIG, but it's down from 1.16 points in March, as discussed in my analysis of VIG's annual reconstitution . I view this positively, but I am concerned about adding to a high-dividend ETF as the market officially entered a bull market . Furthermore, S&P 500 aggregate earnings surprises jumped to 7.1% last quarter, the best result in a year. Wall Street is more optimistic than before, so I think the valuation factor is less important now.
6. Besides the excellent combination of dividend yield and dividend growth, SCHD's best and most consistent feature is high quality. The 9.49/10 Profit Score is why I don't worry about holding SCHD for the long term. It was 9.34/10 before the reconstitution and routinely includes the same high-quality holdings like PepsiCo ( PEP ), Home Depot ( HD ), and Texas Instruments ( TXN ).
Investment Recommendation
In March, I argued why there was no reason to add to SCHD, primarily due to its poor earnings growth and momentum features. I see no reason to change that recommendation today. Its earnings growth gap with VIG increased, and I expect more underperformance if the bull market continues. Still, a 3.69% dividend yield is tough to find without sacrificing profitability, and if you decide to reinvest your dividends, you likely won't regret the decision. In short, SCHD is an excellent ETF that checks many boxes for dividend growth investors, but from a total returns perspective, I would wait before adding. Thank you for reading, and I look forward to the discussion below.
For further details see:
SCHD: What's Driving This Leading Dividend Growth ETF To Underperform?