VV - SCHG: Heavier Exposure To Earnings Power Of Apple Microsoft And Google
2023-04-27 17:16:51 ET
Summary
- The recent earnings reports of Microsoft and Google clearly demonstrated the power of big technology companies. Amazon's report is due out after the close today.
- As I said during the entire 2022 bear-market in technology stocks, I continue to say today: the leading tech stocks continue to generate fantastic free-cash-flow.
- Unlike last year, the U.S. dollar is falling. That lessens a major headwind that most of these global companies faced during the 2022 bear market.
- The SCHG ETF is a cost-efficient (0.04% expense fee) way for investors to gain concentrated & diversified exposure to the best technology companies like Apple, Microsoft, Google, and Nvidia.
- SCHG also has an excellent long-term performance track record: an average annual 10-year return of 14.4%.
As I reported throughout the 2022 bear-market in technology stocks, the leading technology companies continued to deliver strong free-cash-flow. The recent earnings reports from Microsoft ( MSFT ) and Google ( GOOG ) were a reminder and more of the same. Amazon ( AMZN ) and Apple ( AAPL ) are on deck, and I suspect they will also report relatively strong results. These companies all have strong global brands, are cash-rich, and are buying back tons of stock. That being the case, these companies are a must own for all investors that want to build and hold a well-diversified portfolio through the market's up-and-down cycles. The Schwab U.S. Large-Cap ETF ( SCHG ) is a cost-efficient, well performing fund that is an excellent way to do exactly that. Indeed, over the past 5-years, and despite the 2022 bear-market that hit the technology sector right between the eyes, the SCHG ETF has still significantly outperformed the S&P500 as represented by the Vanguard S&P500 ETF ( VOO ):
Investment Thesis
As most of you know, the leading tech stocks have gotten so big that a handful of them now dominate the S&P500. However, that is not necessarily a bad thing given that these companies typically:
- Have great global brands.
- Generate tons of free-cash-flow.
- Are cash-rich and buying back shares.
- Are excellently positioned for the future.
That being the case, and given the previous graphic, investors should consider owning an ETF that is even more concentrated in the leading technology companies than is the S&P500.
With that as background, today I'll take a look at the SCHG ETF to see how it has positioned investors for success going forward.
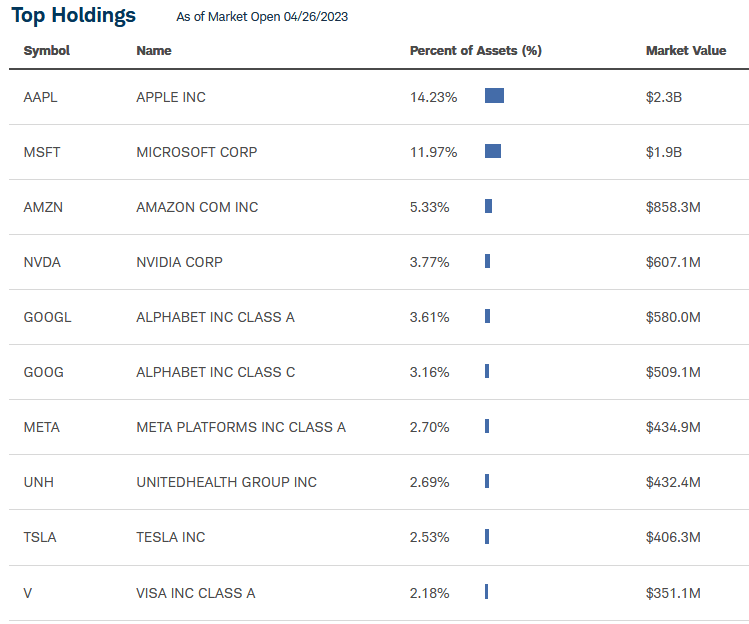
Top-10 Holdings
The top-10 holdings in the Schwab U.S. Large-Cap ETF are shown below and were taken directly from the SCHG ETF webpage where you can find more detailed information on the fund.
As can be seen in the above graphic, the SCHG ETF is heavily concentrated at the top, with Apple, Microsoft, and Google (if we count both classes of stock) equating, in aggregate, to 33% of the entire fund. In comparison, the same three companies in the S&P500 equate to less than 17% . That being the case, investors are getting almost twice the concentration in these leading tech companies in the SCHG ETF as compared to the S&P500.
The #1 holding with a 14.2% weight is Apple, which is expected to announced its earnings on May 4th, after the market close. In Q1 FY23 , Apple's installed base crossed 2 billion devices for the first time, which bodes well for the company's Services segment, which hit an all-time revenue record of $20.8 billion in Q1. Apple ended the quarter with cash, cash equivalents, and marketable securities of $51.3 billion , and that was after returning $25 billion to shareholders during the quarter.
Microsoft is the #2 holding with a 12% weight. On Tuesday, Microsoft released strong Q3 FY23 earnings that were a top- and bottom-line beat:
- Q3 Non-GAAP EPS of $2.45 was a $0.22 beat.
- Revenue of $52.86 billion (+7.0% yoy) beat estimates by $1.85 billion.
- Revenue in Intelligent Cloud was $22.1 billion (+16% yoy, but +19% in terms of constant currency).
The stock reacted strongly to the upside, perhaps partly as a result of news that the UK blocked the Activision Blizzard ( ATVI ) acquisition:
Microsoft generated $24.4 billion in net cash from operations and ended the quarter with $104.4 billion in cash , or an estimated $14/share based on 7.46 billion fully-diluted shares outstanding.
Counting both classes of Alphabet stock (sorry, I am old school - the company will always be "Google" to me), Google is the #3 holding with a 7.3% weight. Google also delivered a strong Q1 earnings report this week. While revenue of $69.787 billion was only up 3% yoy (6% on a constant currency basis), it beat the consensus estimate by $950 million . GAAP EPS of $1.17 was a $0.10 beat. Google Cloud revenue increased 28% yoy and the segment delivered positive net earnings for the first time.
More importantly, at least to me, was that Google generated $17.2 billion of free-cash-flow during the quarter. That is an estimated $1.34/share based on the 12.82 billion shares outstanding. Meantime, Google ended the quarter with $115.1 billion in cash (~$9/share) and announced a share repurchase authorization of up to $70 billion.
Amazon is the #4 holding with a 5.3% weight. Amazon is due to report earnings after the bell today (Thursday, April 27th). After Microsoft's strong cloud performance, all eyes will be on Amazon's AWS results and management commentary with respect to integrating AI functionality into AWS.
Overall, note that AI is a primary catalyst for all of the top-holdings in the SCHG ETF, including the #5 holding, Nvidia ( NVDA ). Nvidia arguably not only has the leading-edge high performance chip designs to run AI & ML algorithms, but the company is often overlooked its AI software solutions as well.
From a top-level portfolio perspective, the SCHG ETF is most exposed to the following sectors - and, not surprisingly, IT is the highest with a 46.3% allocation:
Schwab
Performance
As mentioned earlier, the SCHG ETF has a strong long-term performance track record:
Schwab
Note that the 3-year average annual return, which obviously includes last year's bear market in technology, is a very healthy 18.5%.
The following graphic compares the 5-year total returns of the SCHG ETF with competitors such as the Invesco Large-Cap Growth ETF ( PWB ), the Vanguard Large-Cap ETF ( VV ), the Vanguard Mega-Cap Growth ETF ( MGK ) as well as with the broad market averages as represented by the VOO ETF, the Invesco Nasdaq-100 Trust ( QQQ ), and the SPDR DJIA ETF ( DIA ):
As can be seen in the graphic, the SCHG ETF outperformed the S&P500 and DJIA by a significant margin, but trailed the triple-Q's by almost 17%.
Risks
From the SCHG ETF webpage referenced earlier, the SCHG portfolio as a whole has the following valuation metrics:
- P/E = 25.8x
- Price-to-Book = 6.4x
- ROE = 29.4%
As you can see, the SCHG ETF trades at a premium valuation as compared to the S&P500 (P/E = 21.8x , P/B = 4.1x ). However, given the strong return on equity of the portfolio (29.4%), the strong FCF generation profile of these companies, and their large net-cash positions, I would argue the portfolio is certainly worth the premium valuation.
The strong U.S. dollar, which was a major headwind to these global technology companies much of last year, peaked last Fall. It has continued to fall this year as the general consensus is that the Federal Reserve is close to the end of its interest rate hikes:
MarketWatch
The falling U.S. Dollar is a primary positive catalyst for these big global technology companies that garner much of their revenue overseas. For example, Google's Q1 revenue was only +3% yoy, but on a constant currency basis it was +6%.
Summary & Conclusion
Investors should consider allocating some capital to the SCHG ETF in order to achieve an even higher exposure to the large-cap companies that dominate the S&P500. These companies all generate strong FCF, have large net-cash positions, and have implemented strong share buyback programs.
I'll end with a 10-year comparison of the SCHG ETF versus the returns of the broad market averages, and note the it has outperformed both the S&P500 and DJIA, but trailed the QQQ's by a significant amount - which is why I - and any investor wanting to build a well-diversified portfolio - also own the QQQ ETF:
For further details see:
SCHG: Heavier Exposure To Earnings Power Of Apple, Microsoft, And Google