XLRE - SCHH: Worth Buying But I Like Another REIT ETF Even More
2024-01-08 07:35:29 ET
Summary
- Schwab's U.S. REIT ETF has demonstrated consistent performance, a low expense ratio, and relatively high dividend yield.
- Vanguard's Real Estate Index Fund has outperformed SCHH over the long term and has greater diversification.
- VNQ's holdings have advantages over SCHH, including lower weight on overvalued REITs and a top holding in Vanguard's institutional shares.
Investment Thesis
Schwab’s U.S. REIT ETF (NYSEARCA: SCHH ) warrants a buy rating due to its track record of consistent performance, low expense ratio, and relatively high dividend yield. Despite these positive points, Vanguard’s Real Estate Index Fund ( VNQ ) has outperformed over the long term. VNQ is a larger fund and has offered a higher dividend yield than SCHH. Finally, VNQ has greater diversification with reduced weight on several individual REITs that may have marginal performance looking forward.
Fund Overview and Compared ETFs
SCHH is an ETF that seeks to track the total return of U.S. real estate investment trusts that are classified as equities. With an inception in 2011, the fund has 123 holdings and $6.62B in AUM. As a REIT ETF, the fund is 100% in the real estate sector, predominantly in large cap stocks. For comparison purposes, other peer REIT ETFs examined are VNQ, iShares U.S. Real Estate ETF ( IYR ), and Real Estate Select Sector SPDR Fund ( XLRE ).
VNQ’s goal is to closely track the return of the MSCI U.S. Investable Market Real Estate 25/50 Index . IYR simply strives to track the investment results of an index composed of U.S equities within the real estate sector. Similarly, XLRE seeks to track the performance of the Real Estate Select Sector Index . This fund includes real estate sector within the S&P 500.
Performance, Expense Ratio, and Dividend Yield
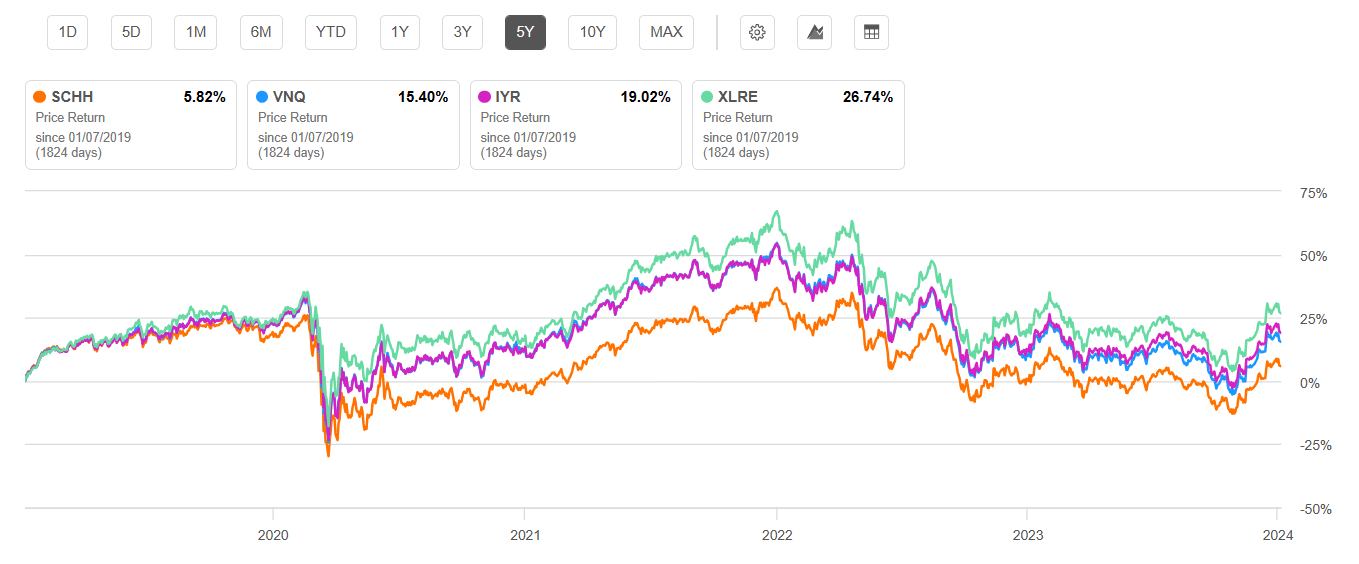
SCHH has demonstrated a history of positive capital appreciation in addition to its dividend yield. Specifically, Schwab’s fund has a 10-year CAGR of 5.14%. However, this is lower than VNQ’s 10-year CAGR of 7.35%. It also falls below other peer REIT ETFs examined IYR (10-year CAGR of 5.54%) and XLRE (5-year CAGR is 5.37%, established in 2015). Despite a lower performance history, SCHH is passively managed and therefore has a very low expense ratio of 0.07%. While this falls below VNQ’s expense ratio of 0.12%, it is not low enough to make up for the lower performance seen historically.
5 Year Total Price Return for SCHH and Compared REIT ETFs (Seeking Alpha)
While all ETFs examined, including SCHH, have long-term returns lower than the S&P 500 index, a redeeming quality is their dividend yield. SCHH has had a 3.29% dividend yield over the past year. Additionally, the dividend yield has generally been growing slightly for SCHH with a 5-year dividend CAGR of 1.75%. This is roughly on par with the other REIT ETFs compared, as shown below.
Expense Ratio, AUM, and Dividend Yield Comparison
| SCHH |
| VNQ |
| IYR |
| XLRE |
| Expense Ratio |
| 0.07% |
| 0.12% |
| 0.40% |
| 0.10% |
| AUM |
| $6.44B |
| $33.20B |
| $4.47B |
| $5.71B |
| Dividend Yield TTM |
| 3.29% |
| 4.03% |
| 2.80% |
| 3.38% |
| Dividend Growth 5 YR CAGR |
| 1.75% |
| -0.22% |
| -1.03% |
| 2.53% |
Source: Seeking Alpha, 6 Jan 24
SCHH Holdings and Its Competitive Advantage
SCHH has 123 holdings with the greatest weight on Prologis, Inc. ( PLD ), American Tower Corporation ( AMT ), and Equinix, Inc. ( EQIX ). These top three holdings are very similar to all other peer REITs compared. One notable difference is SCHH’s inclusion of Extra Space Storage Inc. ( EXR ) as a top 10 holding versus CoStar Group, Inc. ( CSGP ). Additionally, Vanguard’s top holding is Vanguard’s own Real Estate II Index Fund Institutional Plus Shares. I will cover more on this holding later.
Top 10 Holdings for SCHH and Compared REIT ETFs
| SCHH – 123 holdings |
| VNQ – 163 holdings |
| IYR – 75 holdings |
| XLRE – 31 holdings |
| PLD – 9.46% |
| Vanguard Real Estate II Index Fund Institutional Plus Shares – 13.05% |
| PLD – 9.46% |
| PLD – 12.08% |
| AMT – 7.85% |
| PLD – 7.16% |
| AMT – 7.85% |
| AMT – 10.02% |
| EQIX – 4.99% |
| AMT – 6.57% |
| EQIX – 4.99% |
| EQIX – 7.49% |
| WELL – 3.91% |
| EQIX – 5.15% |
| CCI – 3.91% |
| CCI – 4.93% |
| CCI – 3.91% |
| CCI – 3.43% |
| WELL – 3.90% |
| WELL – 4.93% |
| PSA – 3.81% |
| WELL – 3.01% |
| PSA – 3.81% |
| PSA – 4.80% |
| SPG – 3.63% |
| PSA – 2.76% |
| SPG – 3.63% |
| SPG – 4.58% |
| O – 3.32% |
| DLR – 2.69% |
| O – 3.32% |
| O – 4.19% |
| DLR – 3.21% |
| SPG – 2.67% |
| DLR – 3.21% |
| DLR – 4.05% |
| EXR – 2.67% |
| O – 2.58% |
| CSGP – 2.68% |
| CSGP – 3.39% |
Source: Multiple, compiled by author on 4 Jan 24
All ETF investors know that the future returns for the fund are tied to the performance of the individual holdings. Upon close examination of each ETFs holdings, VNQ has three advantages over SCHH found in its holdings. The first is a lower weight on AMT. The second advantage is a lower weight on WELL. Finally, VNQ’s top holding of Vanguard’s institutional shares is the final advantage over SCHH. Each of these advantages are covered in detail below.
AMT – High Valuation and Payout Ratio
The first difference is the weight on AMT. VNQ has the lowest weight on AMT compared to examined ETFs. AMT has a forward P/E ratio 49.8% higher than its sector median. Additionally, its EV/EBITDA is higher than its sector by 32.9%. In addition to its overvaluation, AMT has also seen mediocre growth. The REIT has a YoY EBITDA growth of only 5.3%, 27% below its sector median. As another concerning point, AMT’s trailing twelve-month dividend payout ratio is 421%, causing concern for its dividend sustainability. Therefore, VNQ’s lower weight for the holding is the first advantage over SCHH.
WELL – Low AFFO With Declining Dividend Yield
The second difference is the relative weight on WELL. This REIT has also demonstrated multiple indicators that imply that it is overvalued. It has a forward P/E ratio of 114.96, 234% higher than the real estate sector. Additionally, its EV/EBITDA is 55.6% higher than the sector. Regarding its profitability, its Adjusted Funds from Operations, or AFFO, yield is relatively low at only 3.39%, 51.9% below the real estate sector median. Furthermore, its AFFO growth 3-year CAGR is -8.26%. Likely as a result of this negative growth, its dividend growth rate is negative with a 5-year CAGR of -6.85%.
Vanguard’s Institutional Shares
The third difference is VRTPX, Vanguard’s Real Estate II Index Fund Institutional Plus Shares . This is VNQ’s largest holding at 13.05%. VRTPX seeks to track the performance of the MSCI U.S. Investable Market Real Estate 25/50 Index. Its individual performance is significantly higher than all other ETFs’ price return with a 5-year CAGR of 7.37%. The fund within VNQ also has 161 holdings of its own with the largest holdings in PLD and Realty Income Corporation ( O ). Because both PLD and O both have a strong performance history and do not demonstrate the same overvaluation indicators as AMT or WELL, this holding is another advantage for VNQ over SCHH.
Valuation and Risks to Investors
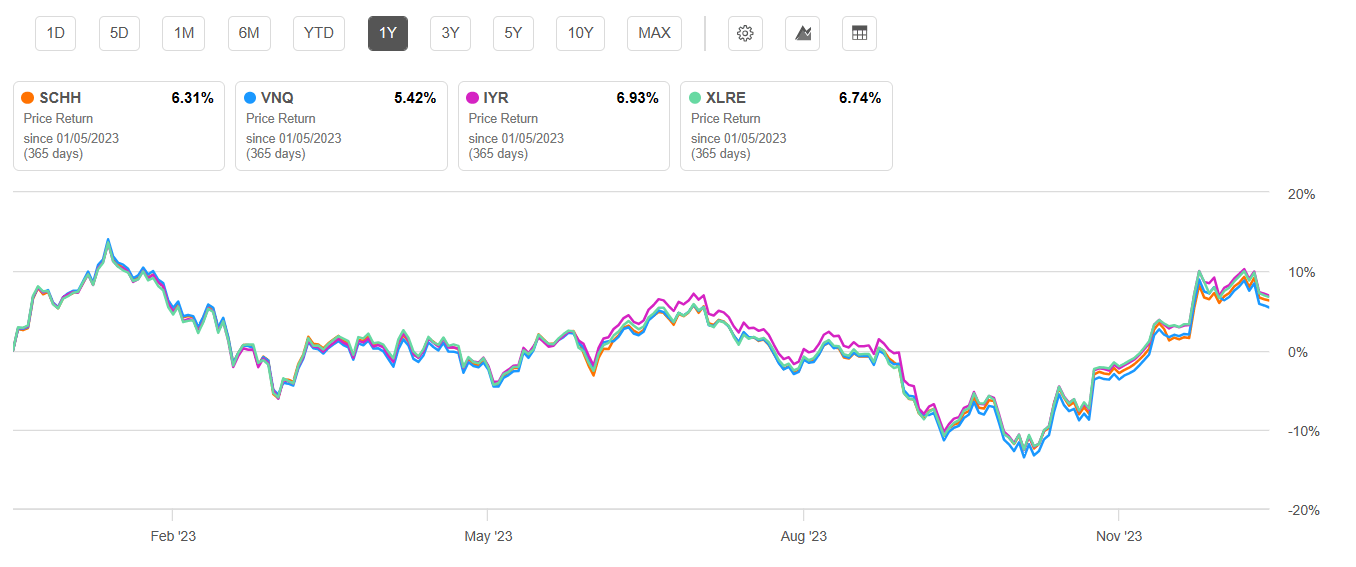
SCHH is currently trading at $20.38 at the time of writing this article. This is in the upper half of its 52-week price range of $16.63 to $21.99, but below its all-time high $26.35 seen in December 2021. In comparison to the peer REIT ETFs examined, the one-year performance for all funds examined is roughly the same.
One Year Price Return SCHH and Compared REIT ETFs (Seeking Alpha)
SCHH has a price-to-earnings ratio of 34.58, which is roughly on par with its peer ETFs examined. The fund also has a price-to-book ratio lower than all other funds including Vanguard’s VNQ. Looking forward, individual REITs typically do well during periods of rising interest rates and strong economic growth. Because interest rate cuts are generally expected in 2024 , I find it unlikely that SCHH or any peer REIT ETF will do significantly better than their long-term average performance. However, a “soft landing” economically appears likely and SCHH is a buy for me given its stable, long-term performance.
Valuation Metrics for SCHH and Peer Competitors
| SCHH |
| VNQ |
| IYR |
| XLRE |
| P/E ratio |
| 34.58 |
| 35.0 |
| 27.41 |
| 37.47 |
| P/B ratio |
| 2.19 |
| 2.2 |
| 2.53 |
| 2.87 |
Source: Compiled by Author from Multiple Sources, 5 Jan 24
Despite the relatively consistent performance and dividend yield of the REIT ETFs examined, there are risks for REITs. Top risks are rising interest rates and economic recession leading to increased volatility than “the market” overall. There is also an inherent risk with REIT ETFs because they are entirely concentrated in the real estate sector. This volatility can be seen in the fund’s beta value which is an indicator of volatility. SCHH has a beta value of 1.18 which indicates volatility greater than the overall market. Not all REIT ETFs are more volatile than the market, however. VNQ, by comparison, has a 60-month beta value of 0.98.
Concluding Summary
SCHH has proven itself with a relatively stable increase in share price (10-year CAGR of 5.14%) plus a solid dividend yield (3.28% over last 12 months). Despite these qualities as well as a very low expense ratio of 0.07%, Vanguard’s VNQ ETF has multiple more favorable qualities. These include a higher long-term track record of performance and higher dividend yield. Additionally, VNQ’s holdings mix has greater potential with its index fund shares and lower weight on REITs such as AMT and WELL. Both holdings have unfavorable valuation metrics in comparison to their growth and profitability. While I rate SCHH as a buy, I find VNQ to be preferable. Investors considering either ETF should be aware of the risks associated with the REIT industry such as sensitivities to interest rates and economic recession, for example.
For further details see:
SCHH: Worth Buying, But I Like Another REIT ETF Even More