SAIC - Science Applications International: Challenging Year Ahead
2023-04-08 09:39:21 ET
Summary
- While SAIC has a large unfunded backlog over the next year or so, it's not likely to get full benefit of it because of a weak economy.
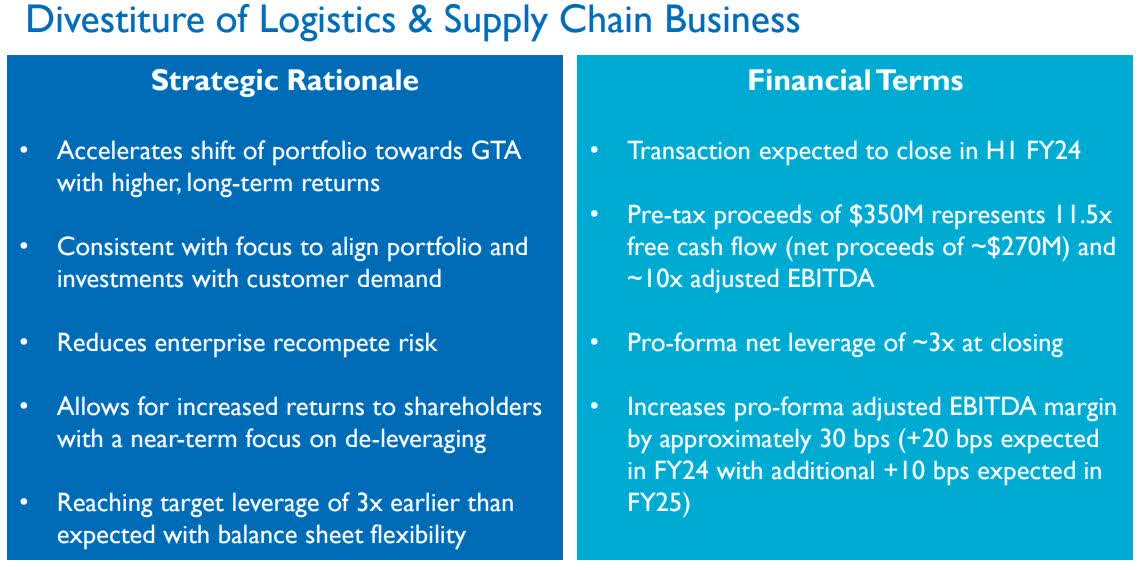
- With the divestiture of its logistics and supply chain business in calendar 2023, revenue is going to be down in fiscal 2024.
- Over the long term, expectations are margin will improve from the sale.
- In the near term, it looks like the company is going to underperform the sector median in many metrics but should start to improve in calendar 2024.
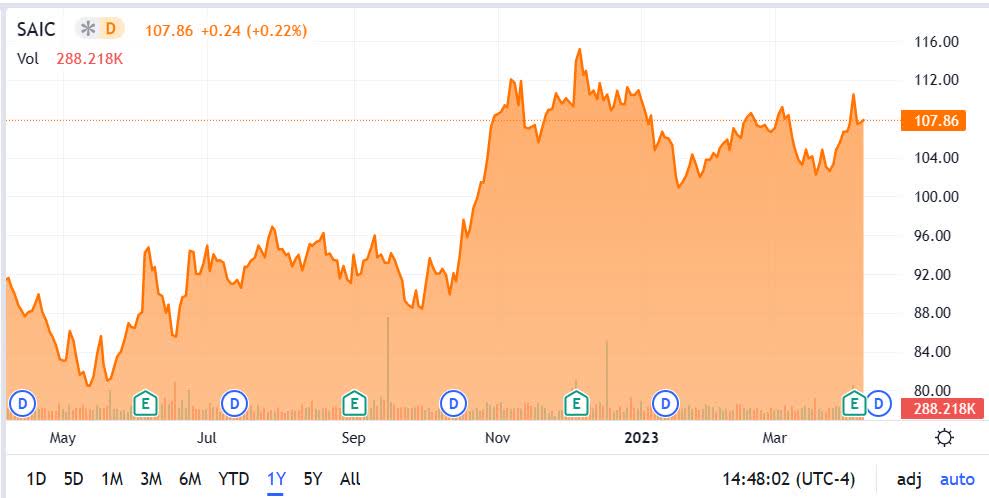
Over the last couple of years, Science Applications International Corporation (SAIC) was bouncing around between approximately $80.00 per share to $95.00 per share until May 16, 2022. From there it took off, reaching its 52-week high of $117.94 per share on December 5, 2022. Since then, it has been trading in a range of $101 per share to $109 per share.
Although it hasn't closed yet, the upcoming divestiture of its logistics and supply chain business has lowered the outlook for revenue but boosted the outlook for margins going forward. In the near term, it'll also underperform because of there being five less working days in the current quarter.
The company has decent funded backlog, but a much larger unfunded backlog that may not perform as expected if the economy goes sour and companies change their spending priorities, which I believe is likely to happen.
I think over the next year or so the company is going to face more headwinds than tailwinds, which is likely to put downward pressure on its share price. Further out, once there is more visibility on the moves of the Federal Reserve in response to inflation, and the economic fallout that normally accompanies higher interest rates, SAIC is positioned for a long-term run that is probably going to reward shareholders over time.
In this article we'll look at some of its recent numbers, important factor grades, and how the stock is probably going to trade in the near and long term.
Some of the Numbers
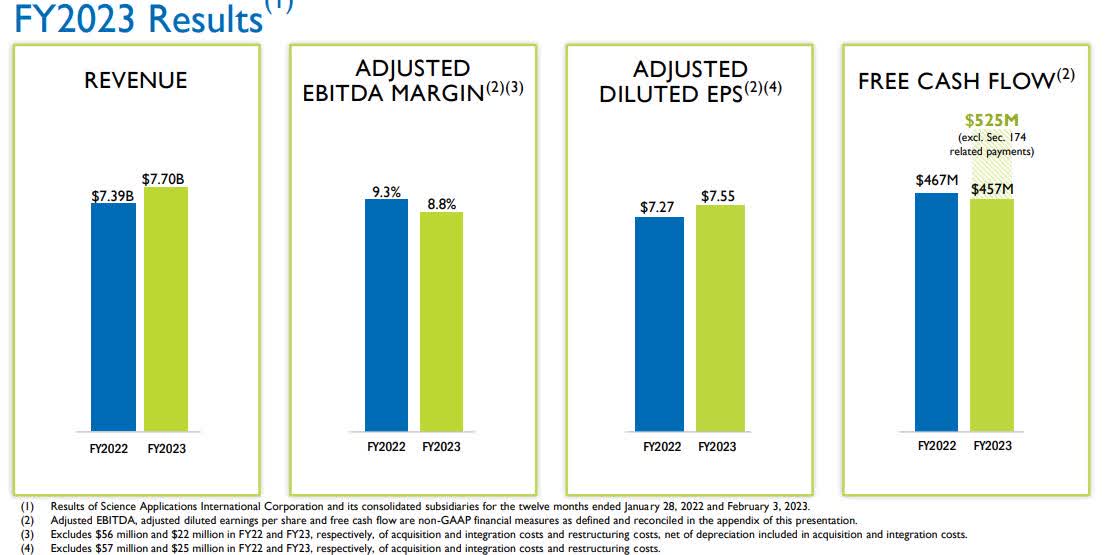
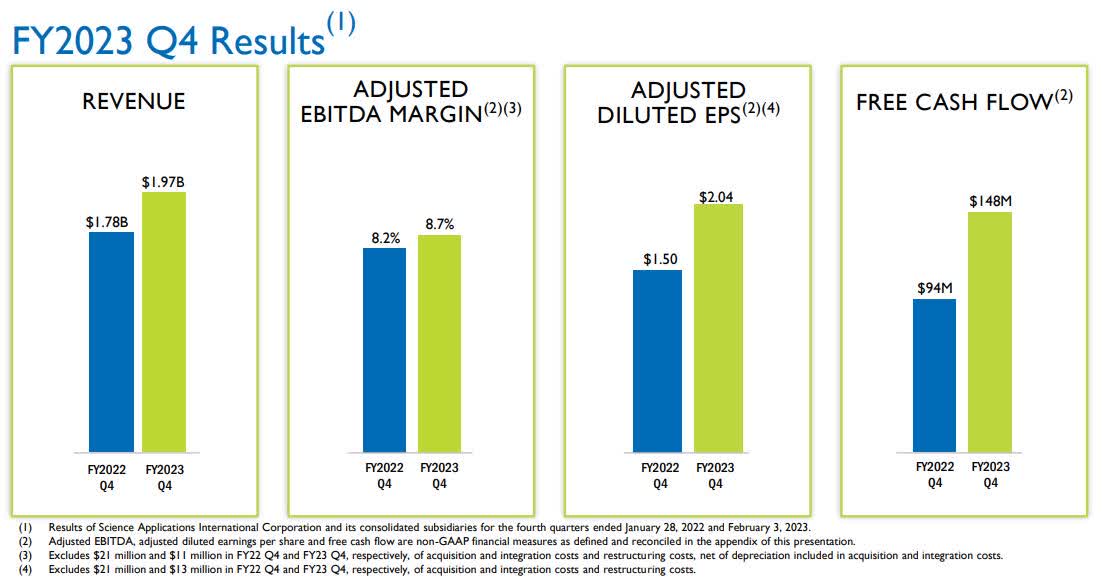
Revenue for the fourth fiscal quarter of 2023 was $1.97 billion, compared to revenue of $1.78 billion in the fourth fiscal quarter of 2022, up 10 percent year-over-year, but up only 2 percent when taking into consideration five more workdays in the reporting period compared to the same fiscal quarter of 2022. Revenue for full year fiscal 2023 was $7.70 billion, compared to revenue of $7.40 billion for full year fiscal 2022.
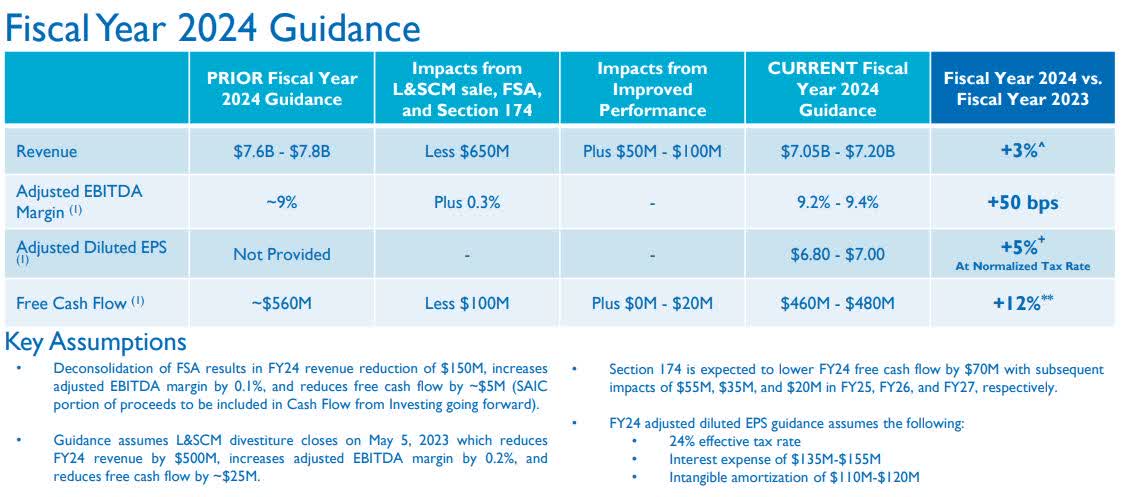
With the divestiture of its logistics and supply chain business, which has yet to close, the company guides for full year fiscal 2024 revenue to be in a range of $7.05 billion to $7.20 billion.
Net income in the reporting period was $74.00 million, or $1.34 per diluted share, compared to $43.00 million, or 0.76 per diluted share in the fourth fiscal quarter of 2022. Net income for full fiscal year 2023 was $300.00 million, or $5.38 per diluted share, compared to $2.77 million, or $4.77 per diluted share for full fiscal year 2022.
Free cash flow in the fourth fiscal quarter was $148.00 million, resulting in free cash flow of $457.00 million for full fiscal year 2023, lower by $10.00 year-over-year. That was lower than previous guidance of $500.00 million to $520.00 million because a $70.00 million tax payment wasn't included in the guidance.
Cash and cash equivalents as of February 3, 2023, the end of its fiscal year, was $109.00 million, compared to cash and cash equivalents of $106.00 million as of January 28, 2022.
The company held long-term debt of $2.34 billion at the end of fiscal 2023, compared to $2.37 billion as of January 28, 2022.
The company had a funded backlog of $3.6 billion as of February 3, 2023, and an unfunded backlog of $20.25 billion.
Some of its Factor Grades
Profitability
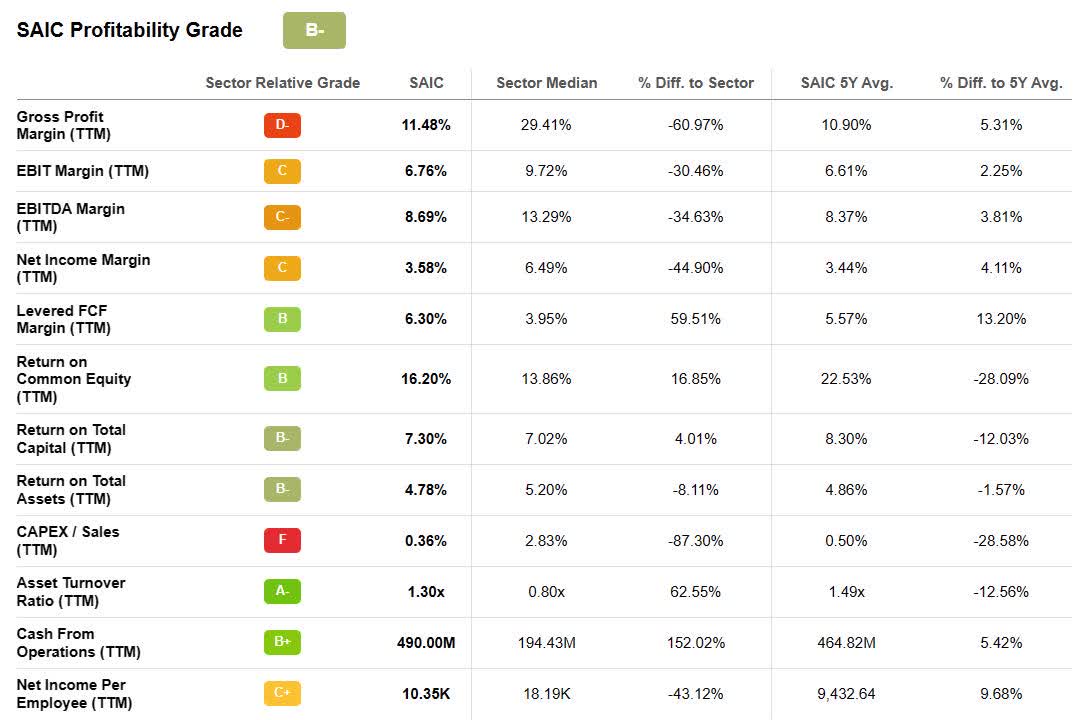
While SAIC had a decent overall B- profitability grade, in some key metrics it underperformed the sector median, such as several margin categories.
Its important net income margin metric was 3.58 percent, compared to the sector median of 6.49 percent, lower by -(44.90) percent.
EBIT margin was 6.76 percent, compared to the sector median of 9.72 percent, lower by -(30.46) percent.
EBITDA margin was 8.69 percent, compared to the sector median of 13.29 percent, lower by -(34.63) percent.
It was stronger with return on equity and return on capital, beating the sector median by 16.85 percent and 4.01 percent. With return on assets, it was lower than the sector median by -(8.11) percent.
Where it outperformed was in cash from operations, which came in at $490.00 million, compared to the sector median of $194.43 million, higher by 152.02 percent.
Growth
Its growth grade was poor in comparison to the sector median, with (YoY) revenue growth of 2.56 percent, compared to the sector median of 15.02 percent, lower by -(82.83) percent. Revenue growth ((FWD)) is -(0.36) percent, compared to the sector median of 8.55 percent.
EBITDA growth (YoY) was -(1.21), compared to the sector median of 15.61 percent. EBITDA growth ((FWD)) is 0.28 percent, compared to the sector median of 9.53 percent, lower by -(97.01) percent.
EPS diluted growth (YoY) was -(5.44) percent, compared to the sector median of 14.40 percent. EPS diluted growth ((FWD)) is 1.17 percent, compared to the sector median of 10.51, lower by -(88.92) percent. EPS ((FWD)) long-term growth (3-5Y CAGR) is 2.00 percent, compared to the sector median of 11.17 percent, lower by -(82.09) percent.
Valuation
The valuation grade of SAIC was low compared to the sector median, primarily from a number of its ((FWD)) metrics having low grades.
For example, P/E GAAP ((FWD)) was 20.28, compared to the sector median of 18.04, higher by 15.48 percent. Another was PEG Non-GAAP, which was 7.77, compared to the sector median of 1.52, higher by 411.14 percent.
One valuation metric it did well in was Price/Sales ((FWD)), coming in at 0.81, compared to the sector median of 1.23, lower by -(34.10) percent.
Based upon the divestiture of its logistics and supply chain business and fewer working days, revenue numbers will be lower for now, but margin metrics should start to improve in the quarters ahead, helping to boost its bottom line.
Management guides for margins in fiscal 2024 to be in a range of 9.2 percent to 9.4 percent, compared to margin of 8.8 percent in fiscal 2023. On the other hand, EPS guidance for fiscal 2024 was for a range of $6.80 to $7.00, lower than the EPS of $7.55 for fiscal 2023. Higher tax and interest rates are the major negative catalysts there.
Conclusion
SAIC, while enjoying a solid year in regard to its share price, is still under some pressure in a number of metrics in comparison to the sector median.
The combination of the sale of its logistics and supply chain business and five less working days, will put some pressure on revenue during calendar 2023, and if the economy worsens and spending tightens up, it will get worse before it gets better, resulting in a potentially tough year for SAIC.
Yet, if there is a recession and the share price corrects, it could be a good opportunity to take a position in the company because of its long-term prospects, even if it isn't able to meet the potential of its hefty, unfunded backlog.
With the strong performance the stock had in 2022, and the near-term headwinds it faces, I think it's due for a correction, and that would be a good time to strike based upon the long-term potential growth potential the company has.
For further details see:
Science Applications International: Challenging Year Ahead