STNG - Scorpio Tankers And Frontline: 2 Big Tanker Stocks To Buy
2023-04-11 01:23:27 ET
Summary
- In 2022, Scorpio Tankers’ net debt-to-equity and net debt-to-EBITDA ratios dropped deeply to 0.62x and 1.56x, respectively.
- Frontline’s liquidity condition is promising. Its current ratio doubled to 2.25x, and its cash ratio boosted to 1.25x at the end of 2022.
- Both dirty and clean tanker TCE rates are high and due to changing trade patterns and higher oil and CCP demand, are expected to increase further, meaning STNG and FRO.
- Oil and product net fleet growth is at record lows, supporting TCE rates.
Frontline ( FRO ) and Scorpio Tankers ( STNG ) are two of the largest tanker shipping companies, with market caps of more than $3 billion, that could benefit from the increased clean and dirty tanker rates. Tanker TCE rates jumped due to the increasing demand for crude oil and clean petroleum products, combined with changing trade patterns followed by Ukraine’s invasion of Russia. The ton-mile demand in the second half of 2023 is expected to be higher than in the first half. Also, in 2024. The ton-mile demand may increase further. Meantime, crude oil and product tanker net fleet growth is very low and could be negative in 2024. Thus, for both clean and dirty tankers, I forecast higher TCE rates in 2024. FRO and STNG are buy.
The market outlook
According to EIA , global petroleum and other liquids consumption in 2023 and 2024 is expected to increase by 1.5% and 1.8%, respectively. Also, EIA estimated the global petroleum and other liquids consumption in 2H 2023 to be higher than in 1H 2023, driven by higher consumption from China and Europe. Also, it is worth noting that U.S. consumption in 2Q 2023 is expected to be higher than in 1Q 2023. The continuing change in refined product trade flows may increase tanker freight rates in the following months. Europe is still trying to displace Russian refined products from the distant market. Also, Russia is trying to find new destinations for its refined products as EU sanctions have come into effect on February 2023. In the past few months, Brazil’s import of naphtha and gasoil/diesel from Russia increased . Also, Saudi Arabia started importing diesel from Russia on March 2022.
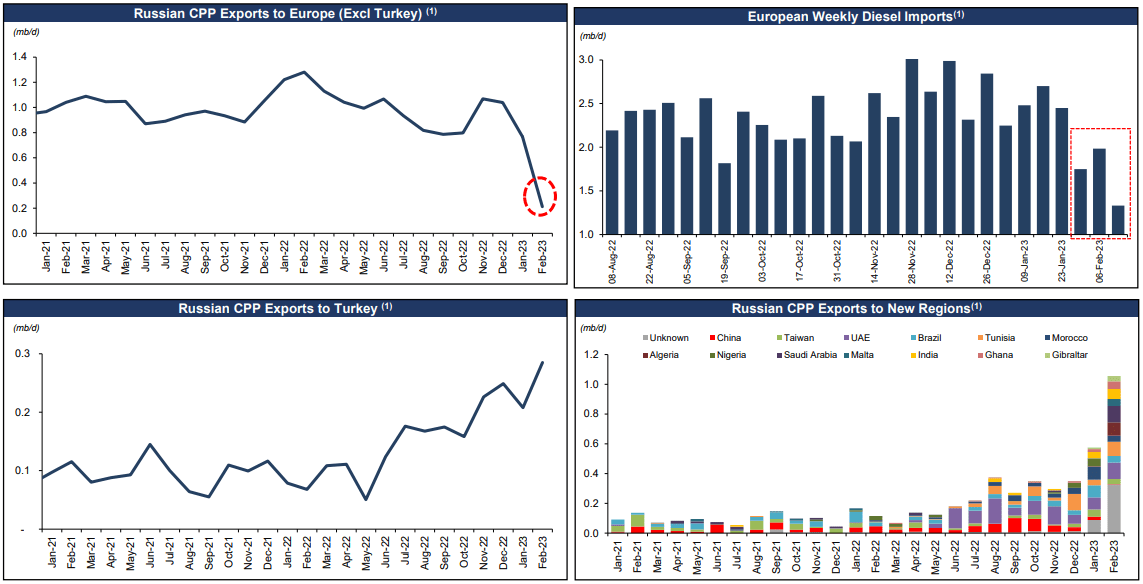
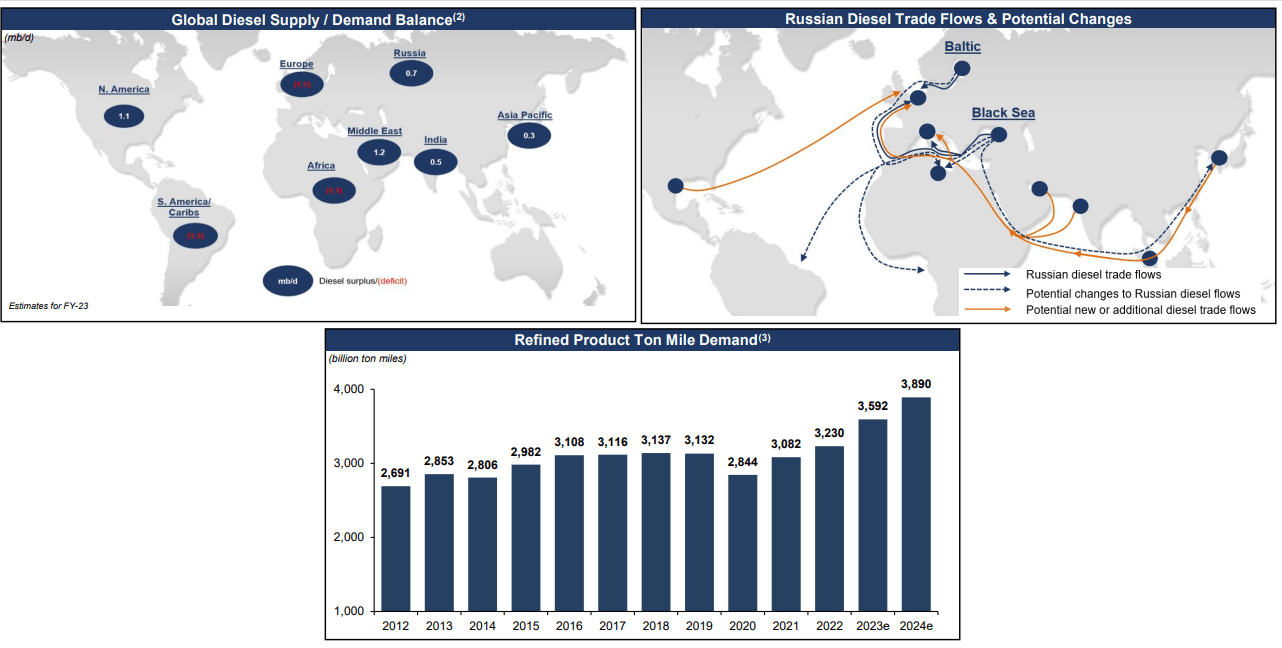
According to Figure 1 , Russian clean petroleum products ((CPP)) exports to Europe (excluding Turkey) dropped, while its CPP export to Turkey jumped. We can see that Russian CPP exports to new regions increased from less than 0.6 million barrels per day in January 2023 to more than 1 million barrels per day in February 2023. Meantime, European diesel imports dropped in the past few weeks. According to Figure 2, European countries can import CPP from the United States, the Middle East, India, and the Asia Pacific. Thus, the trade flows can continue changing, causing more ton-mile demand in 2023 and 2024.
Meanwhile, the net fleet growth is at record lows. “Despite improving fundamentals and strong tanker markets in the second half of 2022, new ordering of tanker tonnage in dwt terms was the lowest reported in 27 years,” Frontline explained in its 4Q 2022 financial results. It is worth noting that tankers fleet growth in 2024 can be negative. Thus, the market condition is in favor of tanker stocks. However, you should keep an eye on the crude oil prices and the measures of OPEC+ to support oil prices. Last week, OPEC+ announced an oil output cut of 1 million barrels per day, causing oil prices to increase. These kinds of measures have the potential to limit the crude oil demand temporarily, hurting VLCC TCE rates. However, based on the other factors that affect tanker TCE rates, I expect VLCC TCE rates to remain high in the long run. Furthermore, MR and LR2 TCE rates may increase more than VLCC TCE rates.
Figure 1 – Russian clean petroleum products trade flows and European diesel imports
Figure 2 – The potential further effects of the Russian CPP embargo on trade flows
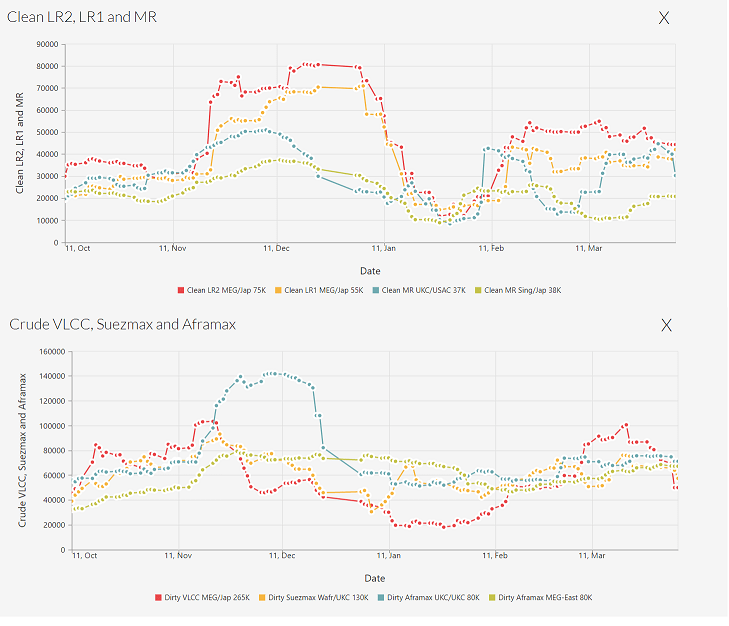
Figure 3 shows tanker rates in the past six months. In the past few weeks, dirty tanker and clean tanker rates have been increasing. Figure 4 shows that the tanker rates which are now significantly higher than a year ago, increased further in the past few weeks. However, we can see that in the past month, TCE rates for MR and LR2 tankers increased at a faster pace than other types, driven by higher ton-mile demand. As FRO has a diversified fleet, the company can benefit from higher demand for both crude oil and products.
Figure 3 – Clean LR2, LR1, and MR rates & crude VLCC, Suezmax and Aframax rates
Figure 4 – Weekly time charter estimates
www.hellenicshippingnews.com
Frontline's TCE rates
As of 31 December 2022, Frontline had 70 tankers, with an aggregate capacity of 13.1 million DWT, including 21 VLCCs, 27 Suezmax tankers, and 18 LR2/Aframax tankers. In January 2023, Frontline took delivery of two remaining VLCC newbuildings, sold the 2009-build VLCC for gross proceeds of $61.0 million, and sold the 2009-build Suezmax tanker for gross proceeds of $39.5 million. FRO’s VLCCs, accounted for 26% of its TCE revenues in 2022, compared with 31% in 2021. Suezmax vessels accounted for 44% of FRO’s revenue in 2022, flat YoY. LR2 tankers accounted for 30% of its TCE revenues, compared with 25% in 2021.
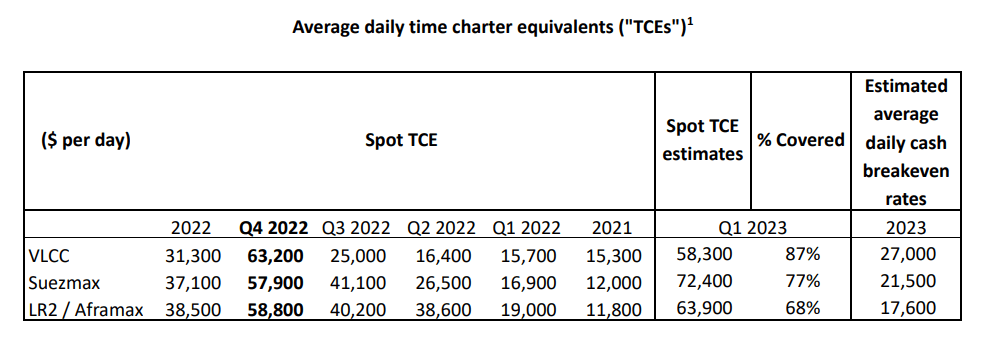
Figure 5 shows that FRO expects its VLCC spot TCE rate to be $58300 (for 87% covered days), compared with $15700 in 1Q 2022. However, it shows that FRO’s spot TCE rates in 1Q 2023 are estimated to be lower than in 4Q 2022. FRO estimates its Suezmax spot TCE rate in 1Q 2023 to be $72400 (for 77% covered days), which is significantly higher than in 1Q 2022 and 4Q 2022. Finally, FRO estimates its LR2/Aframax spot TCE rate in 1Q 2023 to be $63900 (for 68% covered days), which is higher than in 1Q 2022 and 4Q 2022. We can see that FRO’s estimated average daily cash break-even rates are significantly lower than its spot TCE estimates in the first quarter of 2023. As the tanker rates are improving, FRO’s spot TCE rates for the full-year 2023 may be higher than in 1Q 2023.
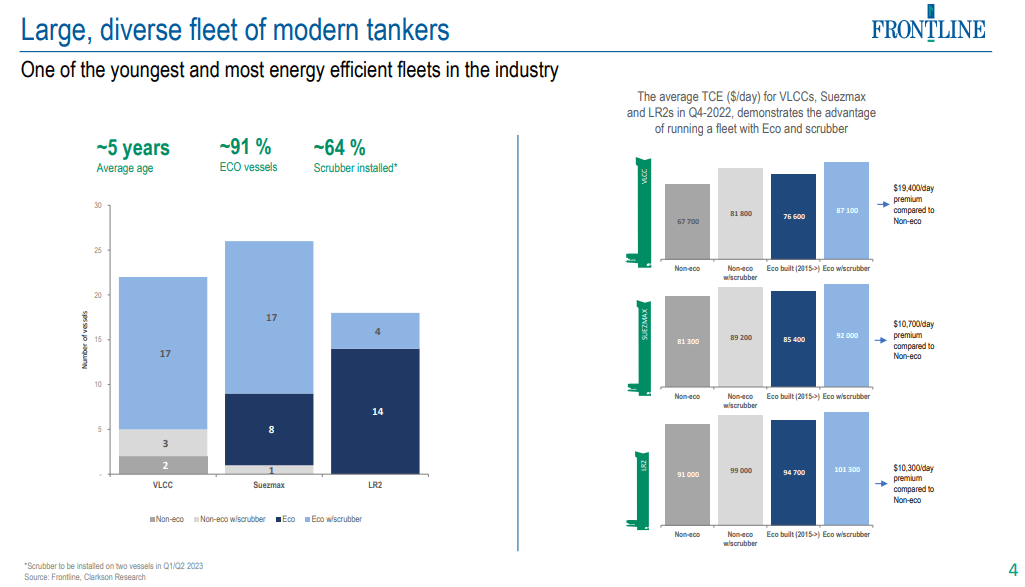
Frontline, has one of the youngest (5 years average) and most energy efficient (91% ECO vessels and 64% scrubber installed) fleets in the industry. In 4Q 2022, the advantage FRO’s ECO and scrubber installed tankers compared with its non-eco tankers for Frontline was a $19400/day premium for VLCCS, a $10700/day premium for Suezmax tankers, and a $10300/day premium for LR2 tankers (see Figure 6 ).
Figure 5 – Frontline’s average daily time charter equivalents
Figure 6 – FRO has a modern fleet
Scorpio Tankers' TCE rates
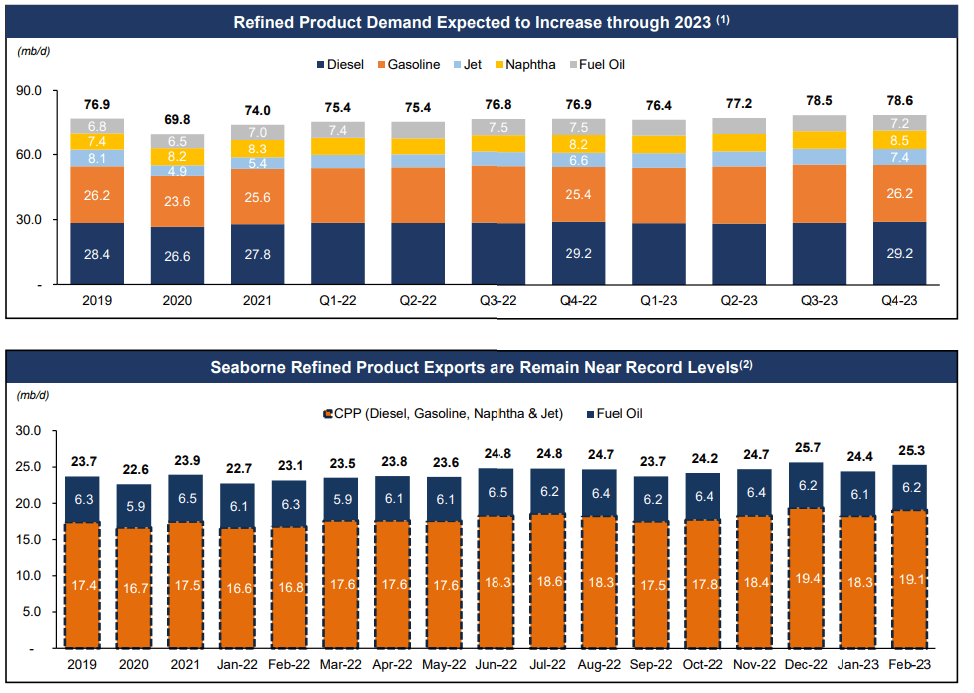
As of 23 March 2023, Scorpio’s fleet consisted of 113 vessels, including 39 LR2 tankers, 60 MR tankers, and 14 handymax tankers, with a weighted average age of 7.2 years. In 2022, STNG’s MR revenues accounted for 48% of its total pool and spot market revenue. Its LR tankers accounted for 36% of the company’s total pool and spot market revenue (98% LR2). Finally, Handymax revenues accounted for 16% of STNG’s total pool and spot market revenue. Thus, STNG’s revenues are highly exposed to the MR and LR2 rates. As a result of the war in Ukraine, Europe started importing products from other countries, and as the war is still continuing, the changed trade patterns still support the ton-mile demand. Figure 7 shows that refined product demand is expected to increase through 2023, especially in the second half, as global refined product demand continues to increase (driven by the reopening of China, improving jet fuel demand, and global low inventory levels). Higher demand for products, combined with higher ton-miles (due to the changed trade patterns), may cause TCE rates for MR and LR tankers to increase further.
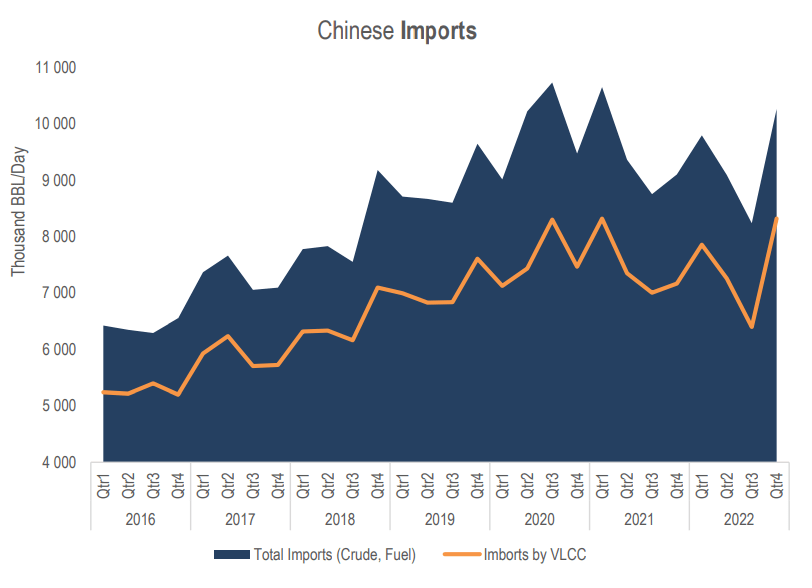
VLCC’s shipment to China is now at its all-time high. According to Figure 8, Chinese crude oil and fuel imports by VLCCs increased from about 6.5 million barrels per day in 3Q 2022 to about 8.5 million barrels per day in 4Q 2022 and are still increasing. We can see that China’s share of imports by VLCCs jumped in the last quarter of 2022. Driven by hiked U.S. exports, the world crude oil exports are back to the pre-pandemic level. Higher exports from the U.S. to Europe and China mean higher distances, higher demand for tankers, and higher ton-mile demand, that support TCE rates for VLCCs.
Figure 7 – Refined product demand and seaborne refined product export levels
Figure 8 – China’s crude oil and fuel imports
STNG and FRO performance
In the following section, I provided some leverage ratios as well as liquidity ratios to illustrate and compare the credit ratings of Scorpio and Frontline. Generally, one key way for investors to keep an eye on each company’s performance outlook is by considering their debt levels. High debt levels may lead to a lower ability to purchase new equipment or a lower ability to meet other obligations. Thus, I catered to some specific leverage ratios to assess the financial health of STNG and FRO compared to recent years.
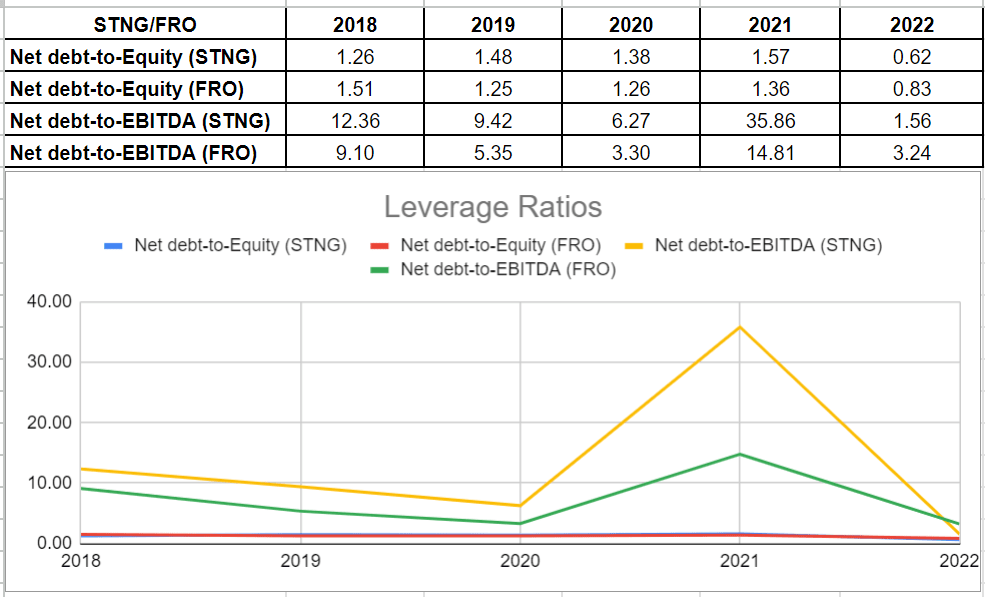
STNG’s net debt-to-equity or risk ratio measures the weight of total debt and financial liabilities compared with total shareholders’ equity. Generally, this ratio determines whether the company’s capital structure is toward debt or equity financing. As it is indicatable, after an increase to 1.57x in 2021 due to the COVID-19 pandemic from 1.38x in 2020, the risk ratio dropped back to 0.62x at the end of 2022. Also, Russia’s invasion of Ukraine caused a changing trade pattern for FRO. FRO’s risk ratio fell to its lowest level of 0.83x in 2022 compared with recent years.
Additionally, STNG’s net debt-to-EBITDA ratio during recent years determines the probability of defaulting on issued debt by determining how many years of EBITDA would be necessary for Scorpio Tankers to pay back its debt. It is observable that the company’s net debt-to-EBITDA dropped considerably in 2022. In minutiae, STNG's net debt lowered by 46% in 2022 compared with 2021 as well as its EBITDA level, which improved astonishingly to $996.6 million at the end of 2022 as compared to only $80 million in 2021. Thus, STNG’s net debt-to-EBITDA ratio dropped to 1.56x in 2022 versus its level of 35.8x in 2021. Similarly, Frontline’s ratio dropped by 78% to 3.24x in 2022 versus the previous year of 14.81x in 2021. It was for a 16% decline in net debt and an impressive improvement in the EBITDA level through 2022. When all was said and done, Scorpio Tankers had relatively lower leverage ratios in comparison with Frontline. Meanwhile, both companies proved how well they have financed their assets and business operations (see Figure 9).
Figure 9 – STNG and FRO’s leverage ratios
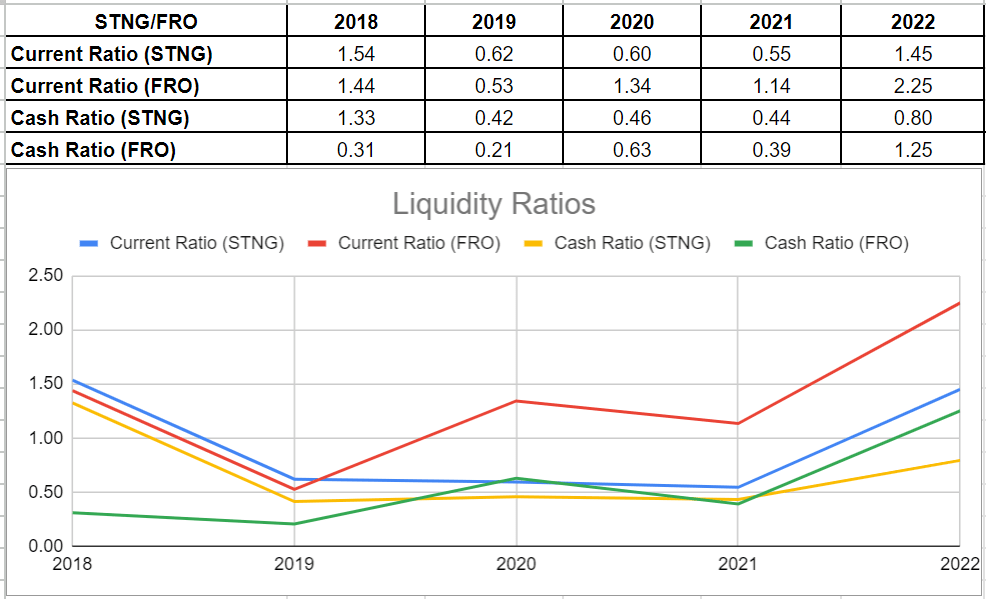
Furthermore, I analyzed Scorpio Tankers and Frontline’s performance outlooks across the board of liquidity ratios. Liquidity ratios are worthy for indicating a good picture of the companies’ capability to keep their balance between the ability to safely cover their obligations and improper capital allocations. In this regard, I investigated STNG and FRO’s current and cash ratios to be more accurate versus previous years.
As the liquidity ratios have assets on top and liabilities on the bottom, it is paramount to consider the ratios, whether their amount is above 1.0x to analyze if the company can face its obligations. It is observable that the liquidity conditions of both companies have improved impressively, and they will keep improving during 2023.
STNG’s current ratio increased to 1.45x in 2022 versus its previous amount of 0.55 at the end of 2021. Also, the current ratio of Frontline approximately doubled and reached 2.25x in 2022 compared with its level of 1.14x in 2021. Thankfully, the ratios depict their capability to meet their short-term obligations that are due within a year. Moreover, their cash ratios increased strongly during 2022. STNG’s cash ratio doubled to 0.8x versus 0.44x in 2021. In this case, FRO’s ratio increased more and sat at 1.25x in 2022 as compared to 0.39x at the end of 2021. Ultimately, their liquidity conditions indicate their ability to use their liquid assets to cover their current liabilities (see Figure 10).
Figure 10 – STNG and FRO’s liquidity ratios
Risks
Due to the high volatility in charter rates, historically, the tanker industry has been highly cyclical. After charter rates reached very high numbers in the summer of 2008, charter rates for crude oil and product tankers plunged, followed by the global financial crisis. To combat high inflation rates, the central banks of the United States and European countries increased interest rates. Inflation rates are decreasing. However, high interest rates may cause financial instability and limit the demand for crude oil and products. Also, with higher oil prices, the oil demand and the demand for VLCC tankers can be negatively affected. Lower demand for crude oil may decrease Scorpio’s VLCCs TCE revenues.
The changing trading patterns that can increase ton-mile demand may increase sea piracy. Moreover, changes in environmental regulation may limit the useful lives of takers. Both of the companies have done much to install scrubbers on their vessels so far. 64% of Frontline's fleet has a scrubber installed. Also, as of 23 March 2023, Scorpio Tankers has installed scrubbers on 85 vessels (75% of vessels). However, there are a significant number of vessels that do not have scrubbers. With more severe environmental regulations, the cash flow generation ability of both companies may get hurt. The companies may not be able to realize all of the anticipated benefits of their investment in scrubbers, due to the change in the laws and regulations about the discharge and disposal of wash water, and also the availability f low-sulfur fuel oil in the future. Moreover, the average age of Scorpio’s vessels is higher than Frontline. Scorpio operates secondhand vessels. Thus, it is exposed to increasing operating costs and a lower ability to obtain profitable charters.
Summary
In terms of financial performance, Scorpio Tankers and Frontline reported strong financial results in 2022. The liquidity and leverage ratios of STNG and FRO improved in the past quarters. Also, both of them generated high cash flows. Moreover, the ton-mile demand is increasing. Thus, TCE rates can increase further in 2H 2023 and 2024. STNG and FRO are opportunistic.
For further details see:
Scorpio Tankers And Frontline: 2 Big Tanker Stocks To Buy