SDEM - SDEM: 5 Reasons To Snub An 8.5% Yield
Summary
- SDEM is a high yield ETF in emerging markets.
- Low and decreasing AUM may threaten its existence.
- Half of asset value is directly exposed to risks related to China.
- It is massively overweight in one sector.
- Since 2015, the share price has lost 46% and distributions have been flattish.
This dividend ETF article series aims at evaluating products regarding the relative past performance of their strategies and quality of their current portfolios. As holdings and their weights change over time, reviews may be updated when necessary.
SDEM strategy and portfolio
The Global X MSCI SuperDividend Emerging Markets ETF ( SDEM ) has been tracking the MSCI Emerging Markets Top 50 Dividend Index since 03/16/2015. As of writing, it has 55 holdings, a 12-month trailing yield of 8.51% and a total expense ratio of 0.67%.
The net asset value (about $45 million) and the average trading volume (about 14k shares/day) are low for an ETF, and both are down since the last review in August. This may be a concern for the fund’s survival on the long term and for trading slippage on the short term (using limit orders is absolutely necessary).
As described by MSCI , the underlying index “ includes large and mid-cap stocks across 27 Emerging Markets countries. The index aims to reflect the performance of 50 securities from the MSCI EM Index, selected by dividend yield that have increased or maintained their dividend per share compared to the previous year or have increased or maintained their payout ratio (defined as dividend per share/earnings per share) if the dividend per share has dropped by up to 10%” .
Constituents are in equal weight at every index reconstitution.
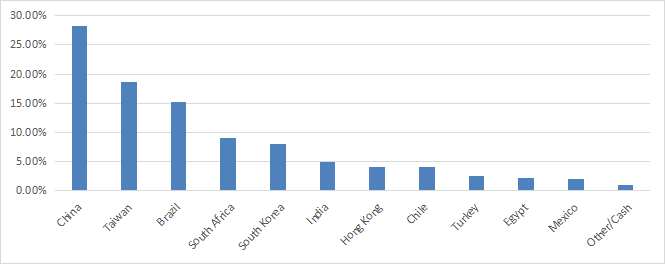
The fund is mostly invested in large cap companies (about 63% of asset value). China is by far the heaviest country with 28.2%, followed by Taiwan (18.6%) and Brazil (15.5%). Other countries are below 10%. In November 2021 , Russia was number two with a weight over 13% of asset value. The fund had to drop Russian assets with heavy losses because of regulation relative to war in Ukraine. The fund’s exposure to geopolitical risks is still extremely high: the aggregate weight of China, Taiwan and Hong-Kong is 50.9%.
SDEM countries (chart: author with GlobalX data.)
The heaviest sector is materials by far (37.7%), then come financials (16.4%) and energy (14.9%). Other sectors are below 11%.
SDEM sector breakdown (chart: author with GlobalX data.)
The top 10 holdings, listed below, represent 23.8% of the portfolio value. Constituents are in equal weight every time the underlying index is reconstituted, but price variation may result in weight slippage. The top holding weighs 2.44% as of writing.
| Ticker |
| Name |
| % of Net Assets |
| 1171 HK |
| YANKUANG ENRGY-H |
| 2.44 |
| COAL IN |
| COAL INDIA LTD |
| 2.42 |
| CMPC CI |
| EMPRESAS CMPC SA |
| 2.42 |
| GGBR4 BZ |
| GERDAU SA |
| 2.4 |
| 960 HK |
| LONGFOR GROUP HO |
| 2.38 |
| VALE3 BZ |
| VALE SA |
| 2.36 |
| ARI SJ |
| AFRICAN RAINBOW |
| 2.36 |
| 1336 HK |
| NEW CHINA LIFE-H |
| 2.35 |
| 386 HK |
| SINOPEC CORP-H |
| 2.32 |
| 148 HK |
| KINGBOARD HOLDINGS LTD |
| 2.31 |
Past performance compared to competitors
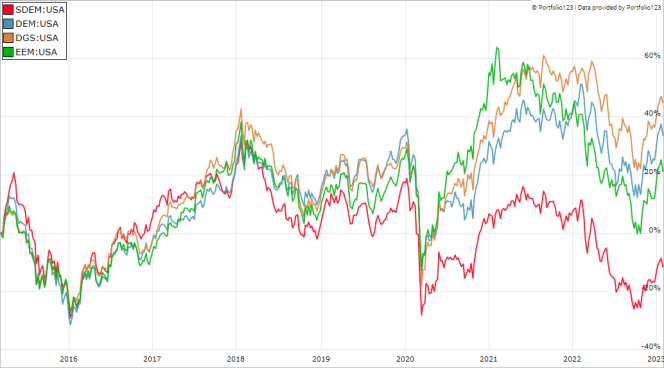
The next chart compares SDEM total return since inception with the iShares MSCI Emerging Markets ( EEM ), the WisdomTree Emerging Markets High Dividend Fund ( DEM ), reviewed here , and the WisdomTree Emerging Markets SmallCap Dividend Fund ( DGS ), reviewed here . SDEM has lagged all of them by a wide margin. It is the only one in loss in this list for this time interval, and it is the most volatile.
SDEM vs. 3 Emerging Market ETFs since inception (Portfolio123)
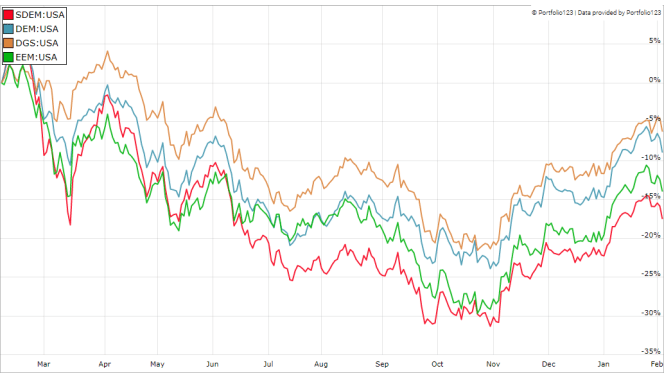
It is also the worst performer in the last 12 months:
SDEM vs. 3 Emerging Market ETFs, last 12 months (Portfolio123)
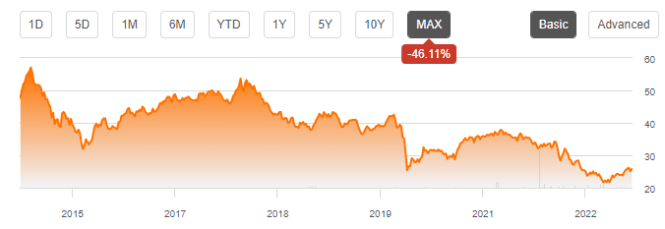
In fact, SDEM has suffered a capital decay of 46% since inception, as shown on the share price chart on Seeking Alpha:
SDEM share price (TradingView on Seeking Alpha)
SDEM looks bad also from a dividend growth point of view: the sum of annual distributions per share is close to flat since inception: $2.26 in 2015, $2.11 in 2022. In the same period, the cumulative inflation has been about 25%.
Takeaway
SDEM is invested in 50 high-yield companies listed in emerging markets. Its equal-weight policy looks a good idea, but it has 5 red flags. First, low and decreasing AUM may threaten its existence. Second, half of asset value is directly exposed to geopolitical and regulatory risks related to China. Third, it is massively overweight in one sector: materials. Fourth, the share price has lost 46% since inception and distributions are a bit down, while cumulative inflation has been 25%. Fifth, it has lagged more popular emerging market ETFs since inception, and also recently. SDEM may be lifted by the bullish trend in emerging markets in the short and mid term, but another emerging market fund would probably be a better choice. For transparency, a dividend-oriented part of my equity investments is split between a passive ETF allocation and my actively managed Stability portfolio (14 stocks), disclosed and updated in Quantitative Risk & Value.
For further details see:
SDEM: 5 Reasons To Snub An 8.5% Yield