XYLD - SDIV: 15%-Yielding Dividend Trap
2023-06-13 12:24:30 ET
Summary
- Global X SuperDividend ETF invests in the top 100 highest dividend-paying equities worldwide. The ETF has a trailing 12-month distribution of almost 15%, making it appealing to income-oriented investors.
- However, the high dividends are at the cost of other objectives such as risk management and total return.
- Political risk, high turnover, high management fees, a premium to NAV, and lack of upside participation dampen the initial appeal of the ETF.
- XYLD, a covered call ETF also offered by Global X, offers a far better risk/return profile while still providing a high yield of ~8%.
Thesis
The concept of 'yield chasing' is an incredibly risky strategy that is exemplified by Global X SuperDividend ETF (SDIV). Chasing yield at all costs involves forgoing other objectives such as capital appreciation and risk management which is precisely why it makes the ETF so risky. Investors should therefore firstly define their own objectives and then see if it truly aligns with that of the ETF. More often than not, for long term investors, it just doesn't foot the bill and can cost much more than it can give. If you are looking to maximize yield, I would look elsewhere towards covered call ETFs that offer diversification, capital preservation, and high income, rather than SDIV's destructive rules based approach of yield chasing.
ETF Overview
Global X SuperDividend ETF invests in the highest 100 dividend paying equities in the world. With a trailing 12-month distribution of nearly 15%, it's not difficult to see the appeal of the ETF to income oriented investors.
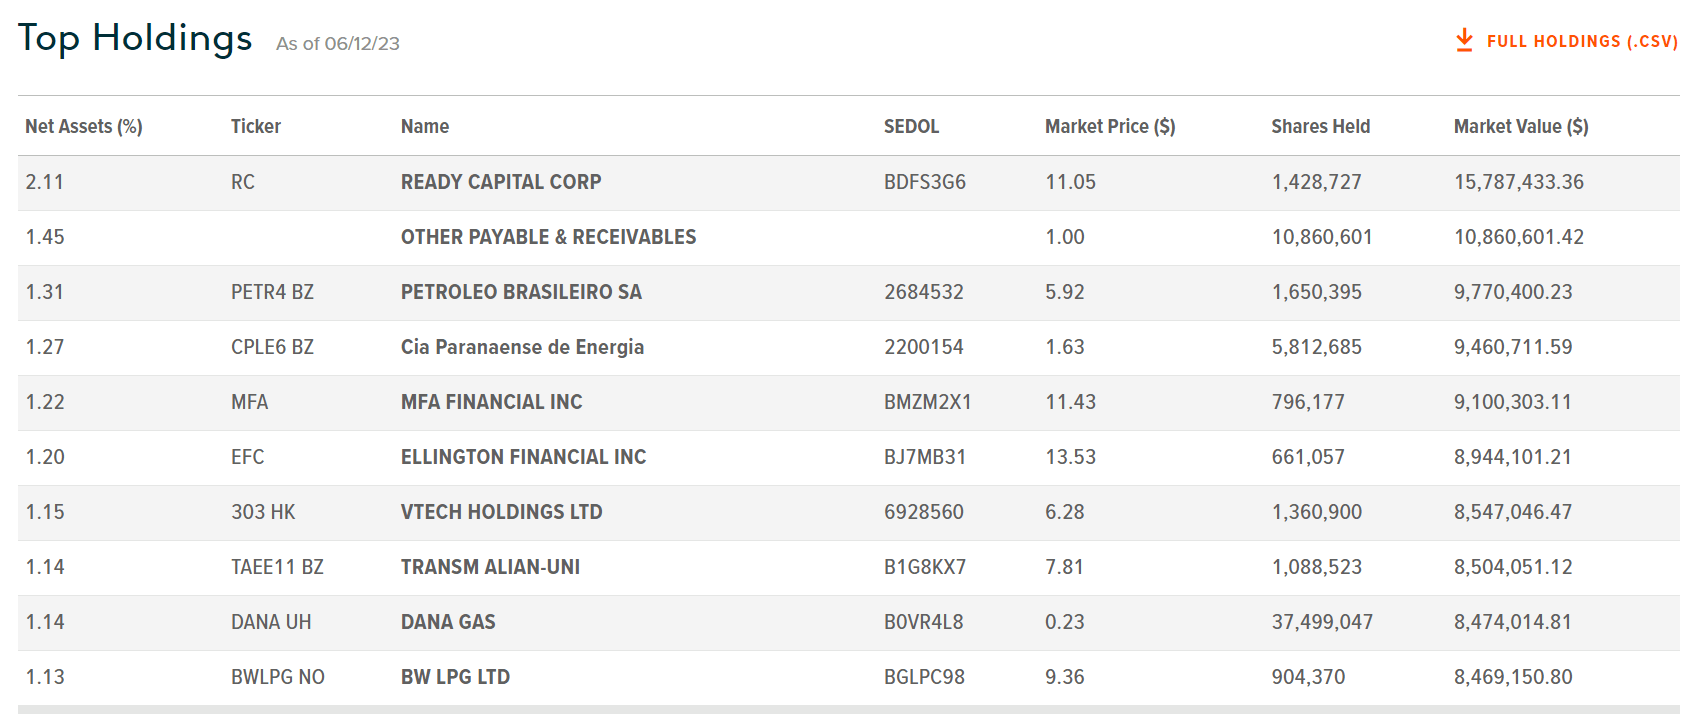
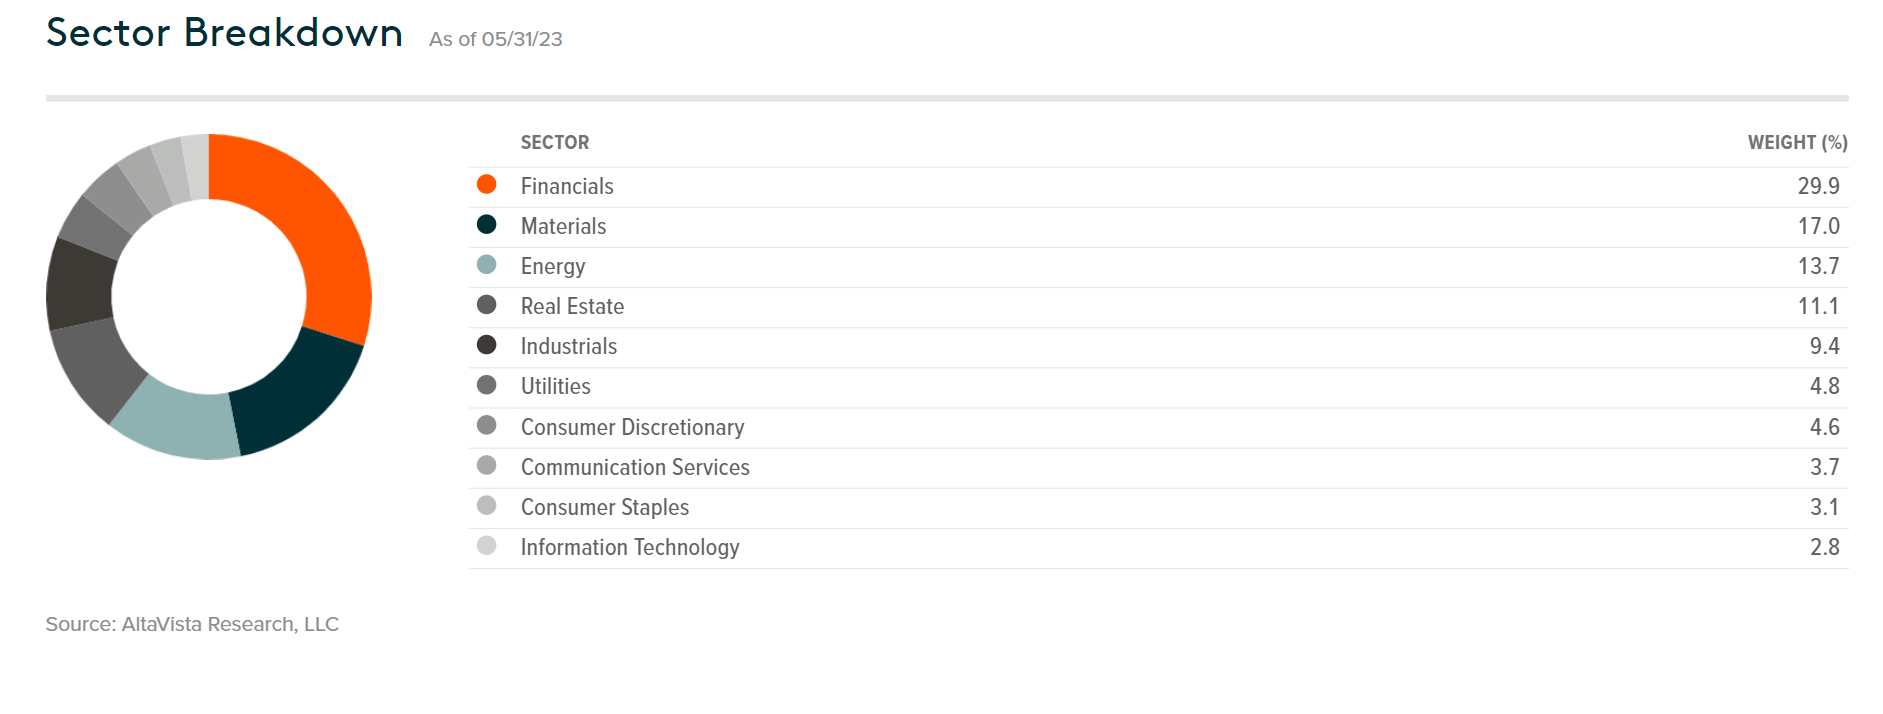
Due to this rules based approach, SDIV is essentially screening a universe of thousands of stocks and selecting only the upper most strata for dividend yield. As can be expected, the top 100 stocks by dividend yield are typically turning over fast and the ETF rebalances quarterly with a turnover rate above 90%! as holdings are constantly changing but generally diversified both geographically and by sector. See the ETF's positioning and risk statistics below:
Performance: Designed to Avoid Capital Appreciation
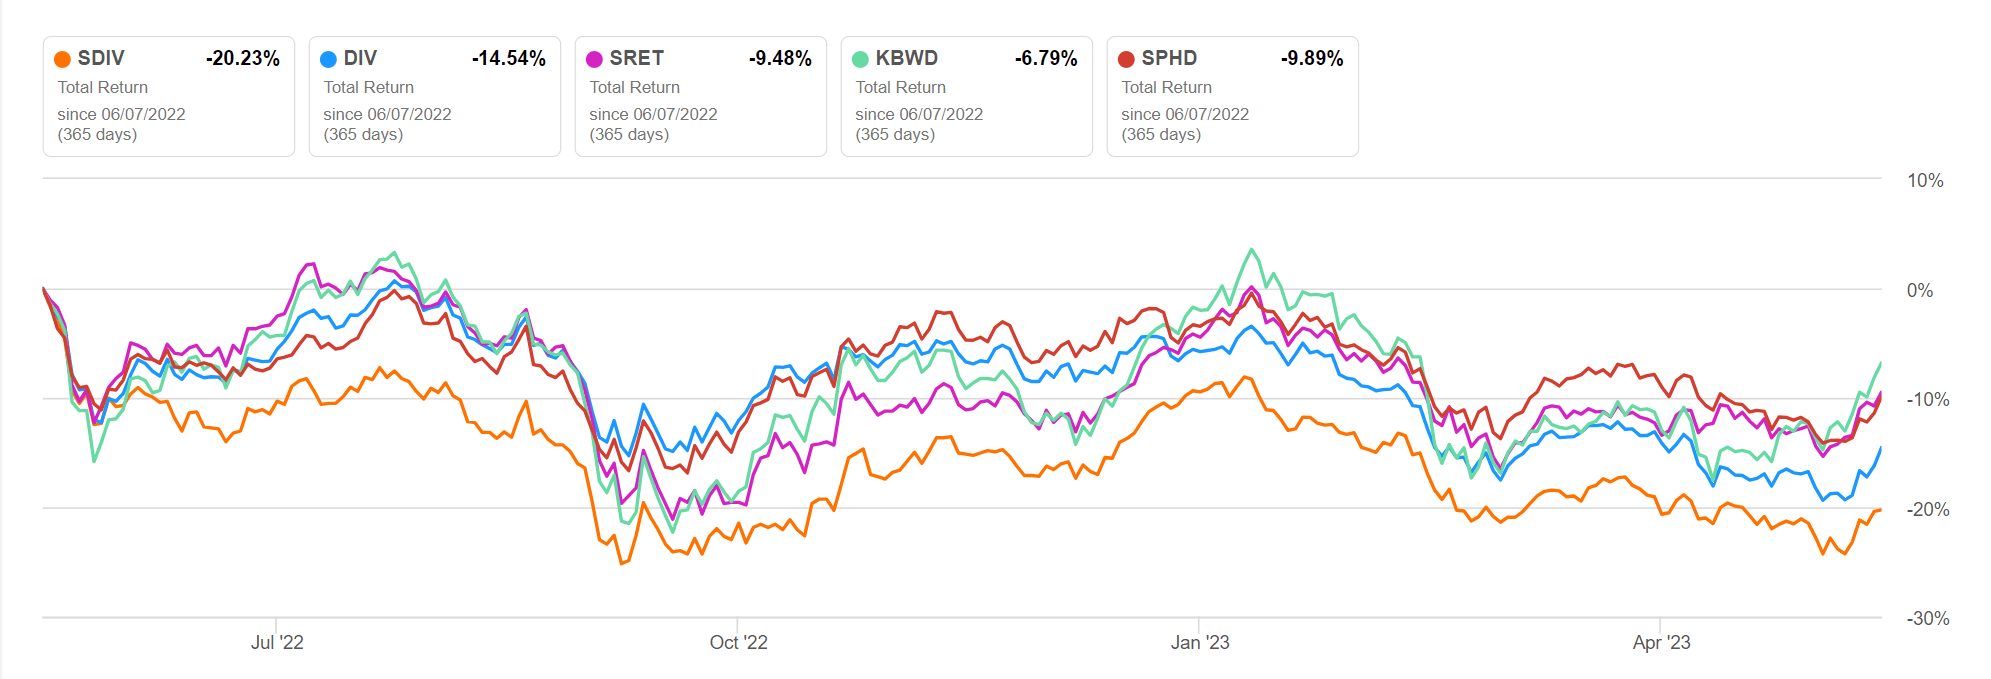
Year to date, SDIV is down 3% despite the broader market being up 18%. Even when compared to its other high dividend paying ETF counterparts, SDIV has lagged significantly.
Why is this? By focusing solely on the highest 100 dividend yielding companies, SDIV, I believe, takes an outsized risk profile when compared to its counterparts due to the simple fact that high dividend yields are often not the result of genuinely strong dividends, but crashing prices.
For example, 31% of SDIV's sector concentration is in the volatile and highly cyclical commodities sectors which are materials and energy. Hypothetically, let's suppose that we see a cyclical upswing in such commodities just as we saw in the Summer of 2022. The result for SDIV is that these holdings would appreciate, but their yield would go down because price is rising. As such, SDIV would abandon them at the next rebalancing period because they no longer categorize in the top 100 dividend yielding global equities. As you might imagine, this is an anti-momentum strategy and therefore, severely vulnerable to severely underperforming in a bull market and prone to investing in stocks with little to no momentum. This leads to capital decay as the anti-momentum tends to destroy capital over long periods of time.
To get a sense of how bad the capital decay (excluding dividends) has been with SDIV we can view a price return graph of the ETF since inception - losing 70% of investor initial capital. This sort of decay can fool investors who see a rising yield as akin to rising income. See below:
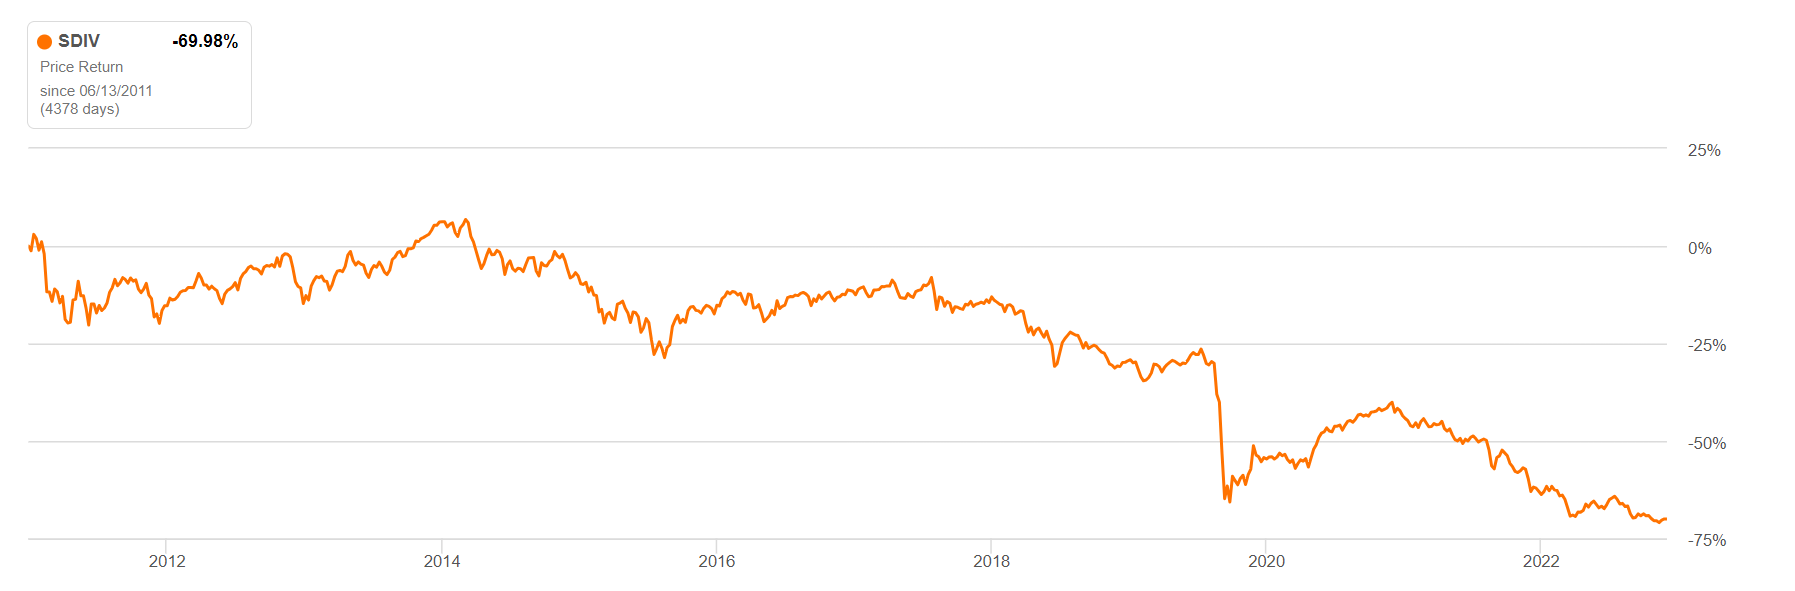
Dividend Decay
Income investors should know that SDIV maximizes yield, not absolute income or yield on cost. Due to SDIV's design of naturally avoiding higher priced companies, the ETF invests in stocks which may be high yielding only because prices are low and subsequently abandons the stock when any sort of recovery is made. This lack of upside participation should we see a recovery story can not only decay capital, but also dividends, as such companies are often poised to soon give a dividend cut which artificially boosts its perception as a strong dividend payer using short term dividend yields.
For example, while the 12-month yield is 14.85% as of June 8, 2023, the distribution yield drops to 11.85%. This differential is quite significant and signifies two things occurring. Firstly it is indicative of dividends declining over time, and secondly, it suggests that capital is depreciating as the 12-month yield assumes dividends of the past year are over current NAV, and not the higher historical NAV.
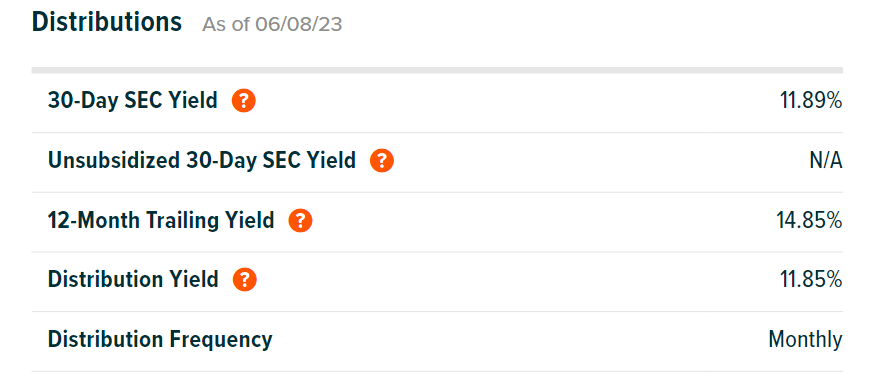
Based on historic dividend growth rates, over the past 3 and 5 years SDIV has reduced payments by a cumulative 19% and 31% respectively.
| Dividend Growth 3 Yr ((CAGR)) |
| -6.71% |
| Dividend Growth 5 Yr ((CAGR)) |
| -7.06% |
What should actually matter for investors is therefore not dividend yield, but yield on cost, which measures dividend income over their cost basis. When looking at this metric, we can see just exactly how SDIV fails to provide substantial income over an investment in the longer term.
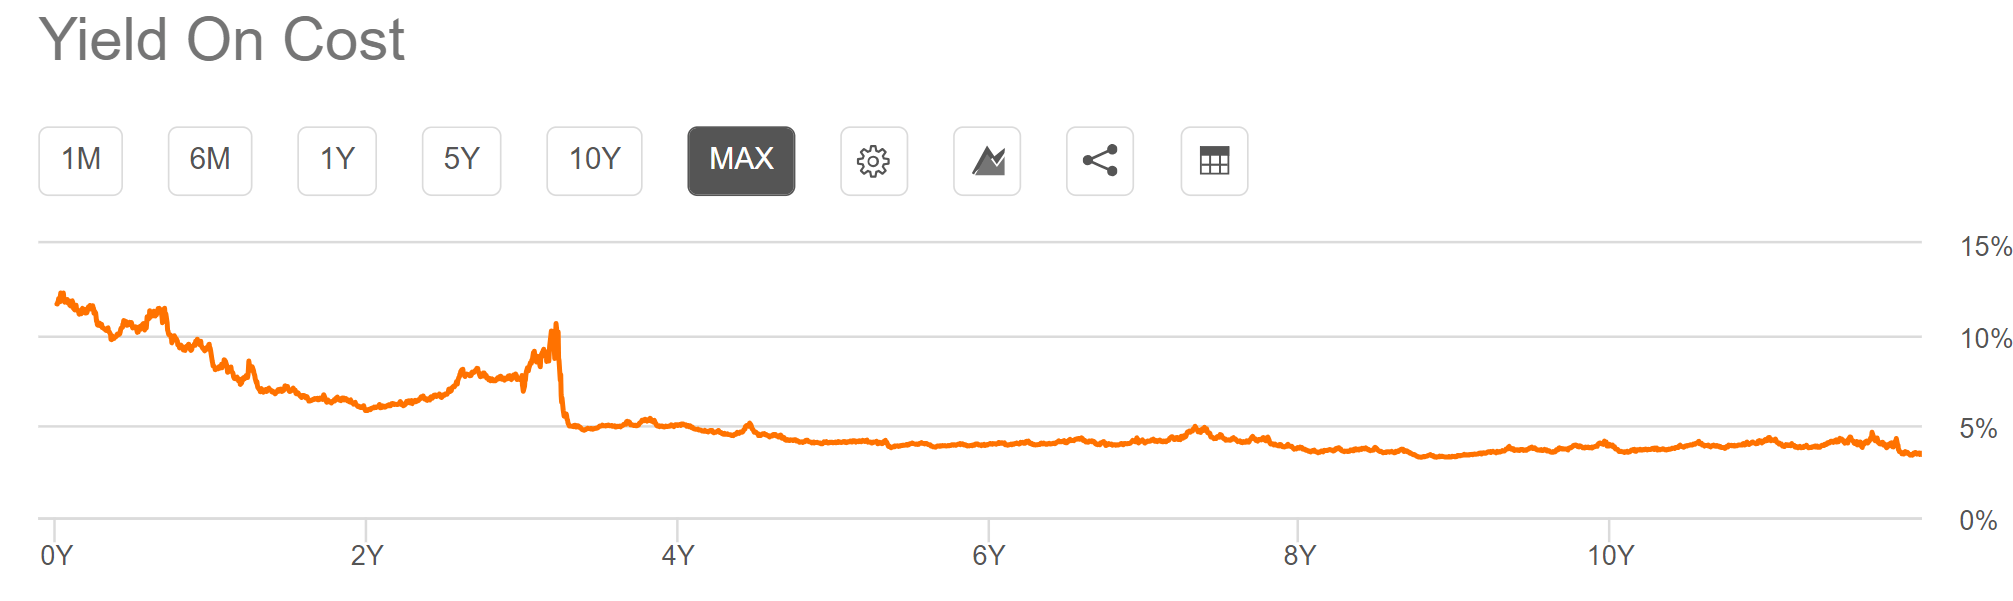
Overexposed to Political Risk
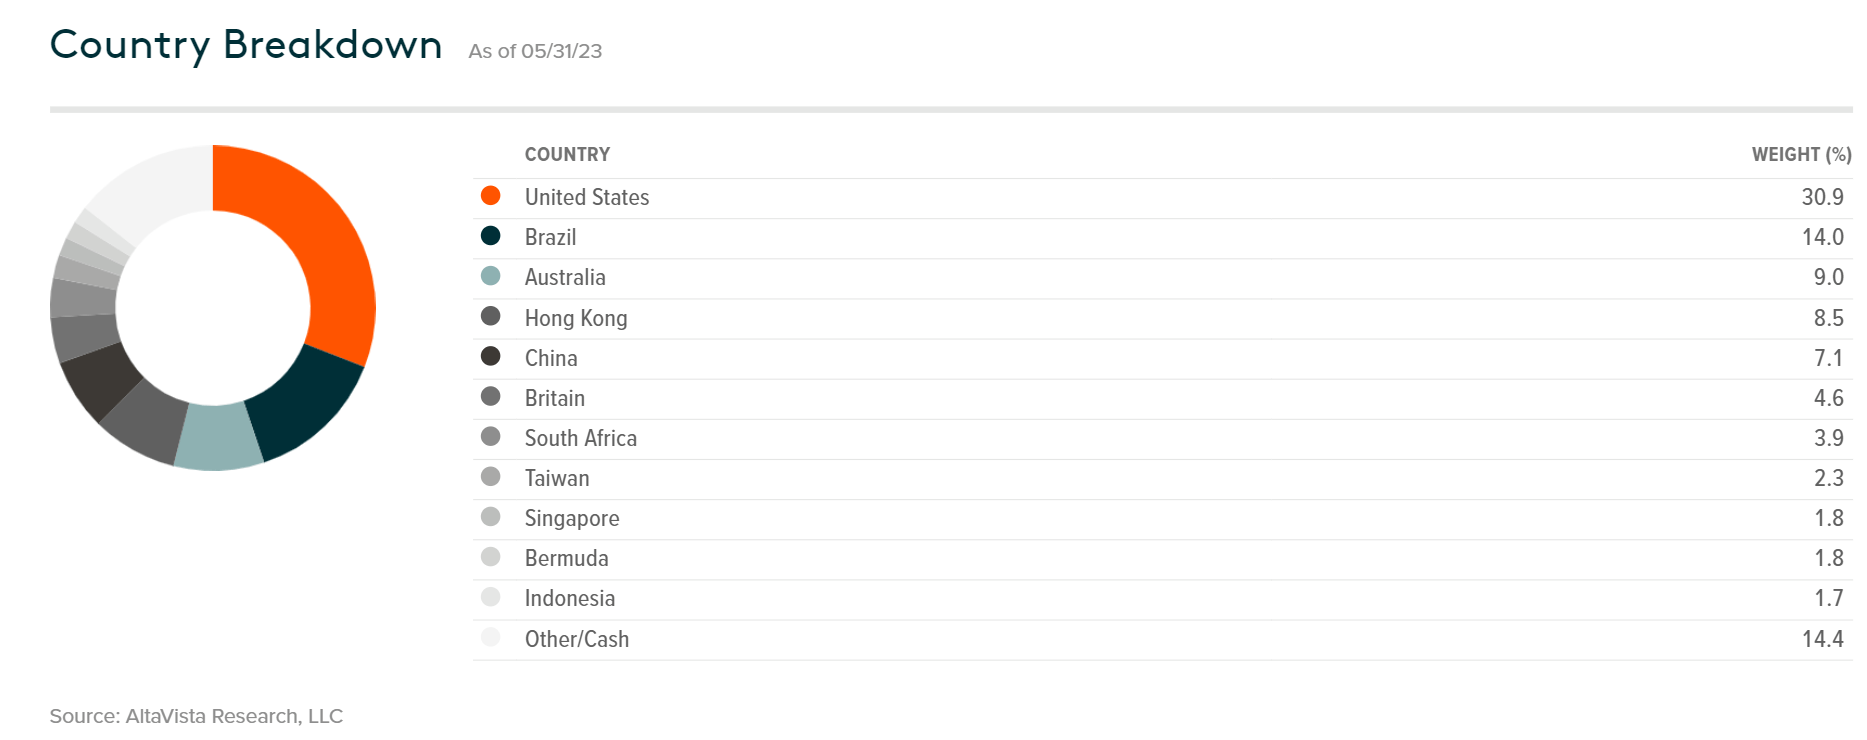
Let's turn to the geography of SDIV's holdings. Of the entire portfolio, ~32% of it comes from geographies that I would consider of material political risk. The breakdown is as follows:
- 14.1% Brazil
- 8.5% Hong Kong
- 7.1% China
- 2.3% Taiwan
The Brazilian MSCI Index (EWZ) for example has a very high dividend yield of 9%. The catch? Most of this comes from oil and gas which 1) Is highly cyclical, and 2) is not poised to be treated well by the recently elected ultra-left wing President of Brazil Luiz Lula. Looking at Brazilian energy news we see a wave of anti-oil & gas decrees; ' regulators block oil & gas drilling ', ' new taxes ', and ' left wing management changes '. Petrobras Brasilia SA for example is SDIV's second largest holding, has been experiencing exploration blocks from regulators over the past year and has been deemed risky due to the volatility in the Brazilian Real.
In China, Taiwan, and Hong Kong, SDIV has holdings in the industrial, financial, and tech sectors. These in particular may be especially vulnerable due to US legislation such as the CHIPS act, anti-Chinese rhetoric, an escalation in China-Taiwan tensions, and a variety of other unforeseen consequences that could jeopardize the equity markets of these regions.
So, while many of SDIV's holdings are solid companies; Rio Tinto, BHP, Flex LNG, and many others - it is important to note that much of the yield is juiced up by riskier foreign investments.
High Fees and NAV Premium
With a gross expense ratio of 0.68%, there is further evidence that SDIV may not be a suitable long term hold. In addition to this, most of the time, SDIV trades at a premium to NAV.
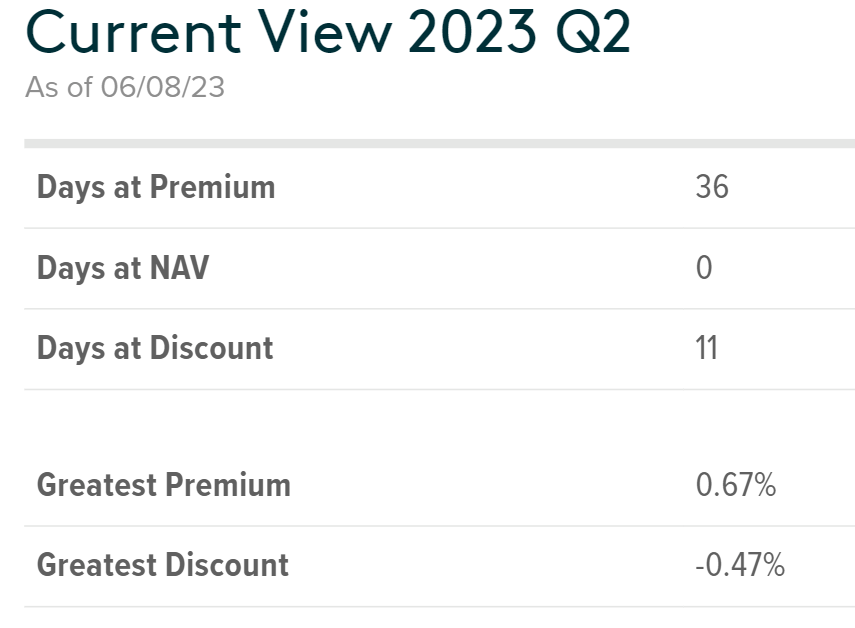
With that said, however, there may be a benefit to swing trading the ETF when it trades at a discount to NAV. For example, despite falling in price by 4.17% quarter to date, if you bought at any of the day's trading at a discount you would still be above water or at least broken even as of now.
Better High Dividend Alternatives
When looking to maximize income on an equity portfolio, it may be worthwhile to consider covered call ETFs which can offer diversification and a better risk/return profile.
Global X S&P 500 Covered Call ETF (XYLD) offers a 8.38% distribution yield paid monthly. For those who may be unaware, covered call strategies are option driven to boost income. By selling calls on owned shares, one forgoes potential upside in exchange for immediate income. The income is guaranteed and the upside is only forgone if the underlying security surpasses the strike price.
XYLD has paid dividends consistently for over 9 years and since 2013 has outperformed SDIV by a significant 120%.
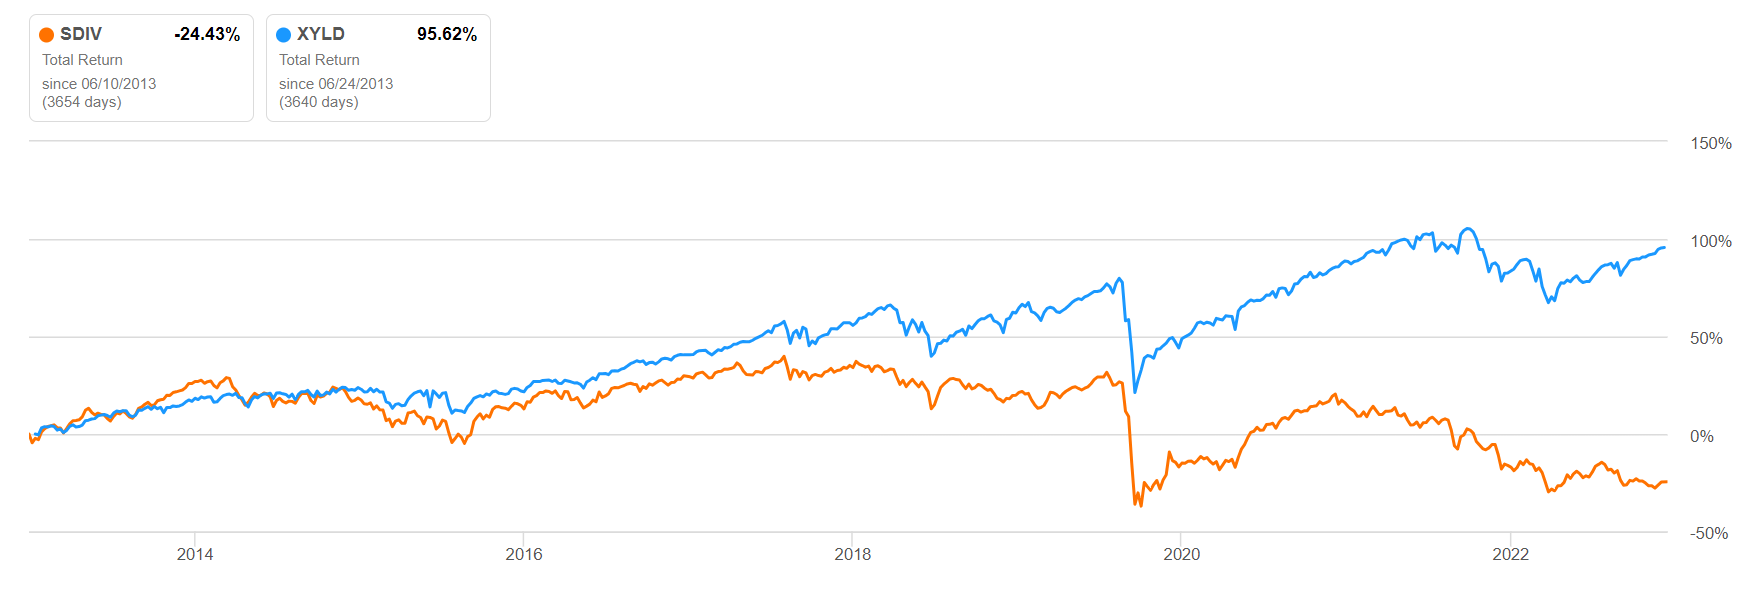
Unlike SDIV, XYLD has actually stable to growing dividends. For example, in the past 5 years, XYLD has a compounded annual dividend growth rate of 8.6%! Far better than the dividend destruction of SDIV which in the same period saw a dividend CAGR of -7.06%.
The ETF objective of XYLD, as stated on their investor page is as follows:
"The Global X S&P 500 Covered Call ETF seeks to provide investment results that correspond generally to the price and yield performance, before fees and expenses, of the Cboe S&P 500 BuyWrite Index."
The Cboe S&P 500 BuyWrite Index writes (sells) near term, near the money, call options on the underlying holdings of the S&P 500 index. The result is by selling 1 month call options with a strike price slightly above the current price, there is room for a small amount of capital appreciation and a high degree of income as the options are sold monthly and near the money. This repeatable strategy generates strong income for investors and has been proven to offer lower volatility and outperformance in periods of bear markets . During a bull market however, the index tends to underperform due to lack in major upside participation.
Conclusion: Mice Die in Mousetraps Because They Do Not Understand Why the Cheese is Free
Don't be immediately fooled by the mouthwatering 15% yield offered by SDIV. Better alternatives exist such as the aforementioned XYLD also offered by Global X. Long term holders of the SDIV ETF have been burnt and badly so. Instead, if you are an investor with a risk tolerance and appetite that ranges from political to financial, then SDIV may be appropriate for short term swing trading. Nonetheless, if one were to purchase SDIV, be wary of both the fees and pricing relative to NAV, as you may be better off just purchasing the underlying holdings instead and tailoring a high dividend portfolio to your needs rather than paying Global X.
For further details see:
SDIV: 15%-Yielding Dividend Trap