VT - SDIV: A High Yield Mirage
2023-06-12 06:47:20 ET
Summary
- Global X SuperDividend ETF holds about 100 high-yield stocks from developed and emerging markets.
- It invests heavily in the U.S. and in financials, especially mortgage REITs.
- The yield and valuation look extremely attractive.
- Nonetheless, its historical performance is scary.
This article series aims at evaluating ETFs (exchange-traded funds) regarding past performance and portfolio metrics. Reviews with updated data are posted when necessary.
SDIV strategy and portfolio
Global X SuperDividend ETF ( SDIV ) started investing operations on 06/08/2011 and tracks the Solactive Global SuperDividend Index. It has 129 holdings, a distribution yield of 11.82% and a net expense ratio of 0.58%. Distributions are paid monthly.
As described in the prospectus by GlobalX ETFs , " the Underlying Index tracks the performance of 100 equally-weighted companies that rank among the highest dividend yielding equity securities in the world ".
The portfolio's turnover rate in the most recent fiscal year is 91%, which is quite high for a dividend ETF. The portfolio is well-balanced across all size segments, with a tilt to small caps.
Size segment breakdown (Chart: author; data: Fidelity)
The heaviest country is by far the U.S. with 30.9% of asset value. Brazil comes in second position with 14%, and other countries are below 10%. China, Hong-Kong and Taiwan weigh 17.9% together, which is a significant exposure to geopolitical and regulatory risks. The next chart lists the top 11 countries, representing 85.6% of assets.
SDIV top countries, weights in % (Chart: author, data: GlobalX)
The fund is overweight in financials, with 29.9% of assets in this sector. More specifically, it is heavy in mortgage REITs (over 20%). Then, come materials (17%), energy (13.7%) and real estate (11.1%). Other sectors are at 28.4% in aggregate and below 10% individually.
SDIV sector breakdown (Chart: author, data: GlobalX)
Featuring a price-to-earnings ratio of 6.92 and price-to-book ratio of 0.72, SDIV looks very cheap. Nonetheless, metrics are heavily biased by the sector breakdown. The usual valuation and profitability ratios are quite irrelevant in financials and real estate, which means over 40% of asset value cannot be assessed with these metrics.
The top 10 holdings listed below represent 12.8% of assets. They include four mortgage REITs ( RC , MFA , EFC , ABR ).
| Ticker |
| Name |
| Weight% |
| READY CAPITAL CORP |
| 2.09 |
| PETR4 BZ |
| PETROLEO BRASILEIRO SA |
| 1.38 |
| CPLE6 BZ |
| Cia Paranaense de Energia |
| 1.28 |
| MFA FINANCIAL INC |
| 1.2 |
| ELLINGTON FINANCIAL INC |
| 1.17 |
| 363 HK |
| SHANG INDUS HLDG |
| 1.14 |
| TAEE11 BZ |
| TRANSM ALIAN-UNI |
| 1.14 |
| 6818 HK |
| CEB BANK-H |
| 1.13 |
| DANA UH |
| DANA GAS |
| 1.13 |
| ARBOR REALTY TRUST INC |
| 1.13 |
Past performance
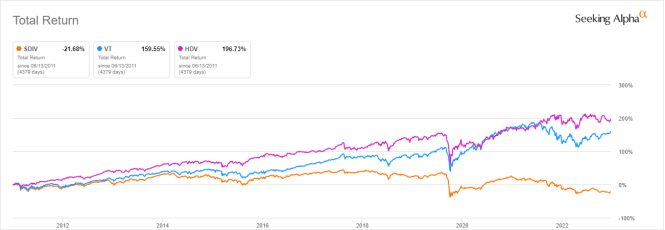
The next chart compares the total return of SDIV since inception with a total world market benchmark: the FTSE Global All Cap Index, represented by Vanguard Total World Stock ETF ( VT ). It also includes a U.S. high dividend benchmark: iShares Core High Dividend ETF ( HDV ).
SDIV vs. VT, HDV, total return since 6/13/2011 (Seeking Alpha)
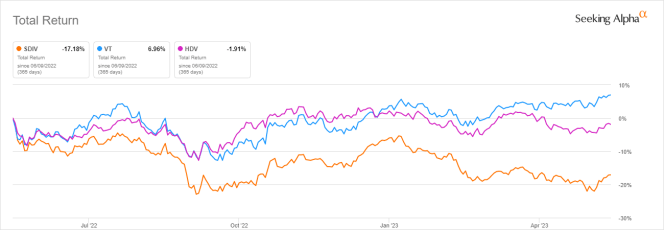
SDIV is in loss since its inception (including dividends) and it has underperformed both benchmarks by a wide margin. It has also been lagging in the last 12 months:
SDIV vs. VT, HDV, total return since 6/13/2011 (Seeking Alpha)
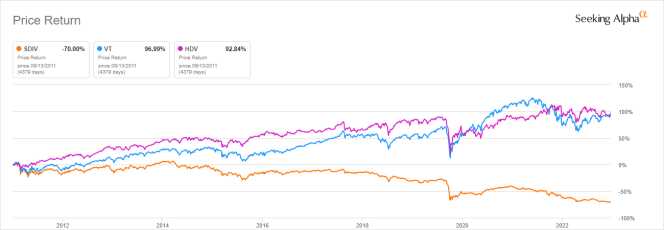
The share price chart below is even more concerning. It shows SDIV has suffered a capital decay of 70 % in 12 years.
SDIV vs. VT, HDV, price return since 6/13/2011 ( Seeking Alpha)
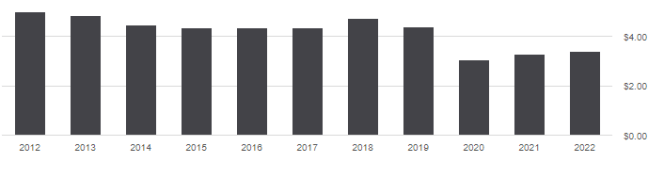
The sum of annual distributions is also sharply down: from $5.02 per share in 2012 to $3.41 in 2022. It is a reduction of 32% in income stream for shareholders. To make it worse, the cumulative inflation has been about 29% in the same time, based on CPI.
SDIV distribution history (Seeking Alpha)
Takeaway
Global X SuperDividend ETF holds about 100 high yield stocks from developed and emerging markets. It invests heavily in the U.S. and in financials, especially mortgage REITs. Moreover, about 18% of asset value is directly exposed to risks related to China. Distributions and valuation look extremely attractive, but it is a high-yield mirage. The fund has lost 70% in share price and over 30% in distribution since inception, while the cumulative inflation has been close to 30%. SDIV may be used as an instrument for swing trading or tactical allocation, but history is a warning against buying it for the long term, for instance in a retirement portfolio. The issue is not specific to SDIV - most funds with yields above 6% suffer from decaying value and distributions.
For further details see:
SDIV: A High Yield Mirage