TBC - SDOG: 50 Dogs In Portfolio Many Are Not The Best Of Breed
2023-10-12 16:03:48 ET
Summary
- ALPS Sector Dividend Dogs ETF applies the "Dogs of the Dow Theory" in the S&P 500, sector-by-sector.
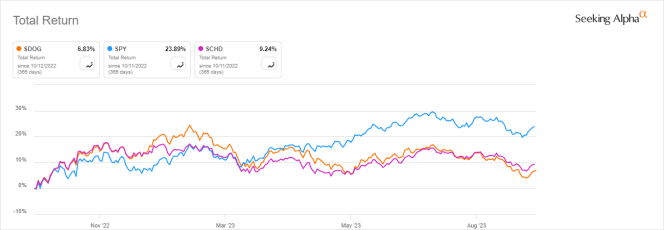
- SDOG has underperformed the benchmark SPY and Schwab U.S. Dividend Equity ETF since inception and in the last 12 months.
- Valuation looks great, but aggregate quality and growth metrics are underwhelming.
This article series aims at evaluating ETFs (exchange-traded funds) regarding past performance and portfolio metrics. Reviews with updated data are posted when necessary.
SDOG strategy and portfolio
ALPS Sector Dividend Dogs ETF ( SDOG ) was listed on 06/29/2012 and tracks the S-Network Sector Dividend Dogs Index. It has 50 holdings, an indicated yield of 4.66%, and a total expense ratio of 0.36%. Distributions are paid quarterly.
As described by ALPS , the fund " applies the 'Dogs of the Dow Theory' on a sector-by-sector basis using the S&P 500 Index as its starting universe of eligible securities. SDOG provides high dividend exposure across 10 sectors of the market by selecting the five highest yielding securities in each sector and equally weighting them ". The GICS classification has 11 sectors, but real estate is excluded from the universe.
SDOG is mostly invested in US companies (about 96% of asset value), 34% in large caps, and 56% in mid-caps. The fund is equal weighted in constituents and in GICS sectors (except real estate). All positions are set in equal weight on rebalancing dates, but they may drift with price action. The heaviest sector now is consumer staples (10.22%) and the lightest one is consumer discretionary (9%). The next chart compares the sector breakdown with the S&P 500 ( SPY ).
Sector breakdown (Chart: author; data: ALPS Funds and SSGA)
The top 10 holdings, listed below, represent 21.4% of asset value. These are the components with the highest price return since the last rebalancing. All weights are between 1.5% and 2.2%, so risks related to individual companies are low.
| Ticker |
| Name |
| Weight |
| EPS growth % TTM |
| P/E TTM |
| P/E fwd |
| Yield % |
| Seagate Technology Holdings plc |
| 2.22% |
| -134.88 |
| N/A |
| 110.87 |
| 4.03 |
| ONEOK, Inc. |
| 2.17% |
| 54.14 |
| 12.45 |
| 11.81 |
| 5.66 |
| Fastenal Co. |
| 2.14% |
| 9.73 |
| 28.58 |
| 28.20 |
| 2.50 |
| AT&T, Inc. |
| 2.14% |
| -148.13 |
| N/A |
| 6.08 |
| 7.52 |
| Walgreens Boots Alliance, Inc. |
| 2.14% |
| -161.87 |
| N/A |
| 5.65 |
| 8.50 |
| The Williams Cos., Inc. |
| 2.14% |
| 68.98 |
| 16.00 |
| 18.11 |
| 5.16 |
| Citigroup, Inc. |
| 2.13% |
| -19.42 |
| 6.59 |
| 7.22 |
| 5.10 |
| International Paper Co. |
| 2.13% |
| -11.94 |
| 8.34 |
| 16.68 |
| 5.22 |
| Gilead Sciences, Inc. |
| 2.11% |
| 32.57 |
| 17.70 |
| 11.66 |
| 3.90 |
| Newmont Corp. |
| 2.10% |
| -195.88 |
| N/A |
| 19.17 |
| 4.09 |
Performance
Since inception in June 2012, SDOG has lagged the benchmark SPY and Schwab U.S. Dividend Equity ETF ( SCHD ). Moreover, it shows a higher risk measured in maximum drawdown and standard deviation of monthly returns (named "volatility" in the next table).
| Total Return |
| Annual Return |
| Drawdown |
| Sharpe ratio |
| Volatility |
| SDOG |
| 181.49% |
| 9.63% |
| -43.56% |
| 0.57 |
| 16.46% |
| SPY |
| 297.43% |
| 13.04% |
| -33.72% |
| 0.83 |
| 14.45% |
| SCHD |
| 263.05% |
| 12.13% |
| -33.37% |
| 0.8 |
| 14.00% |
SDOG has also lagged in the last 12 months (next chart).
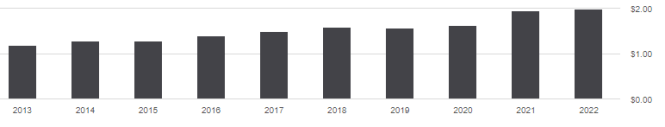
The annual sum of distributions has increased by 68.6% between 2013 and 2022, from $1.18 to $1.99 per share. In that same time frame, the cumulative inflation has been about 27%, based on CPI. SDOG dividend growth has beaten inflation and the distribution uptrend has been quite steady, as reported by the next chart.
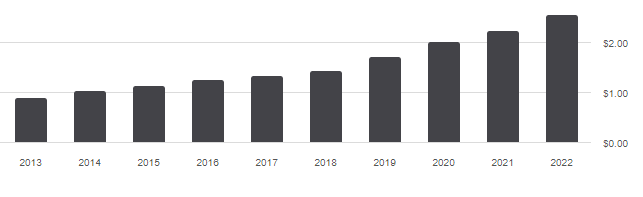
Nevertheless, SCHD has done much better with a total dividend growth of 184% during the same period.
Comparing SDOG with a reference strategy based on dividend and quality
In previous articles, I have shown how three factors may help cut the risk in a dividend portfolio: Return on Assets , Piotroski F-score , and Altman Z-score .
The next table compares SDOG since inception with a subset of the S&P 500: stocks with an above-average dividend yield, an above-average ROA, a good Altman Z-score, a good Piotroski F-score, and a sustainable payout ratio. It is rebalanced annually to make it comparable with a passive index.
| Total Return |
| Annual Return |
| Drawdown |
| Sharpe ratio |
| Volatility |
| SDOG |
| 181.49% |
| 9.63% |
| -43.56% |
| 0.57 |
| 16.46% |
| Dividend & quality subset |
| 304.32% |
| 13.21% |
| -38.40% |
| 0.82 |
| 15.25% |
Past performance is not a guarantee of future returns. Data Source: Portfolio123
SDOG lags the S&P 500 dividend quality subset by 3.6% in annualized return. However, SDOG performance is real, whereas the subset is hypothetical and simulated. My core portfolio holds 14 stocks selected in this subset (more info at the end of this post).
Scanning SDOG portfolio
SDOG is much cheaper than SPY regarding the usual ratios (see next table).
| SDOG |
| SPY |
| P/E TTM |
| 12.7 |
| 21.48 |
| Price/Book |
| 1.53 |
| 3.81 |
| Price/Sales |
| 0.86 |
| 2.44 |
| Price/Cash Flow |
| 8.49 |
| 15.07 |
Data: Fidelity
Nevertheless, growth metrics are underwhelming. The aggregate cash flow trend looks especially bad.
| SDOG |
| SPY |
| Earnings growth % |
| 5.56% |
| 17.73% |
| Sales growth % |
| 5.49% |
| 11.35% |
| Cash flow growth % |
| -13.25% |
| 7.89% |
Data: Fidelity
In my ETF reviews, risky stocks are companies with at least 2 red flags: bad Piotroski score, negative ROA, unsustainable payout ratio, bad or dubious Altman Z-score, excluding financials and real estate where these metrics are unreliable. The fund holds 50 stocks, of which 17 are risky regarding my metrics. Risky stocks weigh 33% of asset value, which is a very bad point.
My calculation of aggregated quality metrics (reported in the next table) points to a quality inferior to the benchmark.
| SDOG |
| SPY |
| Altman Z-score |
| 2.28 |
| 3.45 |
| Piotroski F-score |
| 5.10 |
| 5.64 |
| ROA % TTM |
| 4.38 |
| 7.10 |
Takeaway
ALPS Sector Dividend Dogs ETF picks the five S&P 500 stocks with the highest yields in each sector, except real estate. The fund implements an equal-weight methodology. Valuation ratios are attractive, but aggregate growth and quality metrics are underwhelming. SDOG has lagged the S&P 500 and Schwab U.S. Dividend Equity ETF since inception and in the last 12 months as well. Moreover, it shows higher volatility and deeper drawdowns. The dividend growth rate is ahead of inflation, but it is far behind SCHD. In conclusion, like most ETFs based only on yield, SDOG is unattractive relative to dividend funds with quality filters like SCHD, DGRW, and others.
For further details see:
SDOG: 50 Dogs In Portfolio, Many Are Not The Best Of Breed