UNMA - SDVY: Best Of Breed Small And Mid-Cap Dividend Growth ETF
2024-01-04 16:35:36 ET
Summary
- First Trust SMID Cap Rising Dividend Achievers ETF holds 100 small and mid-cap stocks screened on dividend growth, earnings growth, and quality.
- The SDVY ETF has a well-diversified portfolio but is concentrated in financials and industrials.
- Since its inception, SDVY has outperformed the S&P MidCap 400 index and two close competitors in total return and dividend growth rate.
SDVY strategy
First Trust SMID Cap Rising Dividend Achievers ETF ( SDVY ) has a portfolio of 100 stocks, a 12-month distribution yield of 2.26%, and a total expense ratio of 0.60%. Distributions are paid quarterly. It started investing operations on 11/1/2017 and tracks the Nasdaq US Small Mid Cap Rising Dividend Achievers™ Index.
As described by First Trust , eligible companies must be in the Nasdaq US Mid Cap Index or the Nasdaq US Small Cap Index and not be classified as REIT, have a minimum average daily volume of $2 million, and a minimum market cap of $500 million. Moreover, they must meet dividend growth, earnings growth and quality criteria:
- The trailing 12-month dividends have to be greater than the dividends paid in the same time interval three and five years prior.
- Earnings per share in the most recent fiscal year must be positive and greater than three fiscal years prior.
- They must report a cash to debt ratio greater than 25% and a payout ratio no greater than 65%.
Then, eligible stocks are ranked based on a combination of 5-year dividend increase, current dividend yield, and payout ratio. The 100 best-ranked stocks are included in the index, with a maximum allocation of 30% in any sector and 75% in the small-cap or the mid-cap segment. Constituents are rebalanced in equal weight quarterly and the index is reconstituted annually.
Obviously, this strategy is not designed to produce a high yield, but to select high-quality dividend stocks and mitigate risks.
SDVY portfolio
The fund invest almost exclusively in U.S.-based companies, with about 40% of asset value in mid-caps and 60% in small caps per Fidelity classification. This size profile is quite close to the S&P MidCap 400 Index™. Therefore, I will use SPDR S&P MidCap 400 ETF ( MDY ) as a benchmark.
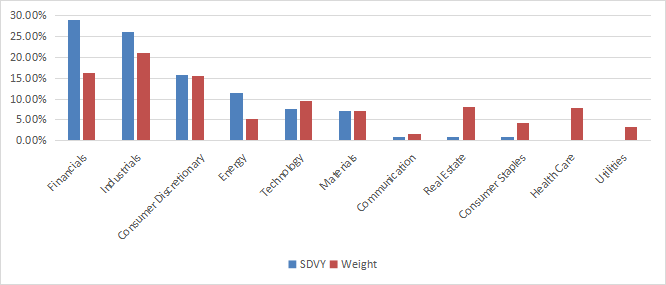
The portfolio is very heavy in financials (28.8% of asset value, with about half of it in banks) and industrials (26%). Consumer discretionary (15.8%) and energy (11.4%) also have significant allocations. Other sectors are below 8% individually and 18% in aggregate. The fund disregards communication, real estate and consumer staples, and totally ignores healthcare and utilities. Compared to the S&P 400, it overweights financials, energy, and to a lesser extent industrials.
Sector breakdown (chart: author; data: First Trust, SSGA)
Positions are equal-weighted at every rebalancing, but they may drift with price action. The current top 10 holdings, listed below, represent 10.7% of assets. These are the constituents with the highest momentum since the last rebalancing. The top name weighs 1.15%, so risks related to individual companies are very low.
| Ticker |
| Name |
| Weight |
| EPS growth %TTM |
| P/E TTM |
| P/E fwd |
| Yield% |
| Matson, Inc. |
| 1.15% |
| -74.44 |
| 13.27 |
| 14.73 |
| 1.11 |
| Alpha Metallurgical Resources, Inc. |
| 1.09% |
| -37.10 |
| 6.94 |
| 7.84 |
| 0.59 |
| Boise Cascade Co. |
| 1.08% |
| -44.90 |
| 9.90 |
| 10.27 |
| 7.04 |
| Unum Group |
| 1.07% |
| 5.11 |
| 7.47 |
| 5.99 |
| 3.16 |
| CONSOL Energy, Inc. |
| 1.06% |
| 80.74 |
| 5.12 |
| 5.21 |
| 0 |
| Chord Energy Corp. |
| 1.05% |
| -58.69 |
| 6.70 |
| 8.81 |
| 7.01 |
| California Resources Corp. |
| 1.05% |
| -56.95 |
| 8.66 |
| 10.20 |
| 2.30 |
| Essent Group Ltd. |
| 1.05% |
| -22.01 |
| 8.45 |
| 8.09 |
| 1.90 |
| SM Energy Co. |
| 1.05% |
| -33.49 |
| 5.75 |
| 6.65 |
| 1.83 |
| Juniper Networks, Inc. |
| 1.04% |
| -13.03 |
| 26.90 |
| 13.09 |
| 2.93 |
Performance
Since 1/1/2018, SDVY has outperformed the mid-cap benchmark in total return and risk-adjusted performance (Sharpe ratio in the next table). The difference in annualized return is 1.66%.
| Total Return |
| Annual Return |
| Drawdown |
| Sharpe ratio |
| Volatility |
| SDVY |
| 69.74% |
| 9.21% |
| -44.70% |
| 0.4 |
| 24.56% |
| S&P 400 MidCap |
| 54.87% |
| 7.55% |
| -42.18% |
| 0.36 |
| 21.93% |
The sum of annual distributions has increased from $0.28 to $0.62 per share between 2018 and 2023. This 5-year dividend growth rate of 121% is far above the cumulative inflation in the same time (about 22%, based on CPI).
SDVY distribution history (Seeking Alpha)
In previous articles, I have shown how three factors may help cut the risk in a dividend portfolio: Return on Assets , Piotroski F-score , and Altman Z-score .
The next table compares SDVY since 1/1/2018 with a subset of the S&P 500: stocks with a dividend yield above the average of their respective indexes, an above-average ROA, a good Altman Z-score, a good Piotroski F-score and a sustainable payout ratio. It is rebalanced annually to make it comparable with a passive index.
| Tot.Return |
| Annual.Return |
| Drawdown |
| Sharpe ratio |
| Volatility |
| SDVY |
| 69.74% |
| 9.21% |
| -44.70% |
| 0.4 |
| 24.56% |
| Dividend quality subset |
| 84.03% |
| 10.69% |
| -34.95% |
| 0.51 |
| 18.22% |
Past performance is not a guarantee of future returns. Data Source: Portfolio123.
SDVY lags this dividend quality subset by about 1.5% in annualized return. My core portfolio holds 14 stocks selected in this subset (more info at the end of this post).
Valuation and quality
SDVY is significantly cheaper than the mid-cap benchmark regarding valuation ratios (except price-to-sales), as reported below.
| SDVY |
| S&P 400 |
| Price/Earnings TTM |
| 10.04 |
| 14.63 |
| Price/Book |
| 1.7 |
| 2.15 |
| Price/Sales |
| 1.29 |
| 1.21 |
| Price/Cash Flow |
| 7.61 |
| 9.8 |
Among the 100 stocks held by the fund, two are risky regarding my metrics. In my portfolio reviews, risky stocks are companies with at least 2 red flags among: bad Piotroski score, negative ROA, unsustainable payout ratio, bad or dubious Altman Z-score, excluding financials and real estate where these metrics are unreliable. Here, risky stocks weigh 2% of asset value, which is an excellent point. However, keep in mind that 28.8% the portfolio (financials) is not assessed in this count.
According to my calculation of aggregate metrics reported in the next table, quality is superior to the benchmark thanks to a very good return on assets.
| SDVY |
| MDY |
| Atman Z-score |
| 4.64 |
| 3.07 |
| Piotroski F-score |
| 5.5 |
| 5.62 |
| ROA % TTM |
| 9.28 |
| 5.06 |
Competitors
The next chart compares characteristics of SDVY and two small and mid-cap dividend-growth ETFs:
- ProShares S&P Midcap 400 Dividend Aristocrats ETF ( REGL )
- ProShares Russell 2000 Dividend Growers ETF ( SMDV ).
| SDVY |
| REGL |
| SMDV |
| Inception |
| 11/2/2017 |
| 2/3/2015 |
| 2/3/2015 |
| Expense Ratio |
| 0.60% |
| 0.40% |
| 0.40% |
| AUM |
| $2.45B |
| $1.51B |
| $815.75M |
| Avg Daily Volume |
| $21.59M |
| $6.51M |
| $4.30M |
| Yield TTM |
| 1.95% |
| 2.43% |
| 2.76% |
| Div. Growth 5 Yr (annualized) |
| 17.69% |
| 10.31% |
| 10.53% |
SDVY is the largest and most liquid of these 3 funds. It has a slightly higher fee and a lower yield, but it shows the best dividend growth rate, which is what matters in this category.
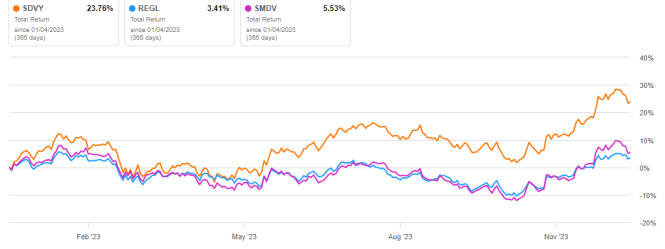
Moreover, SDVY has outperformed its peers since inception, mostly in the last 12 months.
SDVY vs competitors since inception (Seeking Alpha)
SDVY vs competitors, trailing 12 months (Seeking Alpha)
Takeaway
First Trust SMID Cap Rising Dividend Achievers ETF holds 100 small and mid-cap stocks screened on dividend growth, earnings growth and quality. It implements an equal-weight methodology, which contributes to mitigating risks in addition to quality factors. The portfolio is well-diversified across holdings, but quite concentrated in financials and industrials. Since its inception, the First Trust SMID Cap Rising Dividend Achievers ETF has outperformed the S&P MidCap 400 index and two close competitors in total return and dividend growth rate. In conclusion, SDVY looks a good choice for investors seeking a dividend-growth fund outside the usual large cap universe.
For further details see:
SDVY: Best Of Breed Small And Mid-Cap Dividend Growth ETF