SEE - Sealed Air: Highly-Levered Earnings On Equity Masking Profitability
2023-12-02 00:45:20 ET
Summary
- The percentage of companies with durable long-term economics that qualify as investment grade is decreasing.
- Sealed Air Corp. (SEE) earnings high returns on equity due to leverage, so the ratio of earnings to equity is skewed by its capital structure.
- The company's flat sales and earnings growth projections hinder investment returns over the next 1-3 years.
Investment outlook
The percentage of companies offering durable long-term economics that qualify as investment grade is dwindling. Similarly, great companies who employ staff, create products, provide solutions, pay taxes, etc., don't always quality as great investments. Such is the case for Sealed Air Corp. (NYSE: SEE ), in my informed opinion.
Rigorous analysis of the facts underlying SEE's equity prospects supports a neutral view on the company. As it relates specifically to the investor, the critical issues are:
- The firm has compounded earnings on equity capital at an outstanding rate of 70–500%+ from 2020–2023 on a rolling TTM basis.
- To say these returns are highly levered is an understatement. The company's net leverage was 4.1x in Q3, and the equity multiplier on its assets as high as 18x. Stripping out the leverage effects, unlevered ROE is in the 4–5% range on average.
- Such high returns on equity + reinvestment ensures positive FCF to reinvest and deliver owner earnings.
- The stock also sells at 11x forward earnings + EBIT, reasonable requests. But, you're paying 11x the value of highly leveraged net assets, reducing the investor ROE immensely.
Peeling back the layers is critical with a company like SEE and after doing so my judgement is the ratio of earnings to equity is highly skewed from SEE's capital structure, painting an unfair picture on what the value recieves in buying the company.
After careful examination of the facts, my rating on SEE across all 3 investment horizons is a hold, for reasons outlined here.
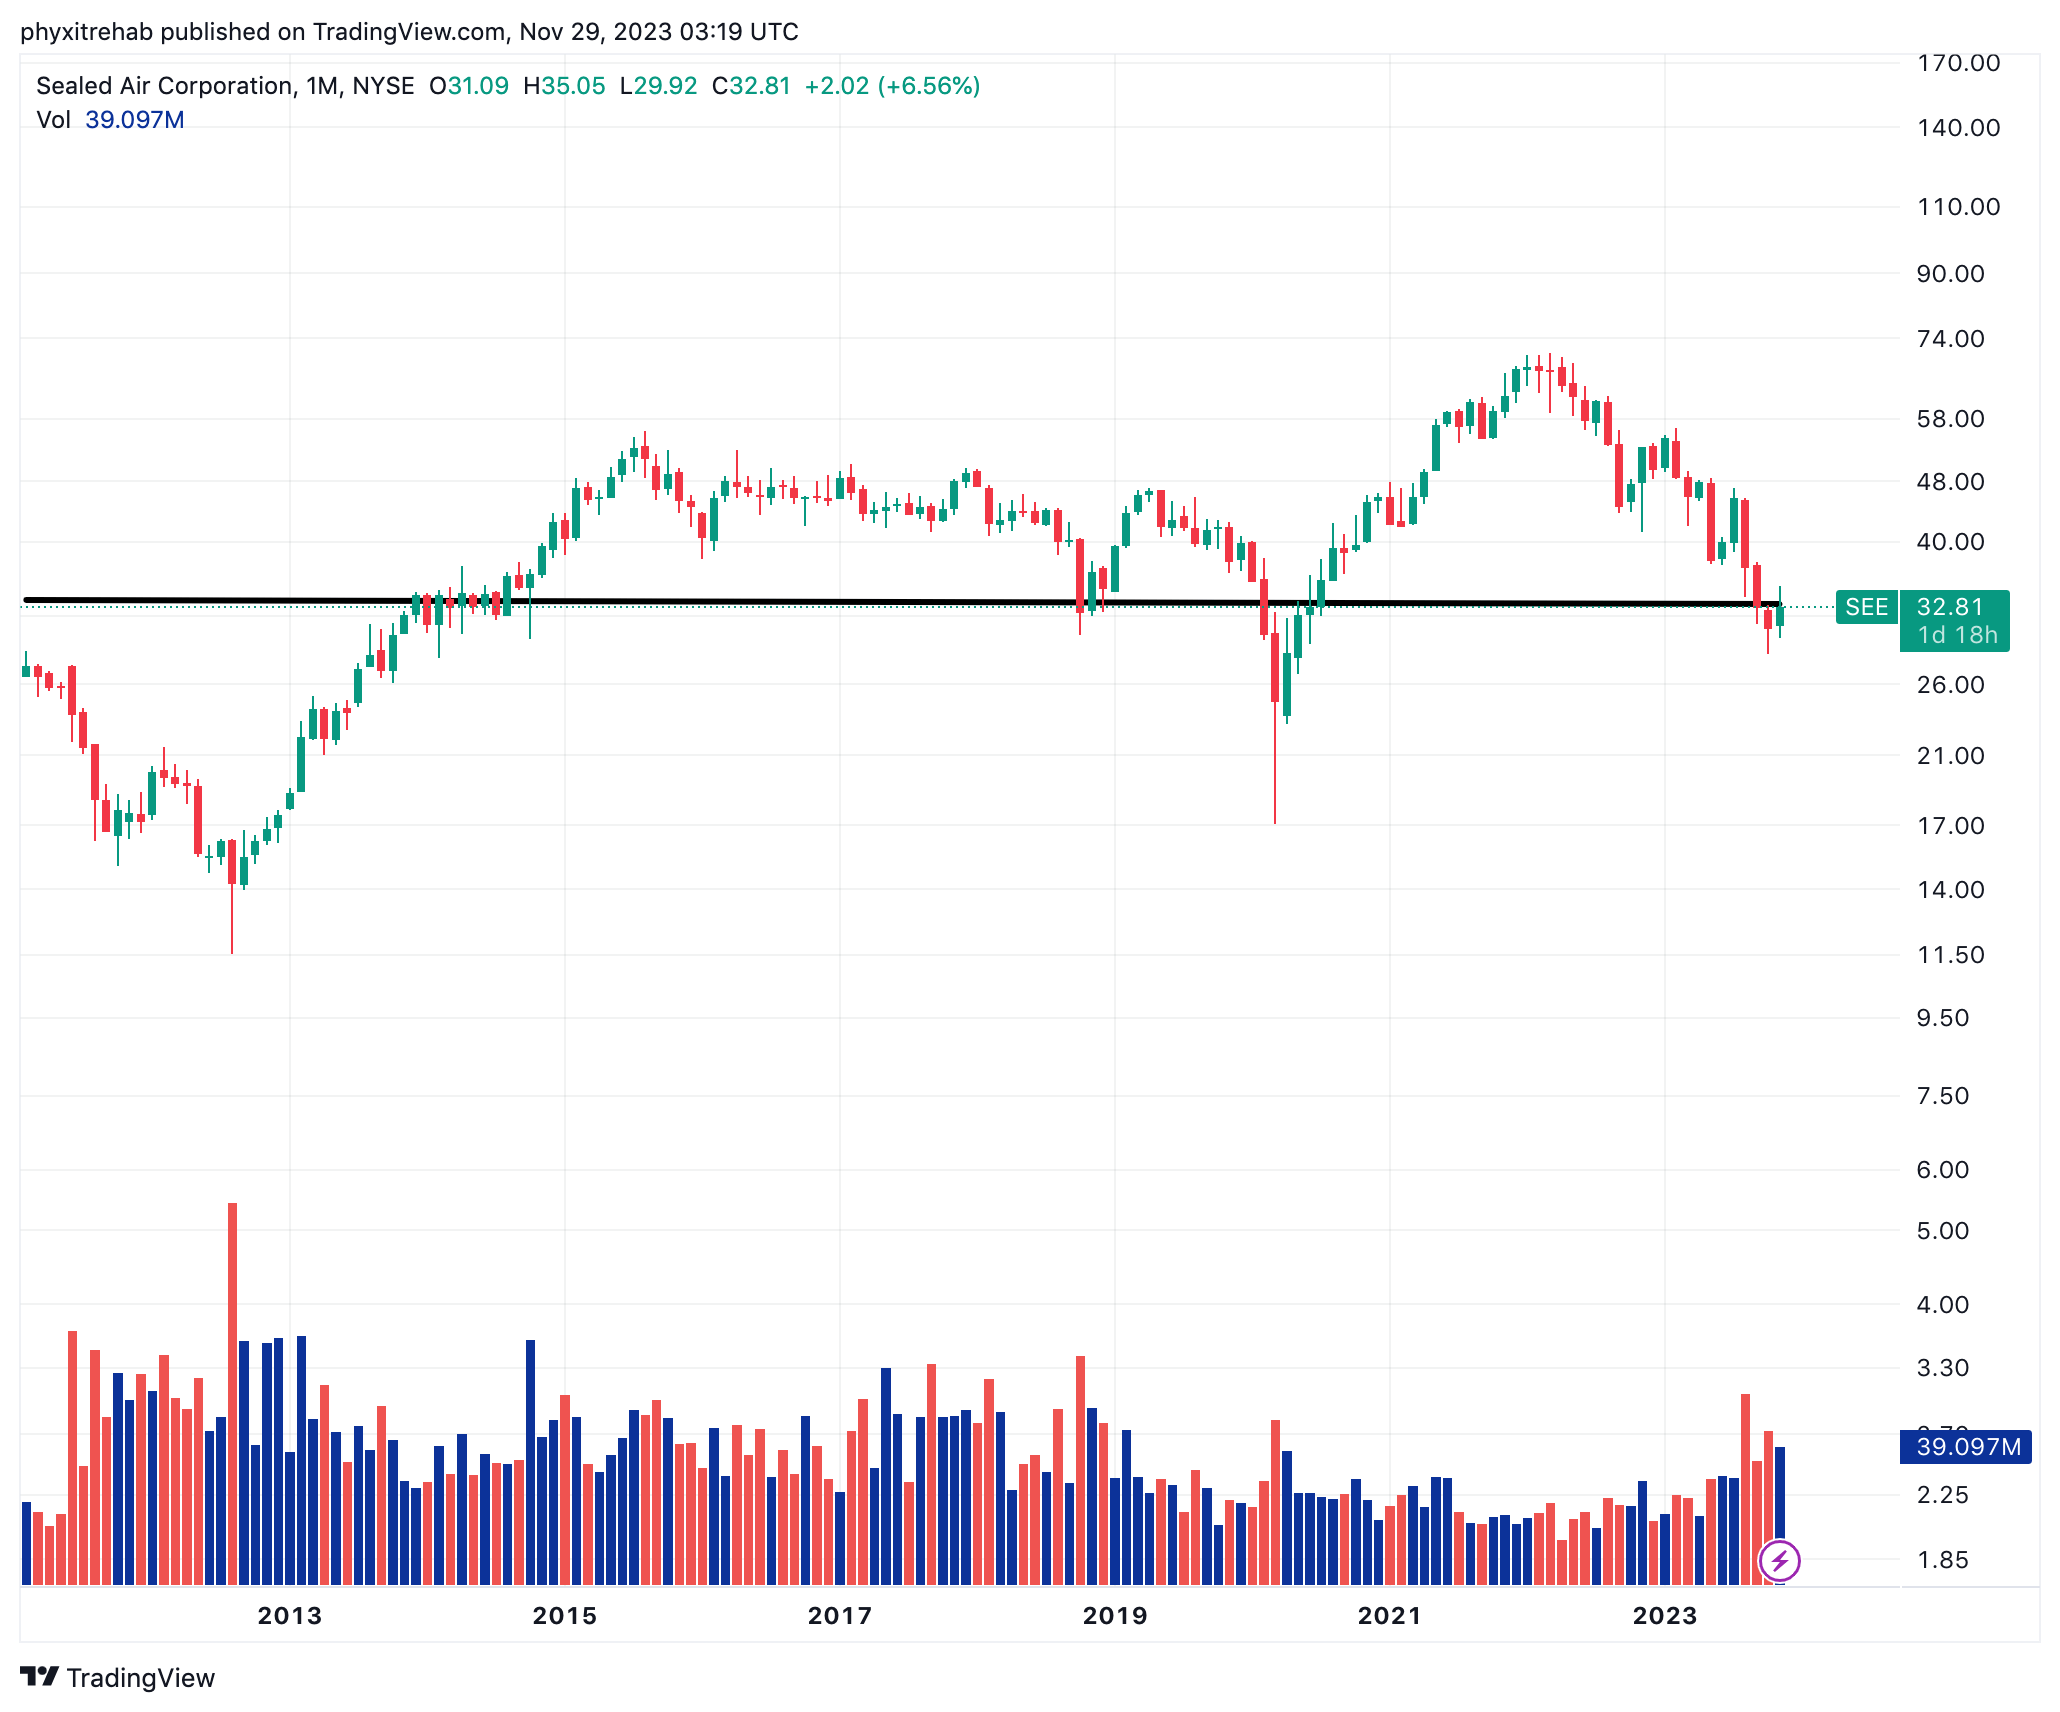
Figure 1. SEE long-term returns (monthly), 2013–2023
Source: Tradingview
Data points supporting investment facts pattern
1. Returns on capital highly skewed by capital structure
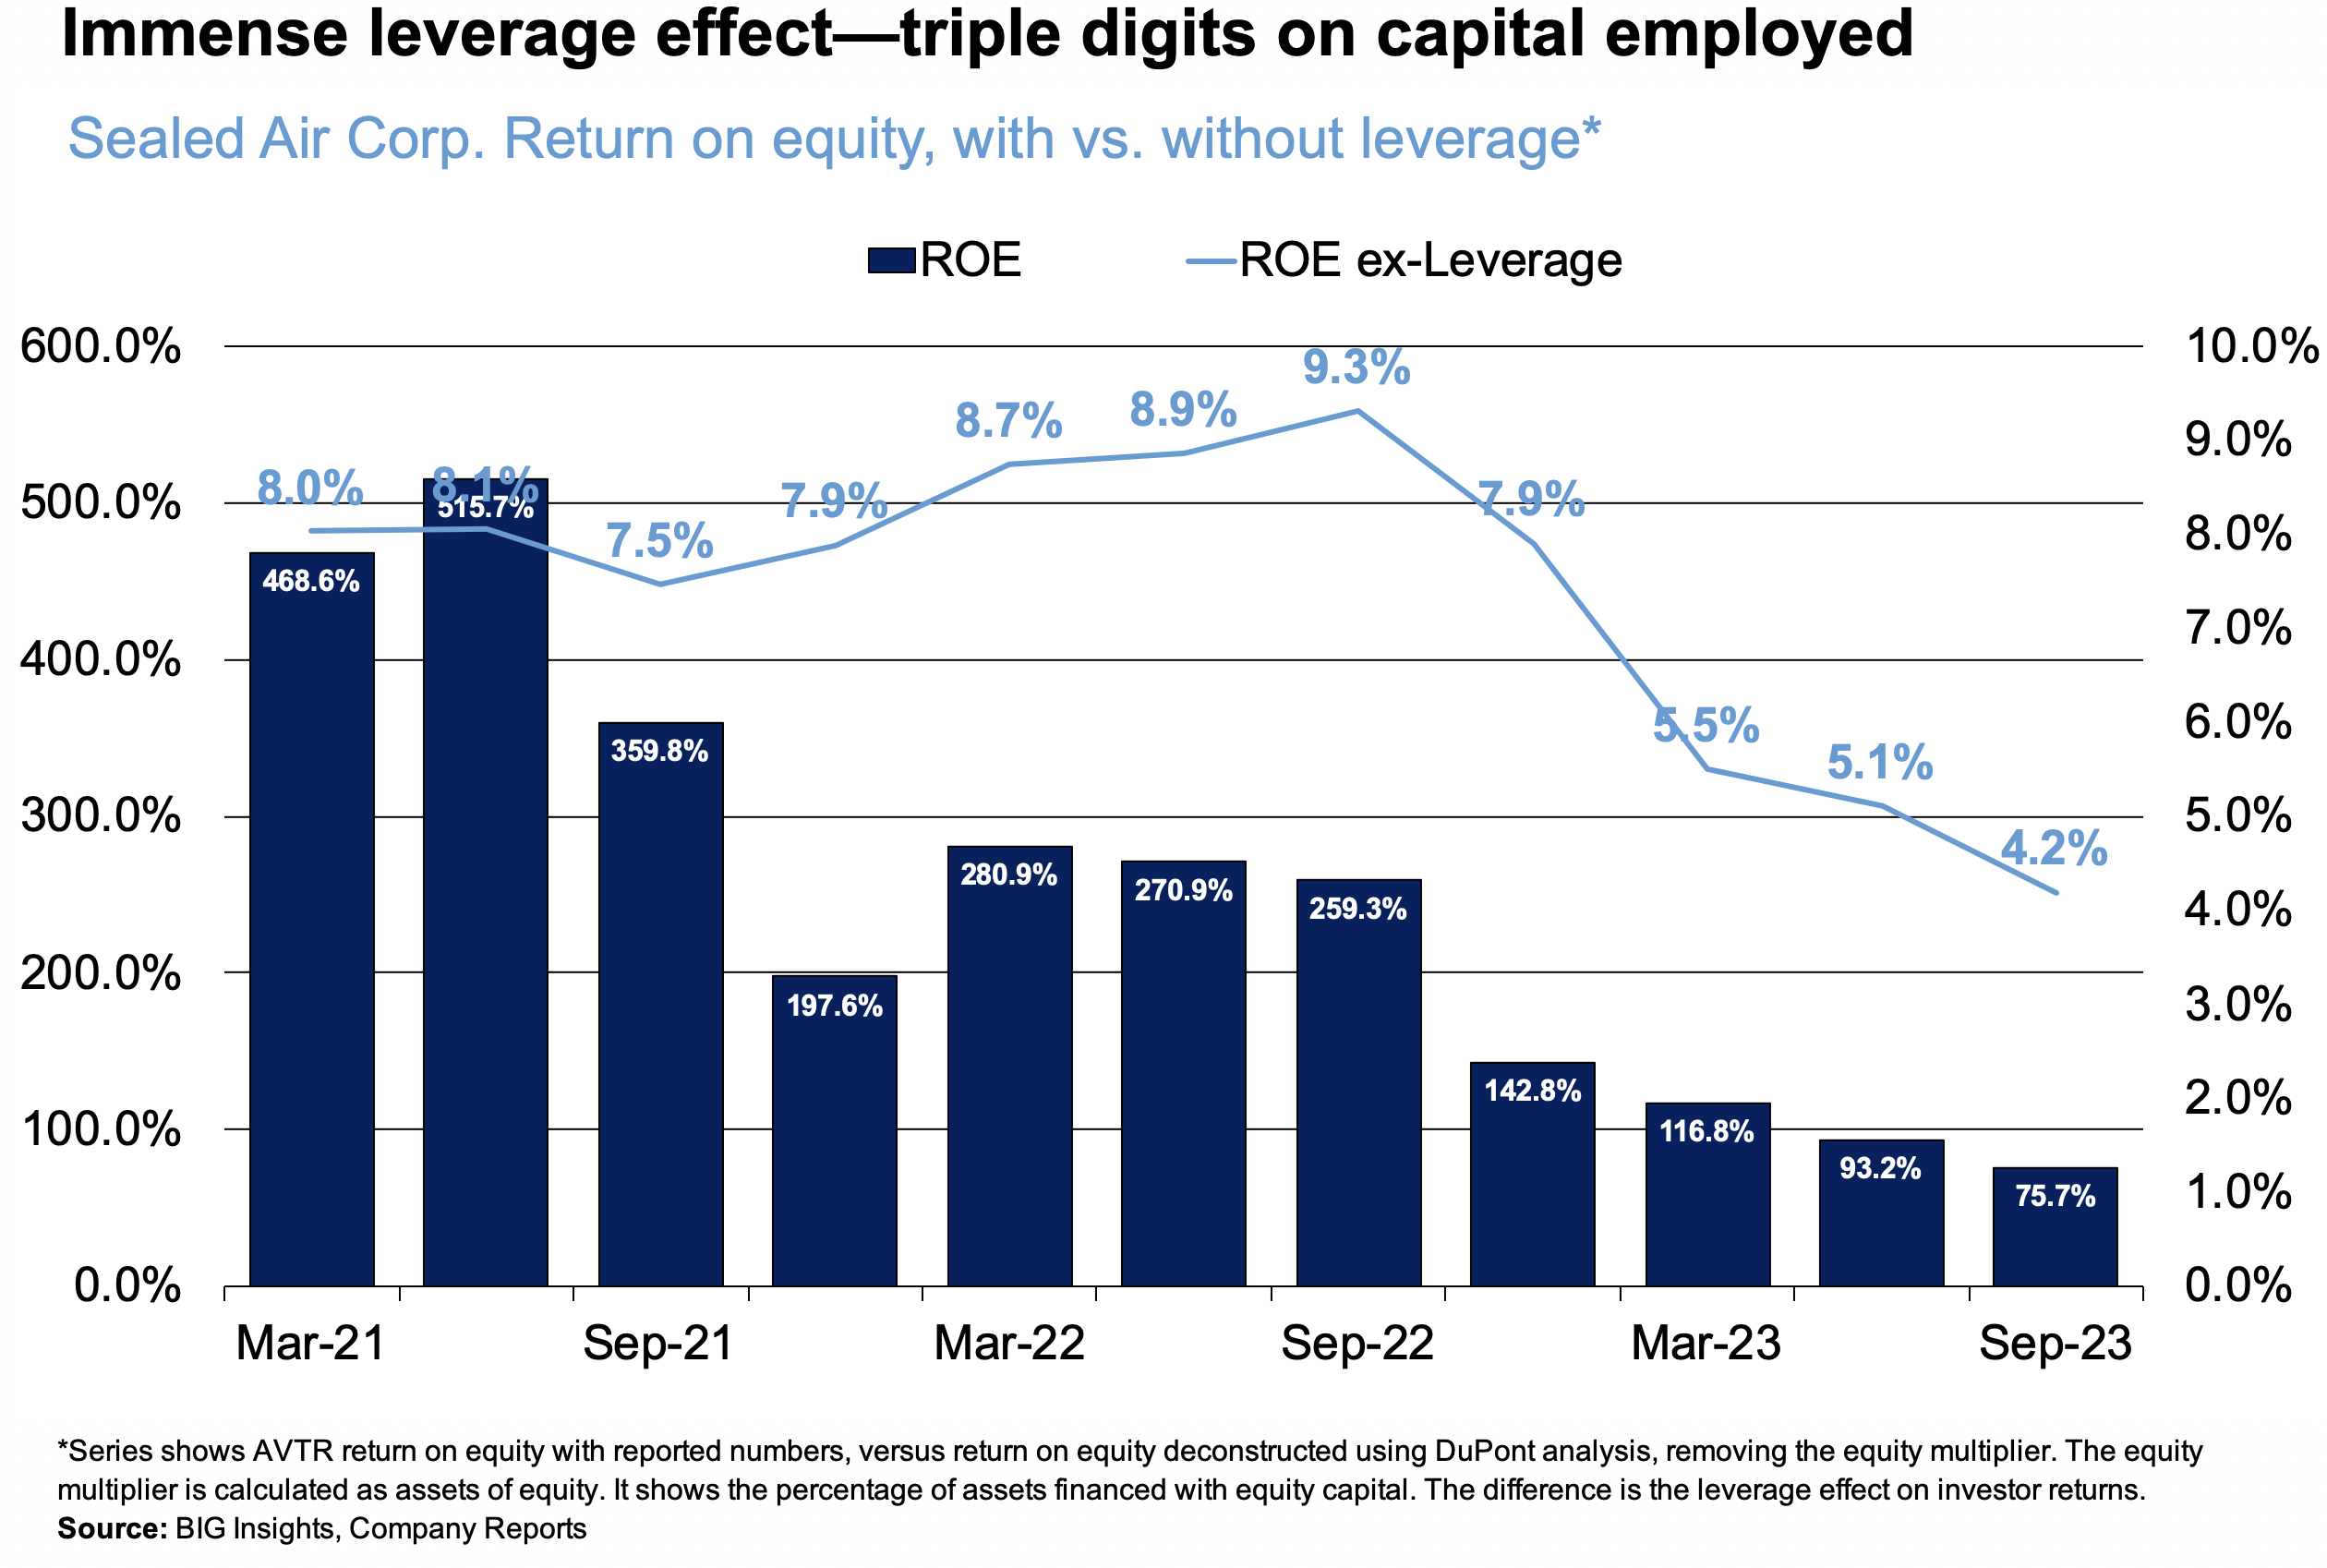
A firm carrying $4.6Bn in long-term debt earning $312mm ($2.16/share) can produce a 75% return on capital employed, as SEE has shown us (Figure 2). On face value, these are terrific investor returns, extending as far back as 2021 (515% ROE).
Only one explanation exists for a firm producing $312mm in earnings on just $408mm of equity capital—leverage. Consider that:
- The equity multiplier (assets/equity) is 18x at the time of writing (7,367/408 = 18), reaching heights of 58x in 2021. Returns on equity are therefore 'multiplied' by that much.
- Other words, only 5.5% of the company's total assets are equity financed, and $1 of equity controls around $18 of assets.
Thank goodness there's an explanation here. Pause for a second. Can you imagine earning 70–100% on equity on a rolling basis?
Stripping out the leverage effect, SEE earned just 4.2% organic on the $408mm of equity in Q3 (TTM values), a far cry from the 75% or so reported. Investor returns are therefore highly skewed by SEE's capital structure. Changes in equity are highly uncorrelated to profit growth.
Figure 2.
BIG Insights
2. 1–3 year investment outlook = flat
Investment returns over the coming 1–3 years are hindered by the company's flat sales + earnings growth projections in my opinion. Linear regression of analyst estimates arrives to 5–13% earnings growth in '24 and '25 respectively, with sales forecasts of 1–3%. This is not unexpected from a company founded in 1960 and selling to international markets on billions in annual sales.
As a reminder, SEE is a packaging solutions company. Its tentacles are wrapped around crucial processes in preserving food, protecting goods, automating packaging processes and so forth. The company's portfolio of core assets + brand names are observed in the table below, of which the major labels are Cyrovac and Bubble Wrap.
Critically, the global food packaging ("GFP") market was also valued at $362.9Bn in 2022. Projections are for the market to expand at a compounding rate of 5.7% from 2023—2030. Growth is expected from levers such as high-performance materials and the availability of diverse material compositions in the market, according to Grand View Research.
Table 1.
| Brand | Description |
|---|---|
| CRYOVAC | |
| Food packaging | |
| LIQUIBOX | |
| Fluids and liquids systems | |
| SEALED AIR | |
| Protective packaging | |
| AUTOBAG | |
| Automated systems | |
| BUBBLE WRAP | |
| Packaging | |
| SEE Touchless Automation | |
| Automation solutions | |
| prismiq | |
| Digital packaging and printing |
Source: Sealed Air Corporation 10-Q
Investment returns over a 1–3 year horizon are heavily impacted by sales + earnings growth. Should SEE hit 1-3% top line growth out to '26, it could be losing market share, growing behind the GFP market.
Quarterly insights are also crucial for visibility going forward:
- SEE did $1.38Bn of business in Q3 , down 100bps driven by weakness in 2/3 geographies.
- Food sales were up 8% YoY, with Liquibox revenues adding $82mm to the top line. Protective sales were down 14% YoY to $488mm, given destocking from its inventory channel.
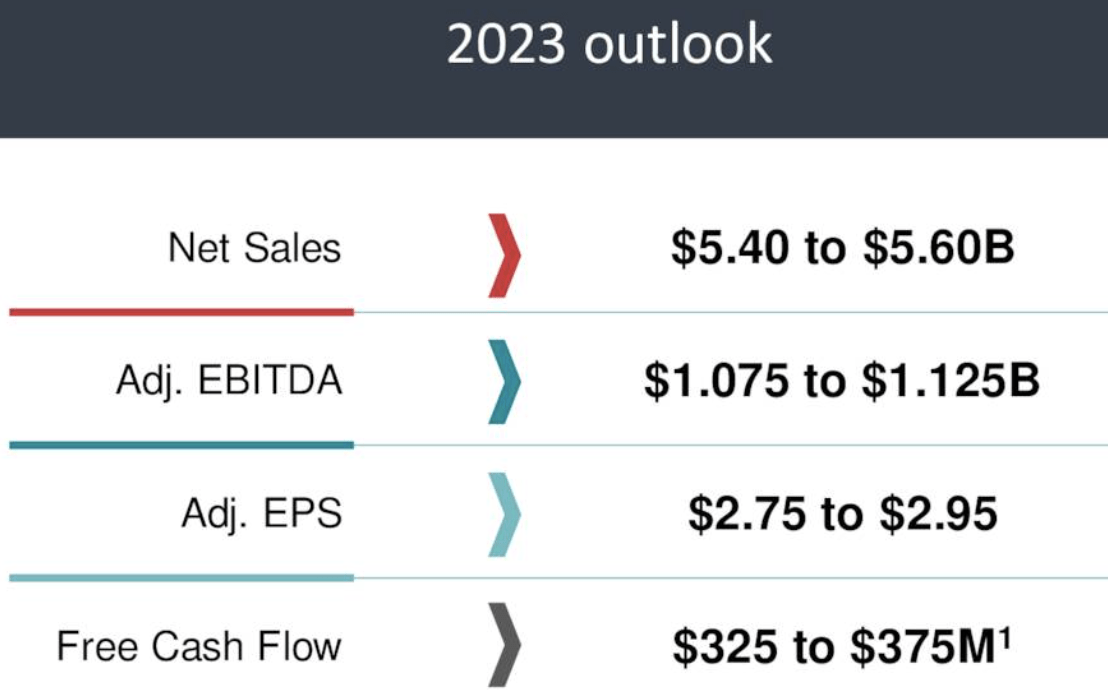
- Management continue to forecast $5.4–$5.6Bn on adj. EBITDA of $1–$1.125Bn, and call for $2.95/share in earnings at the upper range on this.
Figure 3.
Source: SEE Q3 Investor Presentation
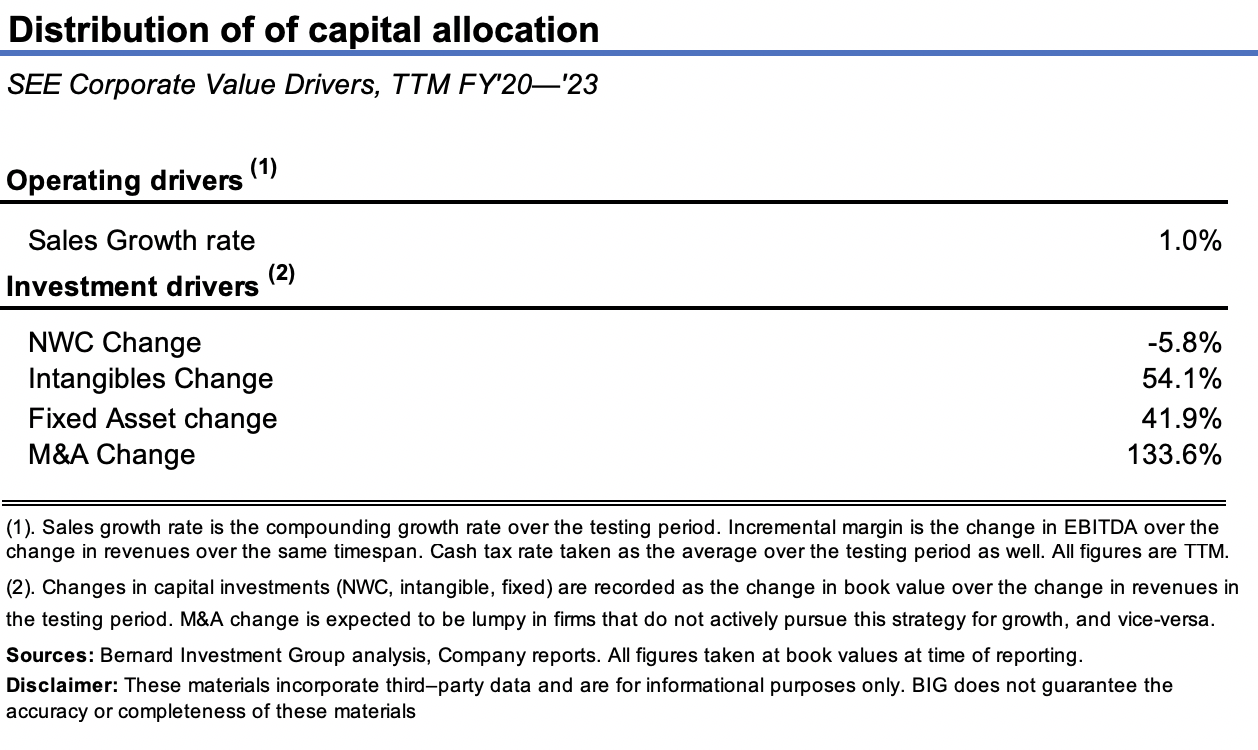
Furthermore, being such a mature phase, growth opportunities are silent. Buying growth is the route instead, mining the acquisition pipeline. Check last 3 years uses of capital (Figure 4). For each $1 of sales growth:
- The company invested $1.33 to M&A,
- $0.54 on the dollar to fixed capital, $0.42 to intangibles,
- reduced its NWC by ~$0.06 per $1.
Point is organic growth is weak, clear indications for— (i) use of leverage to increase business returns, strategic and effective, and (ii) the company is buying growth through its acquisitions. Our strategies look to position against companies spinning off more organic earnings on equity to compound shareholder wealth. From what it seems, the firm is leveraging the finance of acquisitions to maintain its competitive position. Organic earnings on equity haven't responded to this. I'm not attracted to these economics.
Figure 4.
BIG Insights
3. FCF per share tightening
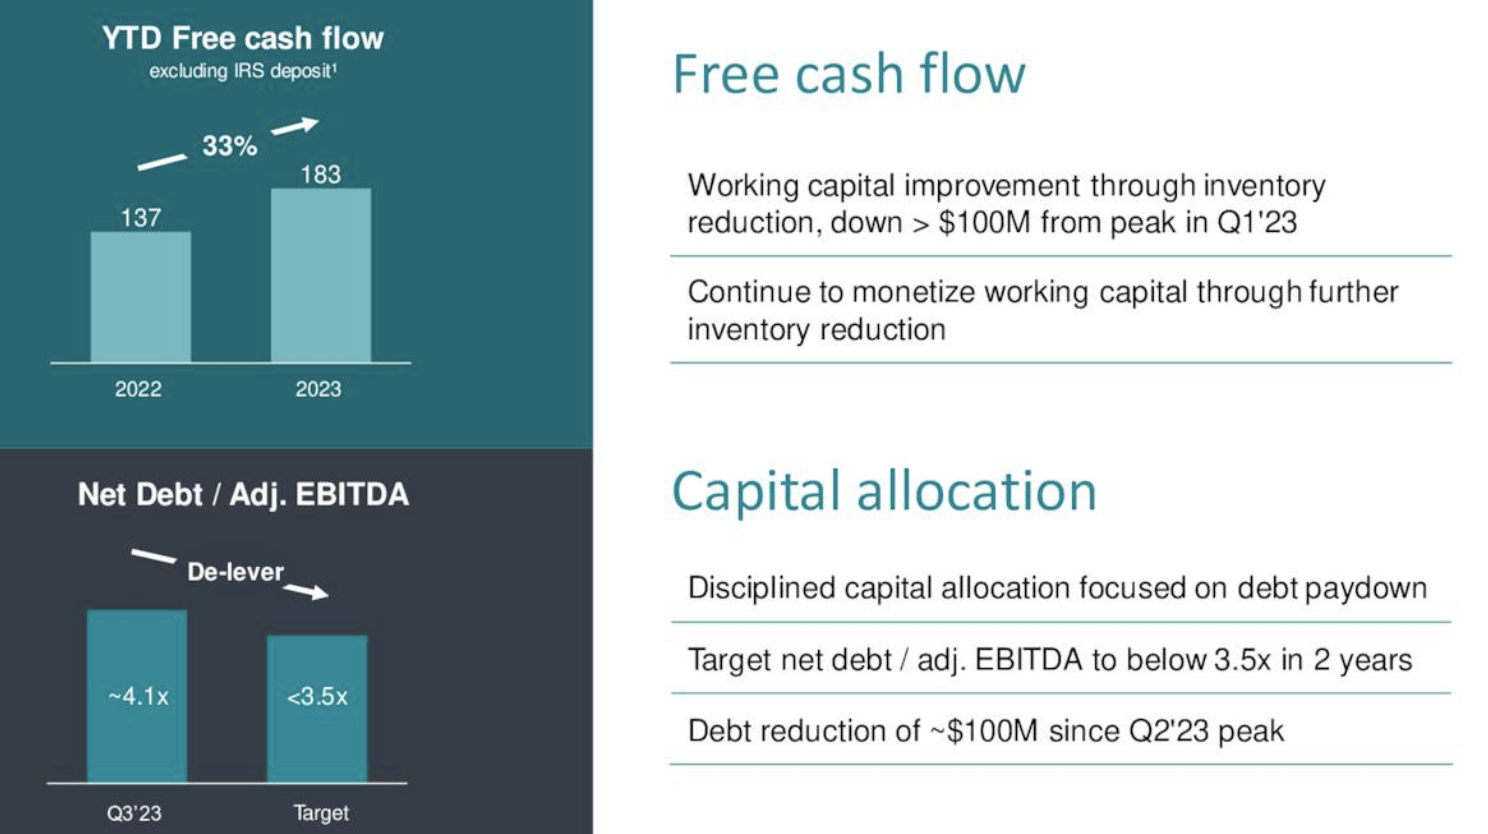
The company has booked $183mm in YTD FCF, vs. $137mm this time last year as it worked through inventory. Most of the cash has been put towards reducing leverage.
Figure 5.
Source: SEE Q3 Investor Presentation
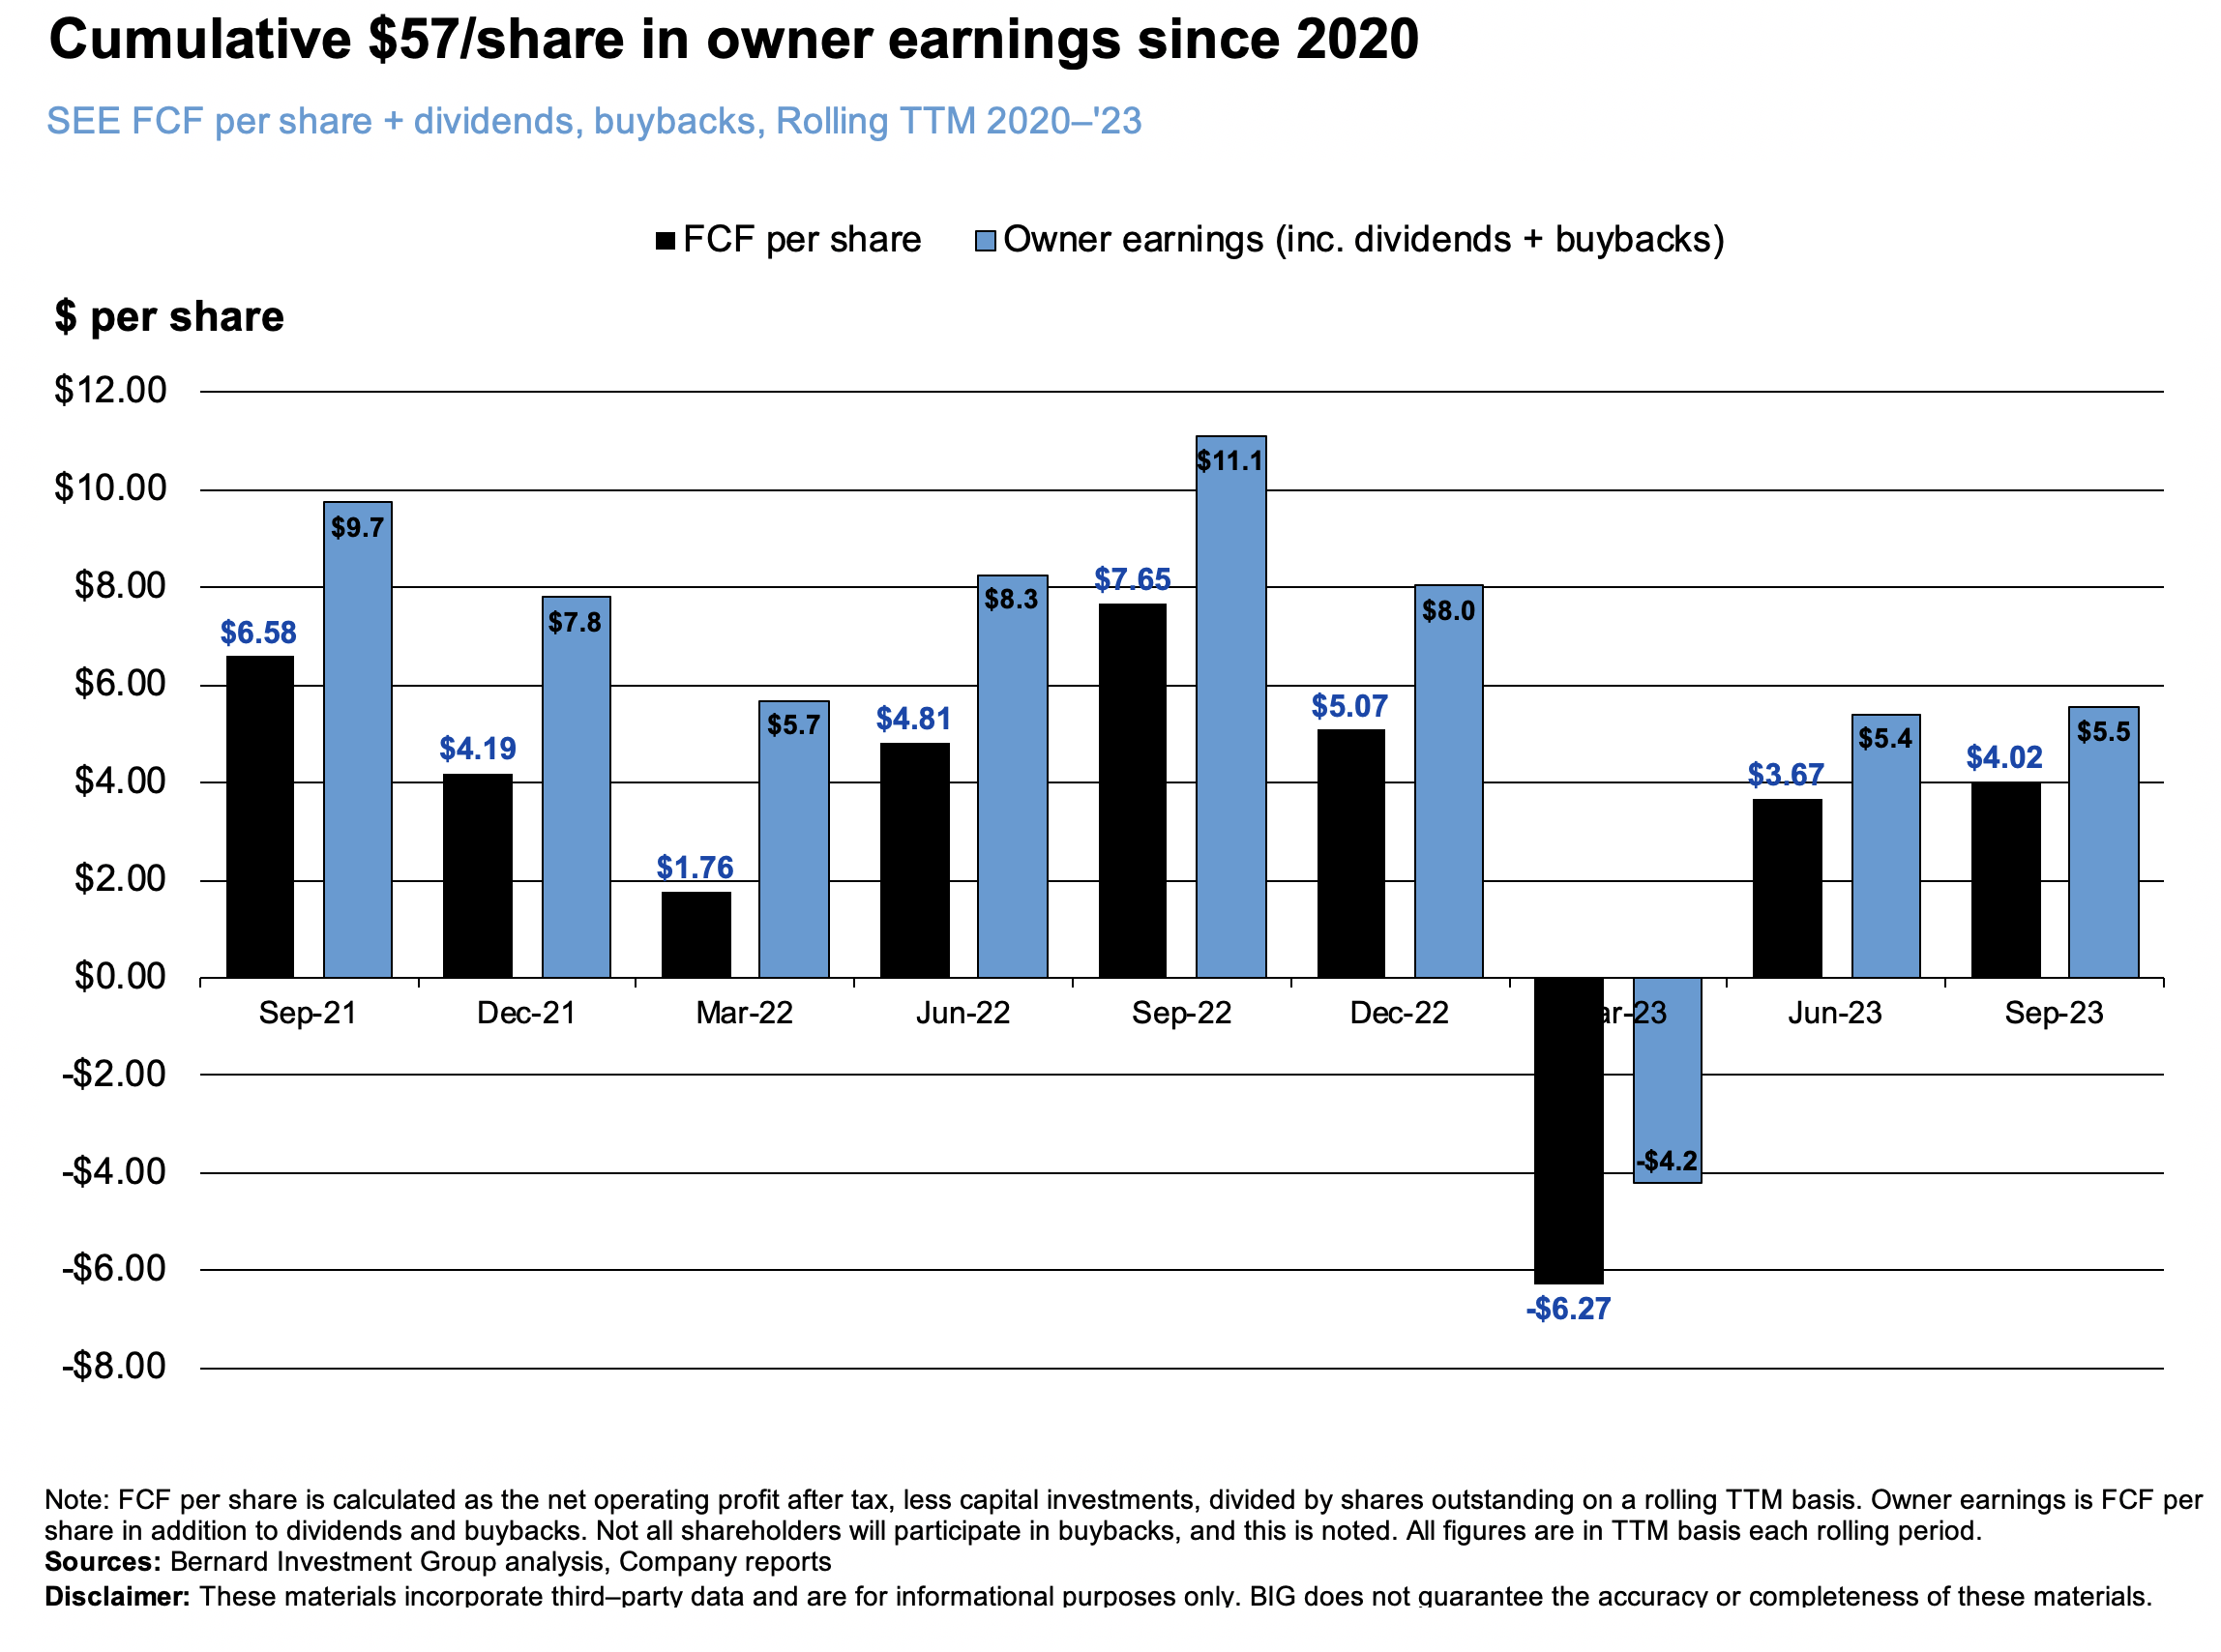
Noted is the firm's calculation of FCF: CFFO less CapEx. This misses the uses of capital outlined earlier. A more nuanced calculation of free cash flow as NOPAT less investments less interest illustrates the decrease from $11/share highs in 2022 to $5.50 in the TTM.
Still, the company has spun off $57/share in owner earnings (FCF + dividends + buybacks) since 2020, around $31/share in FCF/share alone. This is a standout in the debate.
Figure 6.
BIG Insights
Valuation—Price for value
The stock sells at 11x forward earnings and EBIT, both discounts to the sector. For the price paid, one obtains an 11% cash flow yield and 16% FCF yield.
Two points need discussion:
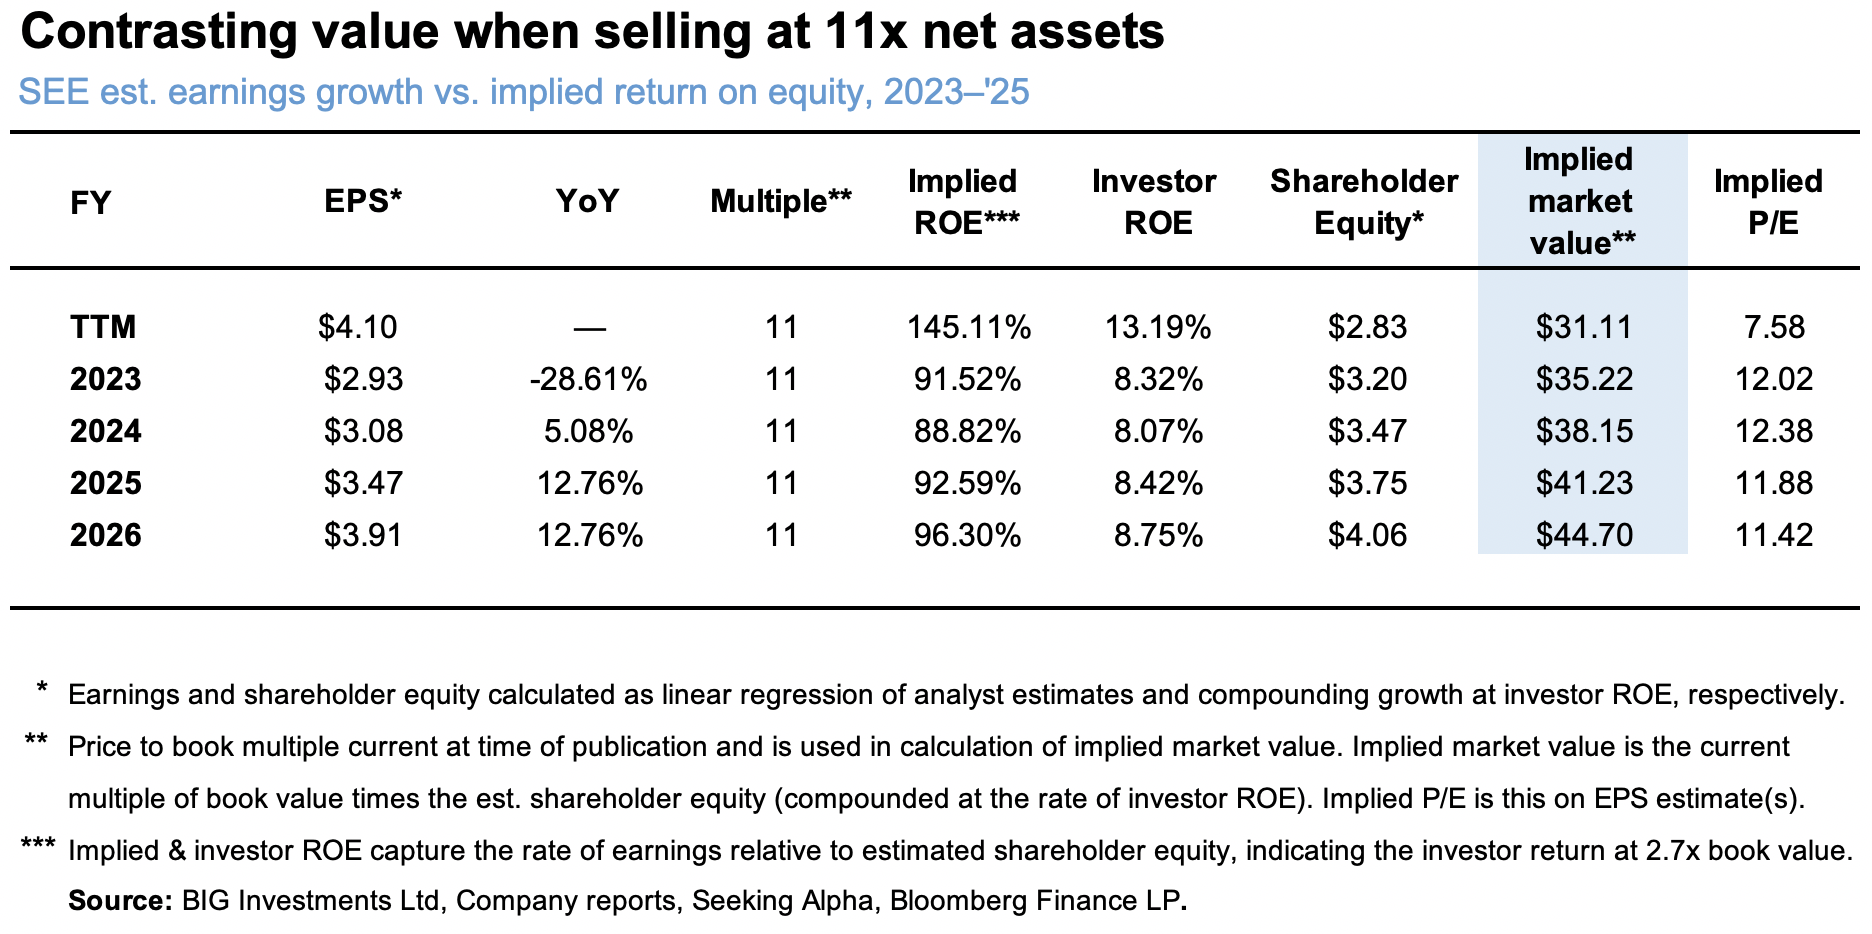
(1). The company sells at 11-12x book value seeing its capital structure, with $2.83/share in net assets employed (11-12x2.83 = $31-$32/share).
(2). The $2.83/share of equity capital produces 75% return for investors. Paying 11.7x capital, the investor ROE is 4% (0.75 x (11 x 2.83) = 6.8%).
Even accepting the company can earn a 75% rate on equity from earlier, paying the 11-12x multiple to acquire the capital skews the forward returns heavily to the downside.
For instance, linear regression of analyst EPS estimates out to FY'26 indicate a potential 90%+ return on average equity given the growth rates. The investor ROE drops to ~8% when paying the 11x, still reasonably comfortable, excepT— this is highly leveraged. The 5–12% projected growth produces 8% ROE with no additional return on investor capital.
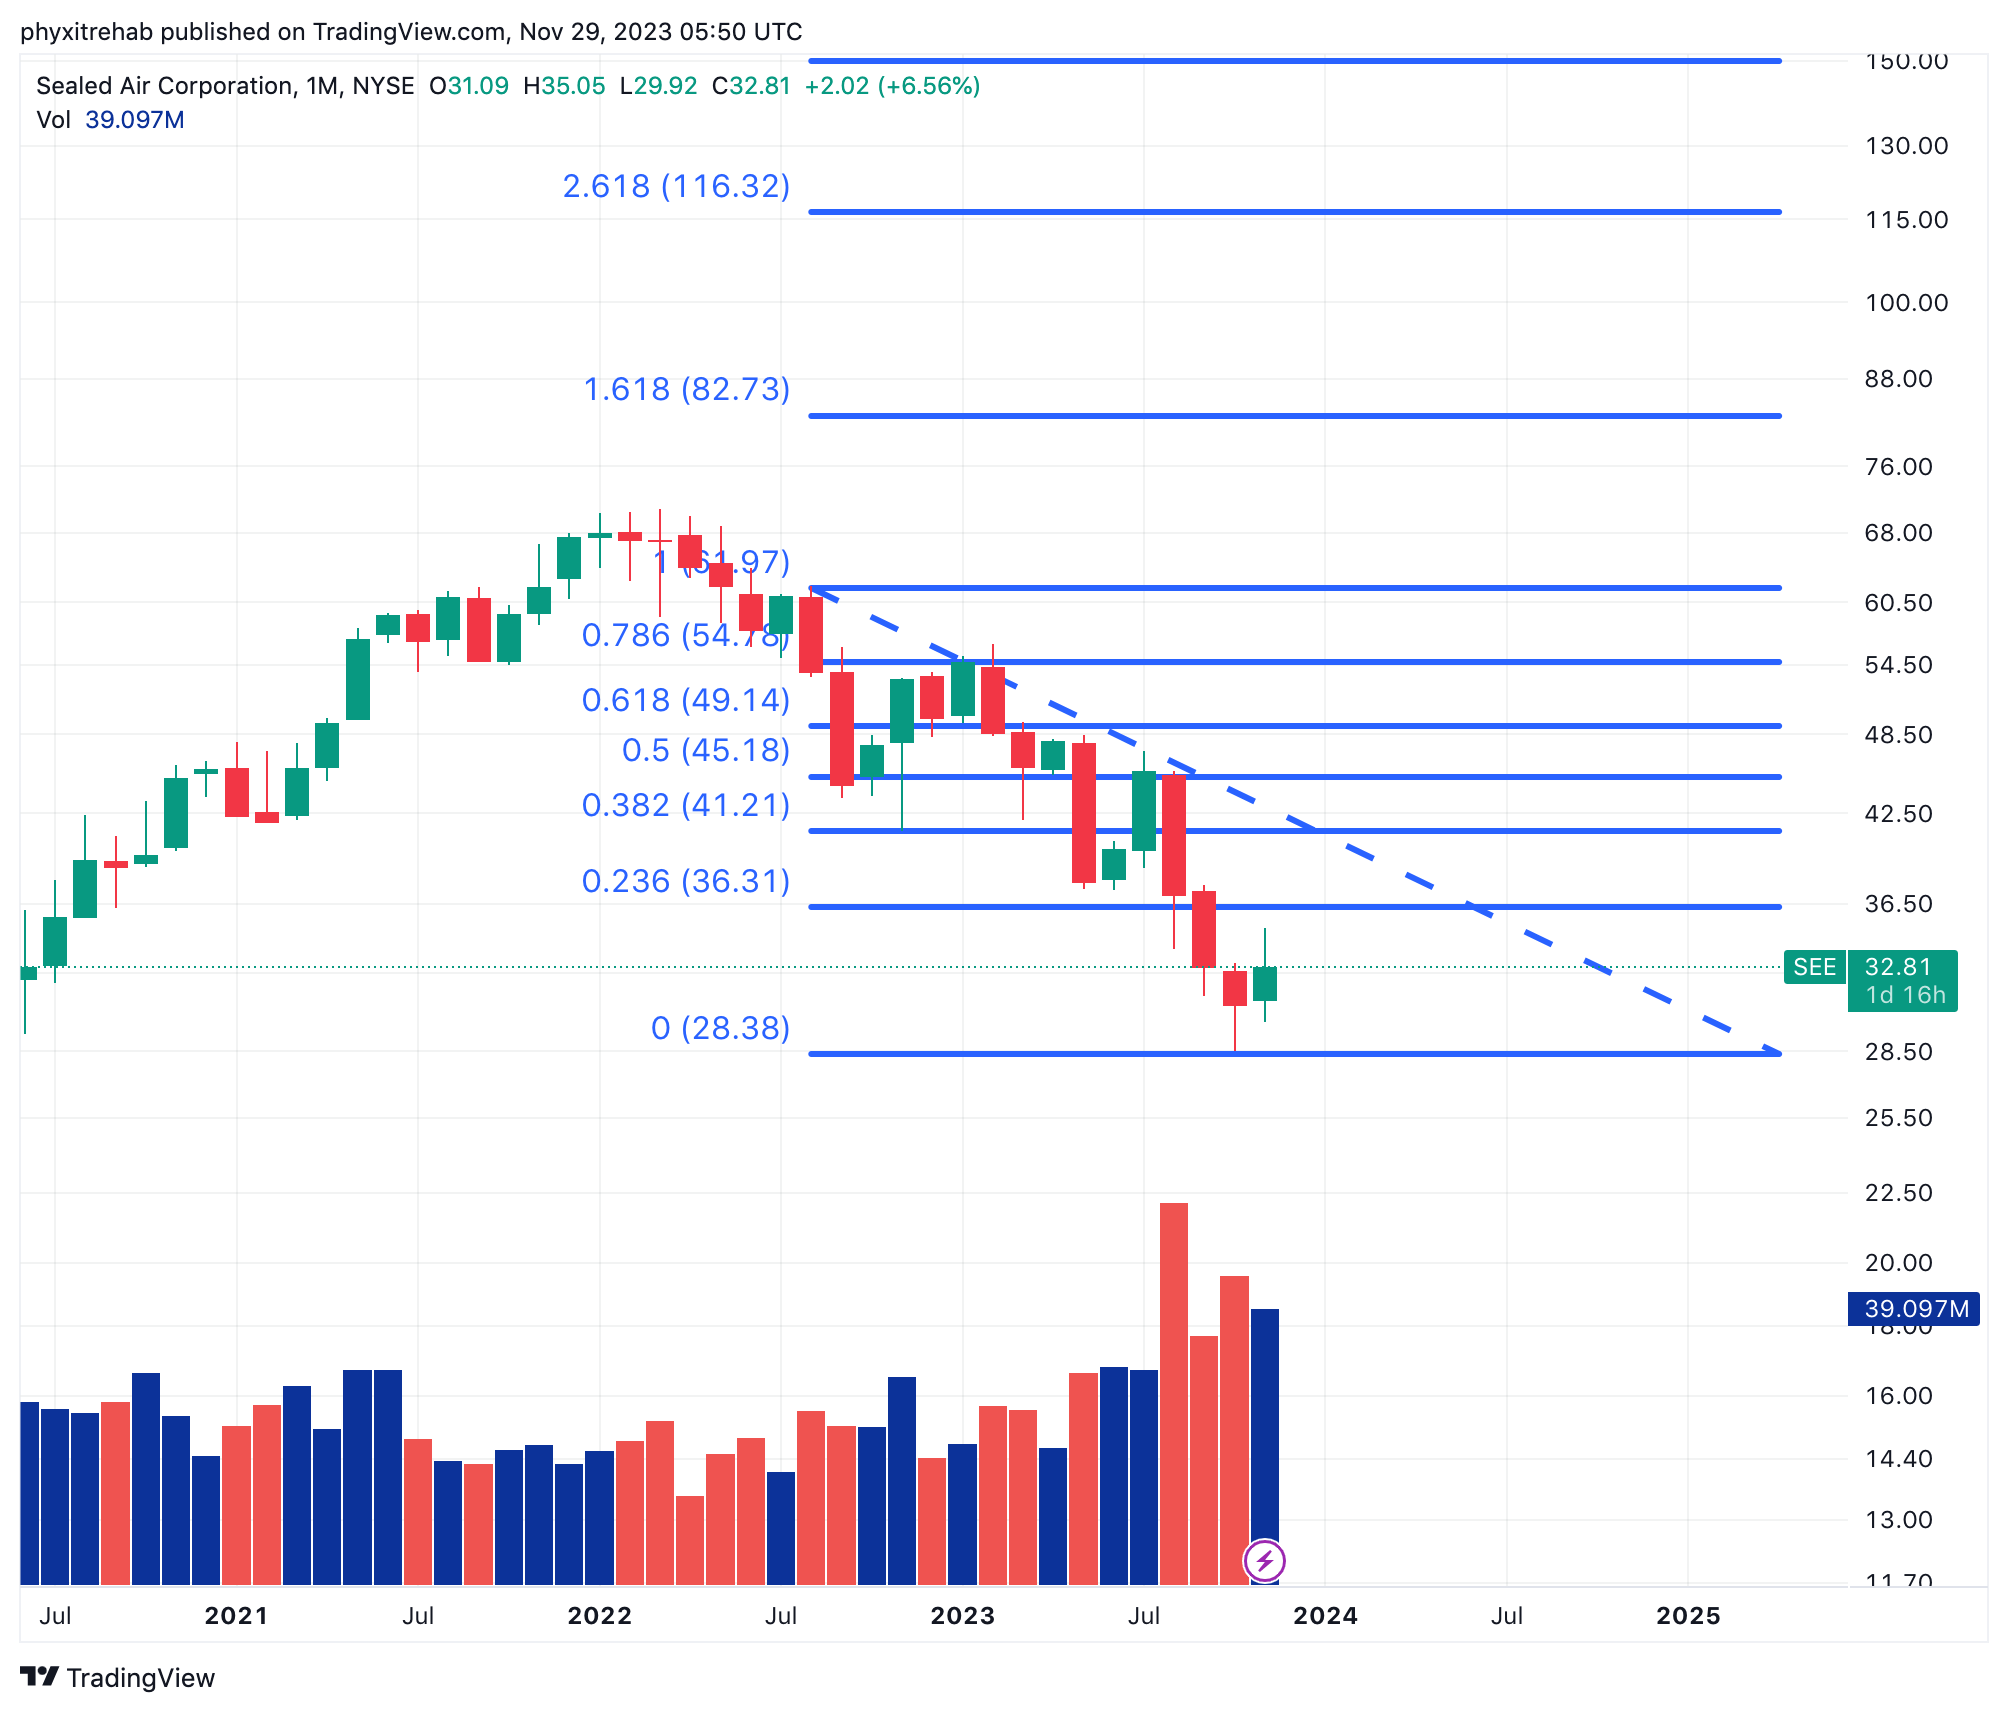
So I get to $44-$45 per share in implied market value by FY'26. Discounting this at the 12% hurdle rate we use, arrives at a $31/share intrinsic valuation, suggesting the company is fairly valued. Notably, $44/share also retraces around 50% of the down channel from SEE's August 2022 highs (Figure 8).
Figure 7.
BIG Insights
Figure 8.
Source: Tradingview
In short, the profits earned on SEE's equity capital are to be highly commended. The company has done exceptionally well to remain to highly profitable. On my examination, this doesn't translate over to shareholder value. Namely, due to:
(1). The multiplier effect of leverage to returns on equity, but not on market value itself,
(2). The fact SEE sells at 11-12x book value, flattening the ratio of earnings to net assets investors can recognize,
(3). The company is financing its growth with debt + acquisitions, which aren't necessarily accretive to growth or value.
Consequently it is my judgement SEE is fairly valued today at the price of around $31–$32 per share. Net-net, I rate SEE a hold.
For further details see:
Sealed Air: Highly-Levered Earnings On Equity Masking Profitability