SEM - Select Medical: Capital Charge Now $6.1Bn At C.6% Trailing Returns Reiterate Hold
2023-08-11 07:54:57 ET
Summary
- Select Medical Holdings Corporation's investment outlook remains unchanged despite continued financial performance in my view.
- The company's capital allocation at mediocre rates of return aren't the kind of economics to appreciate investor returns.
- As such, the company has not been able to compound its intrinsic value over an extended period.
- Net-net, reiterate hold.
Investment update
Following my revised rating [from buy to hold] on Select Medical Holdings (SEM), little has changed in the investment outlook by best estimation. Following the company's Q2 numbers posted last week, SEM demonstrated 1) continued financial performance, but 2) its propensity to allocate capital at mediocre rates of return-a key finding that changed my posture on the company last publication.
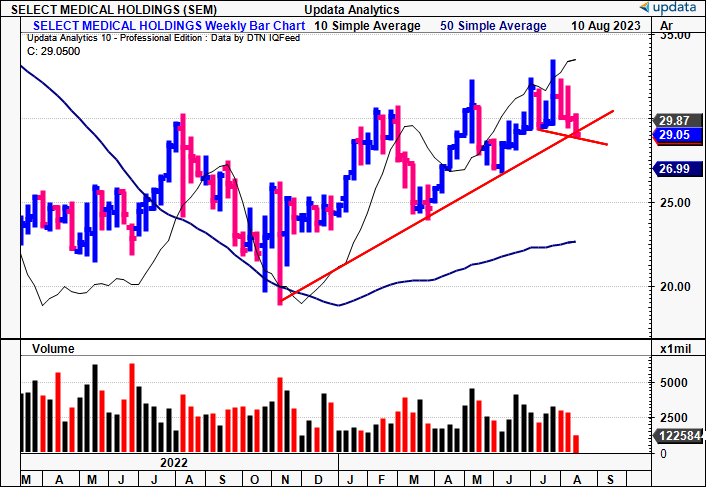
Despite the financial performance exhibited by SEM this year, management calls for $6.7Bn in turnover for FY'23, ~$500mm above its current capital base. As such, it now carries a $6.2Bn capital charge returning just ~6-8% in trailing returns, not enough to outpace long-term market returns. This is a capital-heavy business. My required rate of return means it must post at least $915mm in post-tax earnings this year on the $6.2Bn (c.15% return on capital deployed) in order to get me interested, which, on a bounce of probabilities, does not look to occur. Net-net, reiterate hold on an implied market value of $3.1Bn ($24/share).
Figure 1. SEM price evolution, weekly, FY'22-date
Updates to critical investment facts
Since SEM's value equation involves a combination of capital allocation and same-store revenue growth, a detailed profile of these factors is necessary to extrapolate the company's investment potential. The detailed analysis follows.
Q2 earnings run down
By the end of the 2nd quarter , SEM had 108 critical illness recovery hospitals on its books across 28 states, combined with 32 rehabilitation hospitals in 12 states. It also juggled 1,944 outpatient rehabilitation clinics and 540 occupational health centres. In total, this pulls to 2,084 facilities driving income for the company. These sites are the arteries feeding to the heart of the business, pumping business income to its shareholder cell unit.
Insights
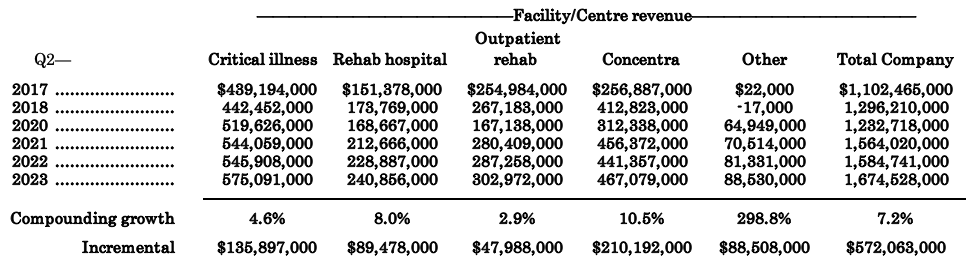
Looking to the Q2 numbers, revenues grew 5.7% YoY to $1.675Bn. It pulled this operating income of ~$160mm, up 31.6% YoY, on earnings of ~$92mm (up ~39% YoY). It brought in around $235mm in operating cash flow on these profits, also up in the mid-30's of growth YoY. Scaling back each second quarter, going back to Q2 FY'17, the company compounded its top line by ~720bps, adding another $572mm in quarterly turnover over this time. Its Concentra arm has been the most lucrative, compounding 10.5% and adding $210.9mm of this total.
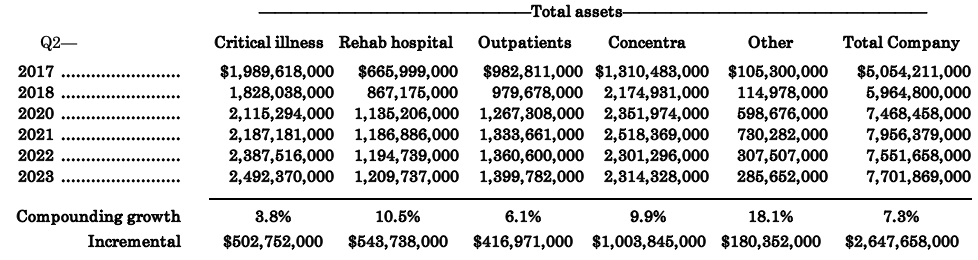
Similar trends are observed in the asset growth of each segment [Figure 3]:
- The company has grown gross asset value by ~$2.68Bn from Q2 FY'17-date, now with $7.7Bn on the books.
- In total, it has expanded its asset base by 7.3% geometrically since Q2 2017-Q2 2023, driven by all operating segments.
- Again, the Concentra investment has expanded the most, growing ~9.9% YoY on average and adding $1Bn to the company's gross asset value. This is fitting, seeing as the $1Bn incremental assets have added $210mm in sales.
Figure 2.
Figure 3.
Figure 3a.
Data: Author, SEM SEC filings
A closer look at cash flows is constructive in my view. Day sales outstanding ("DSO") were at a neat 52 days in Q2, down from 53 days last year. I'll discuss uses of cash a bit later, but it put $84mm back into value-added sources for shareholders (buybacks and dividends included), paying another $340mm in interest and debt principal.
Operating margins were helped with favourable movements in agency costs in Q2 as well. SEM managed to trim its RN agency costs by 7% in Q2, and the agency RN hourly rate tightened from $83-$77/hr. Agency utilization stood firm at 18%, in line with the last 3 quarters. Moreover, agency utilization started at 19% in April and May, and had eased down to 17% by the end of the quarter.
Top-line disaggregation
The divisional highlights were as follows:
- The critical illness recovery hospital business continues its expansion. Revenues spiked up by 5.3% to $575.1mm on adj. EBITDA growth of 227% to $65.5mm. Salary, wages, and benefits ("SW&B") relative to this turnover was down by 8 percentage points. It opened 3 new hospitals, two of which are JVs, bringing its total to 108 hospitals.
- Rehab hospitals brought in $241mm in turnover on $54.7mm in adj. EBITDA, a 22.7% margin that grew ~5 percentage points YoY. It operated 32 rehab hospitals by the end of Q2.
- Outpatient rehab revenues were up 6%, underscored by patient volume growth of 11% YoY. Net revenue/visit slipped ~$3.00 to $100/visit on the increase in volumes. SEM expects a return to its longer-term range of $102-$103 in revenue per visit by next year. Sales hit $303.0mm for the quarter in its outpatients' arm from the 1,944 clinics/facilities in operation.
- Finally, the Concentra segment wasn't too far off, with revenues up by 5.8% to clip $467.1mm.
You can see the company's net additions for each segment in Figure 4. It has added 353 facilities (a mix of hospitals and outpatient facilities) since 2017. Last year was a big investment, with 294 sites bought onto the books. By far, its outpatient facilities have expanded the most, with 336 additions over this time. Critically, the average revenue per outpatient facility has increased from $0.094mm to $0.124mm over this time, a 31% total gain. Similarly, the average revenue per hospital in 1) critical illness, and 2) rehab, has increased from $4.3mm/per hospital to $5.3mm per hospital, and $7.2mm to $7.5mm/hospital respectively.
Figure 4.
Data: Author, SEM SEC filings Data: Author, SEM SEC filings
Capital commitments, return on capital deployed
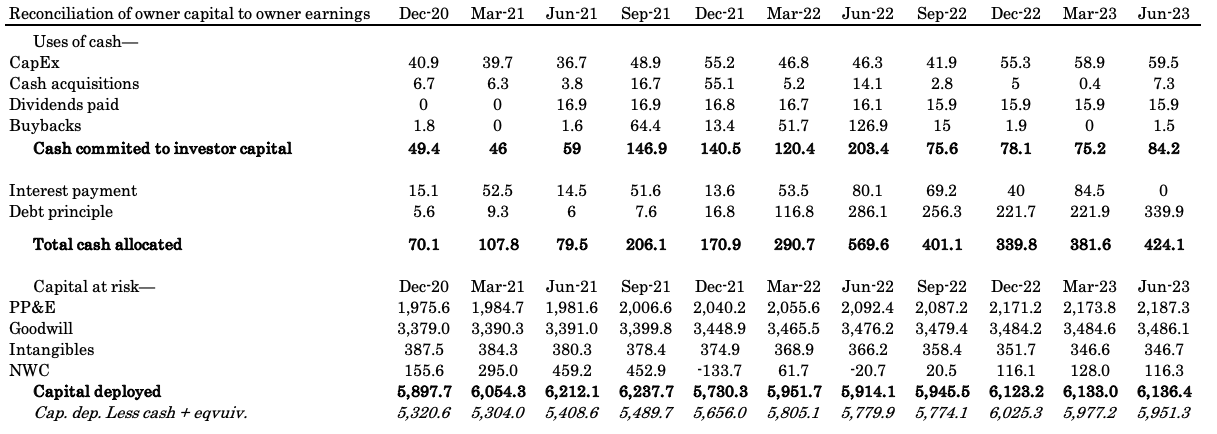
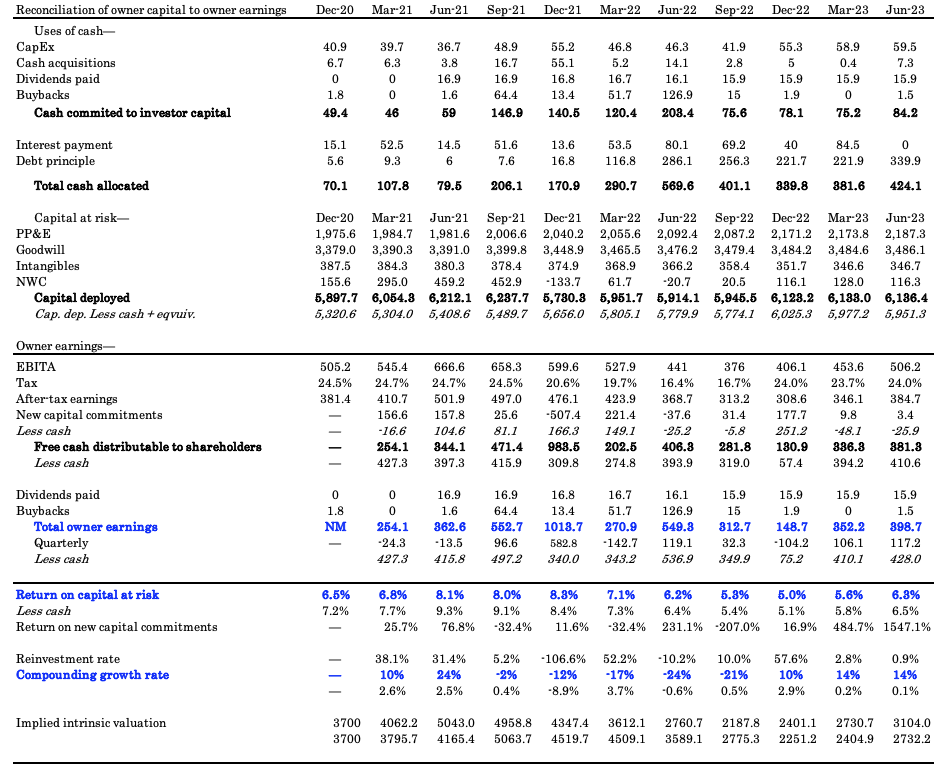
The reconciliation from equity holders capital to owner earnings is observed in the series below, with the conjoined reconciliation seen in Appendix 1. Critically, uses of cash in Q2 were as follows:
- Around $60mm was diverted to CapEx and $7.3mm towards cash acquisitions. I'd estimate ~$10mm of this was growth CapEx, ~$17mm if you include cash transactions as growth investments.
- It paid $16mm in quarterly dividends, and bought back $1.5mm of stock during the quarter. You're at $0.50 in annual dividends on this, a forward yield of 1.7% as I write.
- Thus, ~$74-$84mm of cash was allocated to value-additive capital in Q2 in my view. It also paid $340mm in debt principal, and had paid ~$84mm in interest in Q1. All up, it used $424mm of cash to these mentioned sources in Q2 [note: cash taxes are excluded].
It also committed $3.4mm in new capital from Q1-$184.7mm over the 12 months to June 30 2022-bringing the total capital deployed and at risk to $6.14Bn. Thus, c.80% of the company's asset base is tied up directly to operations, generating operating income.
Figure 5. Note: Compare all figures to "less cash" lines.
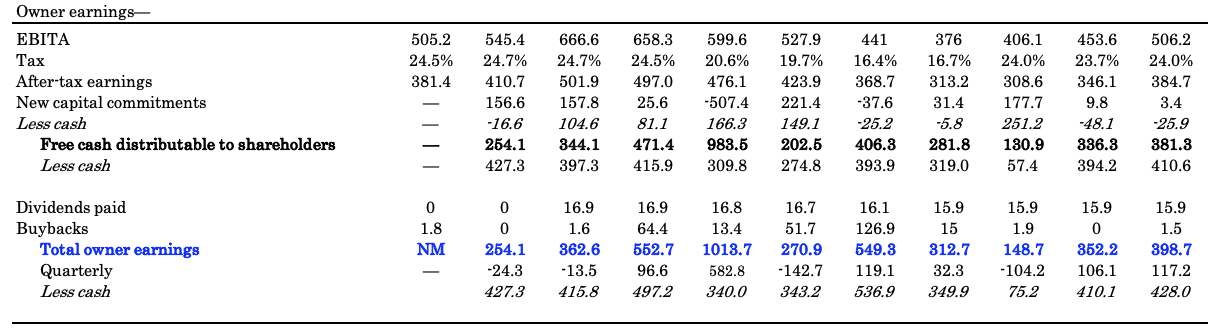
Post-tax earnings clipped $384.7mm for the TTM and $120mm for the quarter. Both were up ~4.5% YoY. After factoring in commitments to new capital, dividends and buybacks for the quarter, SEM investors obtained $117mm in owner earnings, $398mm on a TTM basis. Removing cash + marketable securities from all capital allocations, gets you to $428mm in trailing owner earnings.
Figure 6.
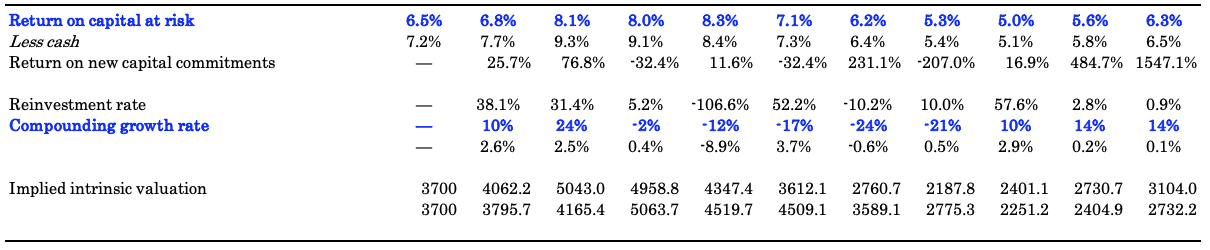
The post-tax earnings produced on the firm's existing capital at risk and new capital deployed range from 6-8% over this time, not above my required rate of return of 12%. If market returns closely resemble business returns over time, then SEM is not beating the market return on capital (10-12% here based on long-term market averages). It's challenging to say SEM is creating value for its shareholders in this regard. In the same breath, therefore, the economic losses it's produced have ranged from 4-6%, hardly accretive to value.
Part of this is the growth in owner earnings-up from $254mm in 2020 to $398mm last quarter (TTM basis), and the dividends distributed over this time. But the firm isn't reinvesting large sums towards growth capital on a regular basis either. So the debate is again, balanced.
In FY'22 it put back ~58% of earnings into the business, but this hasn't continued this year. Instead, it has focused on freeing up cash flow, leaving ~97-100% of post-tax earnings distributable to shareholders.
It's either 1) a lack of growth opportunities or 2) the company's happy with the returns it is generating now. This would be fine if the surplus cash were recycled back to shareholders via higher dividends or buybacks, or if owner earnings grew by more than 27% YoY, as they did. But it's not the case, thereby hurting the company's valuation growth, and ultimately, the capital appreciation of its owners.
Figure 7.
Valuation and conclusion
SEM is quite attractively priced at 14.6x forward earnings, 11x forward EBITDA and commands ~$3 in book value for every $1 in market value. At 14.6x forward this is a 27% discount to the sector as I write. If you're paying this you'd expect the company to be compounding its intrinsic value. A firm can do this at the function of its reinvestment rate and returns on capital deployed. For SEM, seeing as it has missed the market's return on capital, it hasn't managed to do this over an extensive period.
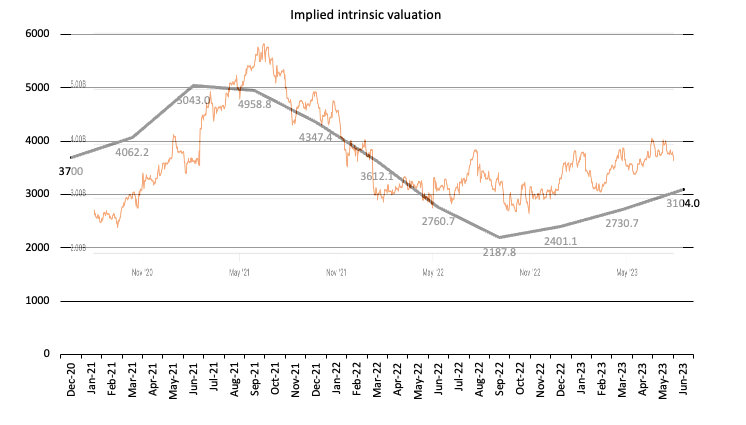
Figure 8 shows the implied intrinsic value utilizing this calculus. I've observed that the company is trading above the line of implied value, but has deserved a higher bid off its FY'22 lows. Note, SEM's pricing woes started before the FY'22 market, thus largely unrelated to the rates/inflation story. Instead, the choice to divest at lower rates of capital return eroded value across this time [Figure 7] and the market's reactions reflect this. Consequently:
- I do not believe SEM is undervalued;
- But I do believe the 27% discount to the sector may be warranted.
Figure 8.
Note: The orange market cap line is retrieved from Seeking Alpha. and superimposed over the implied valuation line. Hence the slightly faded image. (Data: Author. Market cap line retrieved from Seeking Alpha )
In short, with a lack of identifiable catalysts, thin returns on capital, and a series of economic losses, this balances the company's financial performance and warrants a hold rating in my view. The company continues its growth strategy of adding new hospitals/facilities and driving income from these. Still, it now has a $6.1Bn capital charge returning ~6-8% in trailing returns on a sequential basis. I can't see SEM compounding value for shareholders on these economic characteristics. Net-net, reiterate hold.
Appendix 1.
For further details see:
Select Medical: Capital Charge Now $6.1Bn At C.6% Trailing Returns, Reiterate Hold