SEM - Select Medical: Market Expectations Appear Well Justified With Technical And Economic Factors
2023-10-25 16:00:00 ET
Summary
- Healthcare providers, including Select Medical Holdings, have seen a contraction in multiples due to tighter financial conditions and a cooling equity market.
- Select Medical Holdings has received accolades for its rehabilitation hospitals, but this has not translated into a compounding investment return.
- A high degree of risk is currently priced into the stock, and soft economic value drivers suggest that SEM may not outpace market expectations.
Investment update
Tighter financial conditions, a cooling equity market, and a lower risk appetite have contracted the multiples of healthcare providers in H2 '23. Healthcare facilities in particular have faced the brunt of this selloff. Following my August publication , Select Medical Holdings ( SEM ) has sold off ~19% to the downside as a clear indication of this sentiment.
In terms of service providers, SEM sits near the tip of the spear, receiving various accolades for its rehabilitation hospitals-for the 3rd year running, "10 of its inpatient rehabilitation hospitals in 18 locations have been named to Newsweek's 2023 list of America's Best Physical Rehab Centers" , as per an August announcement . But consilient investors know a great company doesn't always transpose into a compounding investment return.
In that vein, the following factors are immediately relevant:
(i). SEM is set to report its Q3 numbers next week, and an honest appraisal of what the market expects vs. what the company could produce is warranted,
(ii). There is presently a relatively high degree of risk priced into SEM's market values, with investors demanding a high rate of return to buy the stock today,
(iii). The company's economic value is yet to be seen, with a capital-hungry growth model producing modest rates of earnings growth/return-this is a low margin, low capital turnover business,
(iv). Technicals are equally unsupportive of a repricing heading into the company's earnings, and a large effort from buyers/demand is needed to change the technical picture.
Collectively, there is insufficient evidence in my value paradigm to suggest SEM could outpace market expectations, even with an outstanding set of Q3 numbers. This report will lay out the case leading into this event, explaining 1) what's changed since the last report, and 2) why I reiterate SEM as a firm hold at the time being. Net-net, reiterate hold.
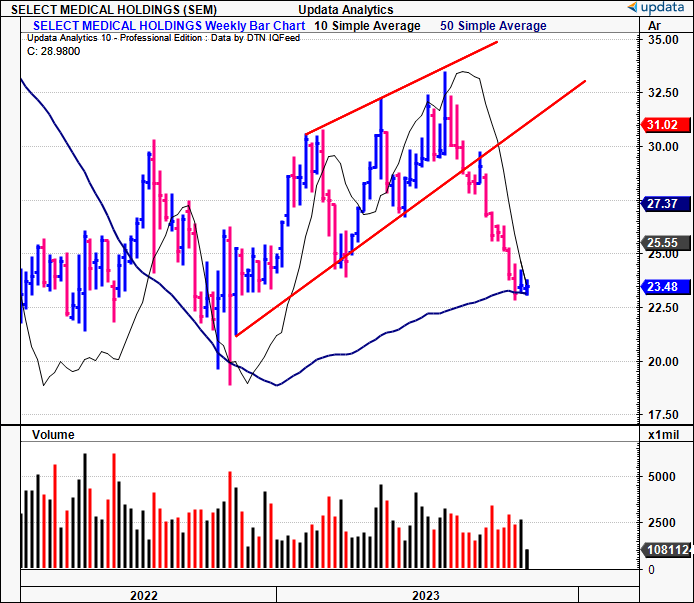
Figure 1. SEM 18-month price evolution, weekly bars, now broken lower trend line and wedged at 200DMA / 50DMA.
Critical facts pattern to reiterated hold thesis - what's changed, what hasn't.
1. Price implied expectations
Priced at c.$23.50/share and trading at an 11.83x forward earnings multiple implies the market expects $1.98/share in forward earnings, >60% YoY growth. Given the firm's heavy debt load-$5.05Bn in total-it sells at an EV of $8.11Bn. Trading at 14.3x forward EBIT shows the market expects $567mm in pre-tax earnings and $6.6Bn in sales under the same convention. This calls for 39% and 4.2% YoY growth, respectively.
Consensus earnings estimates from FY'23-'25 also average 33% growth, which I've carried out to FY'28.
In addition:
(1). SEM is priced at 1.3x EV/invested capital, on a trailing rate of 6.3% on capital deployed (discussed later). Investors have an implied ROIC of 4.7% forward on this (1/(1.3x6.3%) = 4.7%).
(2). This implies an expected reinvestment rate of 12% of pre-tax earnings or ~$70mm to additional growth investment (RI = ROIC/g),
(3). It would therefore expect SEM to compound its intrinsic value at a rate of 0.57% going forward, taking the function of its implied ROIC and reinvestment rate (ROICxRI).
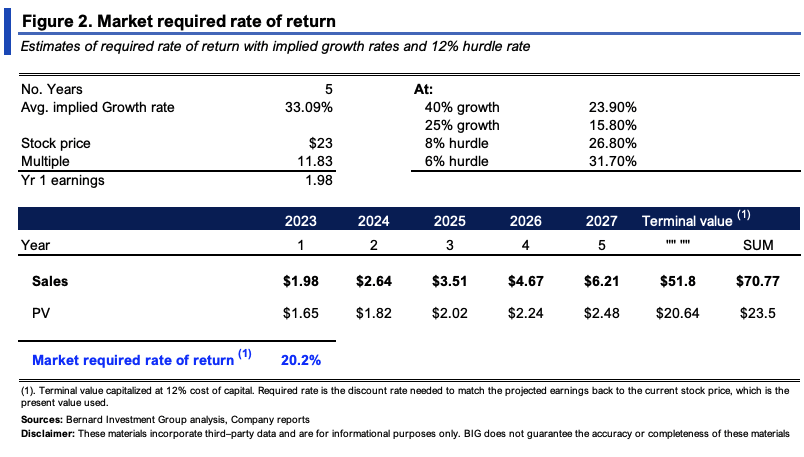
(4). Based on these stipulations, the market has commanded a 20% rate of return, ranging from 16% to 31.7% under various scenarios posted in Figure 2.
This is a reasonably high amount of risk priced into SEM's equity stock, with the 20% required rate needed to compensate for the list of potential risk factors.
2. Economic value drivers
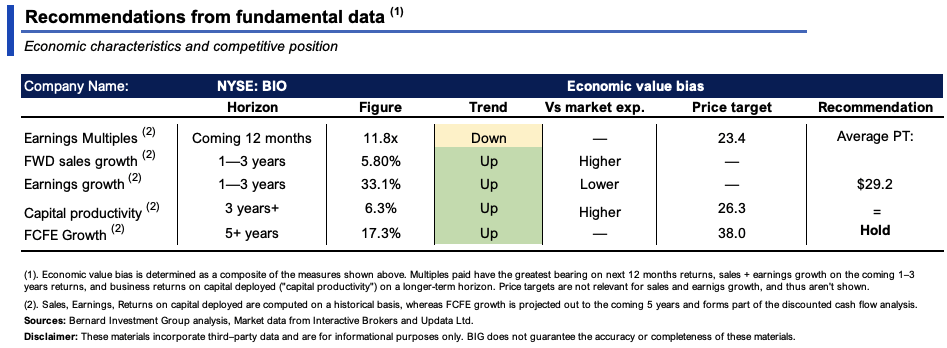
SEM's competitive position is not well supported by robust economic characteristics. In that vein, its economic value bias is tilted towards a hold, as seen via the composite of factors in Figure 3a.
Figure 3a.
I would point to several critical insights in support of this notion, each painting a challenging economic hurdle for SEM to overcome to attract my buy rating.
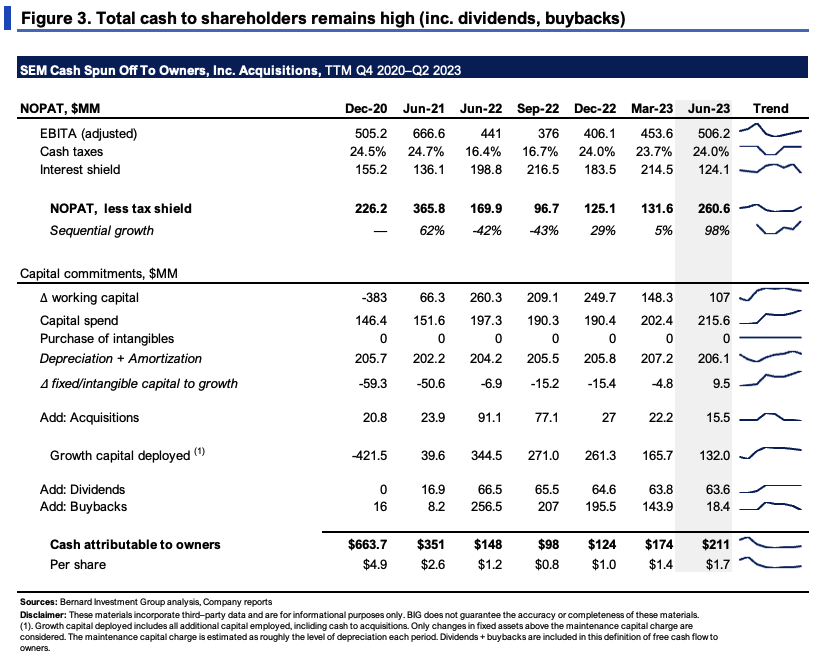
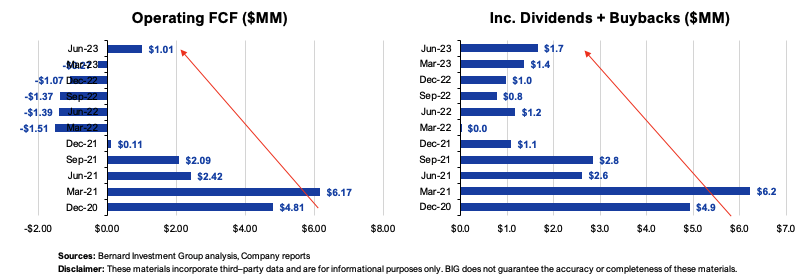
One, the company is in fact deploying growth capital, as seen in Figure 3. Only that capital spend above the level of maintenance investment-approximated at the rolling depreciation + amortization level-is considered 'growth' investment. Net of tax and interest expense, the firm's operating income has been ratcheting higher since Q3 last year (TTM basis).
Factoring all buybacks and dividends paid up, the cash it has spun off to its owners hasn't grown since 2020, instead compressing to $1.70/share in the TTM.
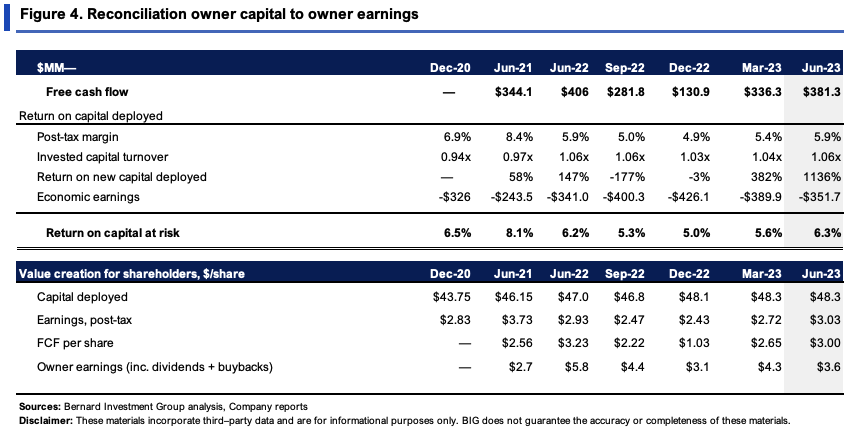
Two, SEM's is a capital-intensive, low profit margin business. It averages 5-6% trailing return on capital investment, with $48.3/share of capital producing just $3.03/share in trailing NOPAT last period. Post-tax margins are ~5-6% on capital turns of just 1.06x. FCF per share has lifted by ~$0.45 in the last 3 years.
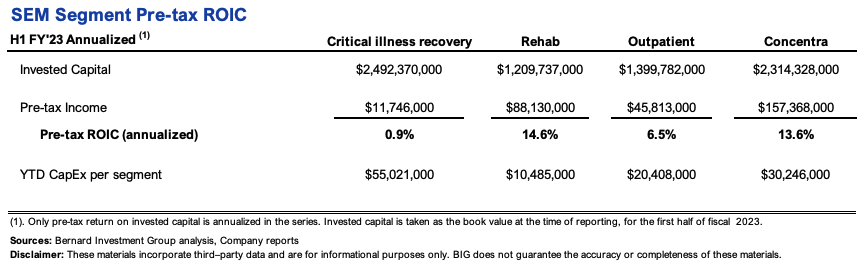
Three, the rehab hospital and Concentra are the company's most profitable segments, producing 14.6% and 13.6% annualized ROIC at H1 '23 respectively (Figure 4a). Yet, the company has collectively ploughed most of its YTD CapEx into its critical illness recovery and outpatient divisions, ~$75mm by the end of H1.
So it is investing most of its surplus capital into low-return business segments, when in my opinion, it should be putting this to work in rehab and Concentra. Does it have the opportunity to do so, would be the next question. I'll be watching for this very closely in the company's Q3 numbers.
Figure 4a.
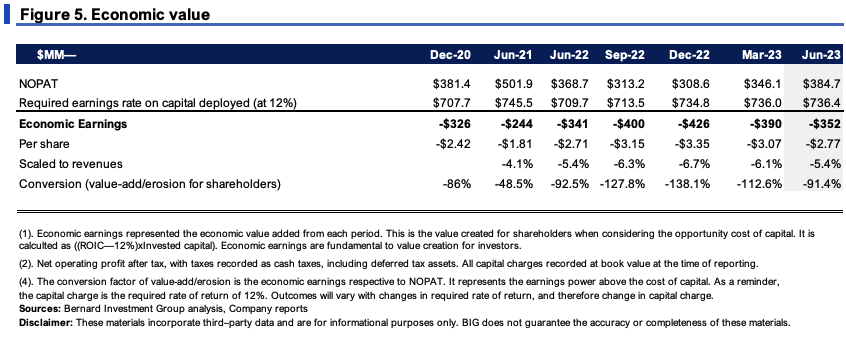
Four, in that vein, carrying the c.$6.2Bn of capital invested forward, it would need to produce $736mm in NOPAT in FY'23 to meet our internal 12% required rate of return. In contrast, the market expects it to do $567mm pre-tax. Management also guided to $615mm pre-tax for FY'23 as well, and this tells me it likely won't create economic value above our threshold margin going forward.
3. Technicals unsupportive leading into earnings
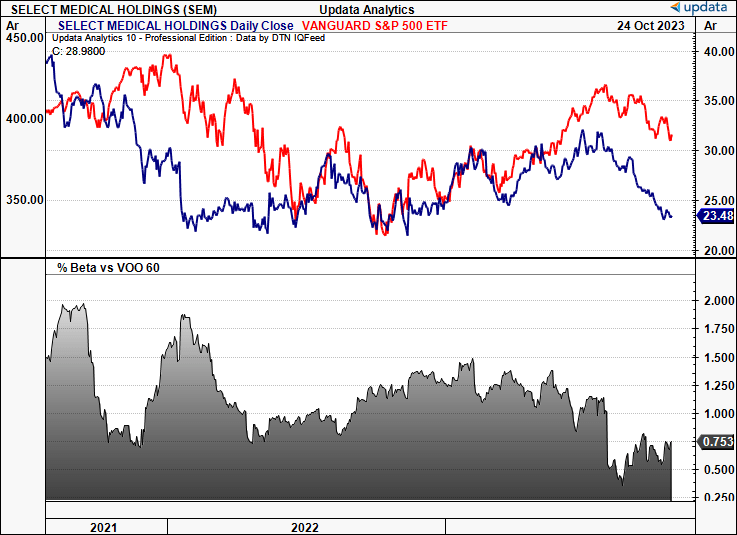
There has been a clear change in the technical picture for SEM since the August publication. Figures 6 and 7 depict critical technical insights based on daily and weekly time frames, looking out to the coming weeks and months respectively. A review of the company's stock performance vs. the U.S. equity benchmark is seen in Figure 6.
Figure 6.
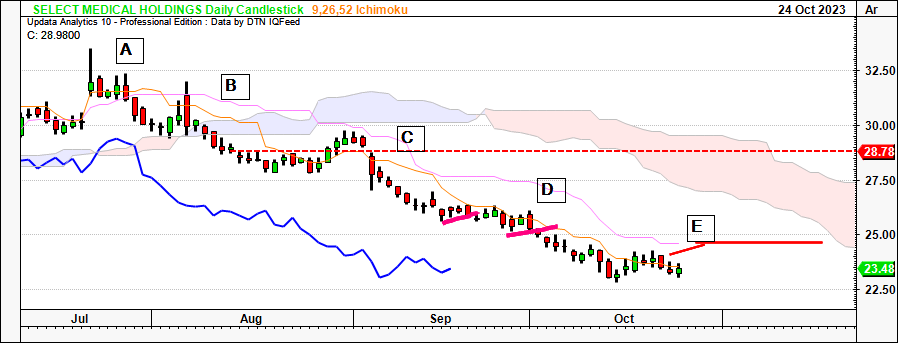
Looking to the daily cloud chart in Figure 7:
- At point A, we had a large gap up, with an evening star formation in the subsequent candles. Here, demand pushed the level above $33 but was rejected, and the 3rd candle was a bearish engulfing one that was a clear reversal.
- Point B was another bearish engulfing candle that saw another short-term reversal, continuing the downtrend. The price and lagging lines then crossed the base of the cloud, confirming this signal.
- At point C buyers made an attempt to rally back to the cloud, but were rejected 2x at the cloud base. SEM then gapped down, and there was insufficient demand to close this gap.
- Points D and E are 2 continuation patterns that resulted in a further gap down with no demand to fill these levels. Finally, point E, which occurred last week, saw a dark cloud formation which was again another key reversal that brought prices further south.
Figure 7. Daily cloud chart
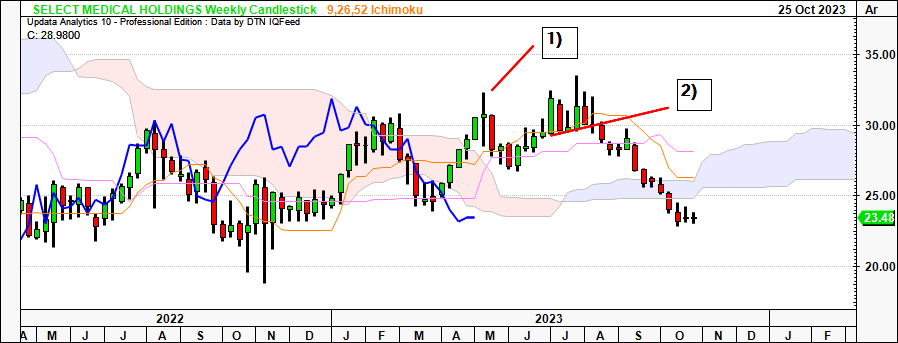
Looking to the weekly cloud chart in Figure 8:
- SEM crossed back above the cloud back in April/May, but rally was short-lived, with a large evening star at point 1) which saw a large reversal. This is where a bullish candle is followed by a small candle with a large wick, then a large bearish candle confirming the reversal.
- After an attempted recovery the stock then broke the key support level at 2), and hasn't managed to fill this level. Instead, it's been all downside in the weeks since June.
Figure 8. Weekly cloud chart
Valuation and conclusion
As mentioned earlier, the stock sells at 11.8x forward earnings, whilst being priced at 14.3x forward EBIT and 1.2x EV/invested capital. The former two multiples are discounts of 34.5% and 8.6% to the sector respectively.
Question - are these discounts an opportunity? Or, are they warranted given the current state of affairs? Let's recap what's been discussed so far:
- High risk/required return priced into SEM's equity stock at current levels,
- Flat return on capital invested into the business, nil growth in cash thrown off to shareholders, no economic earnings,
- Investing the bulk of its surplus capital into low-return business segments,
- Technicals telling a story of further downside potential,
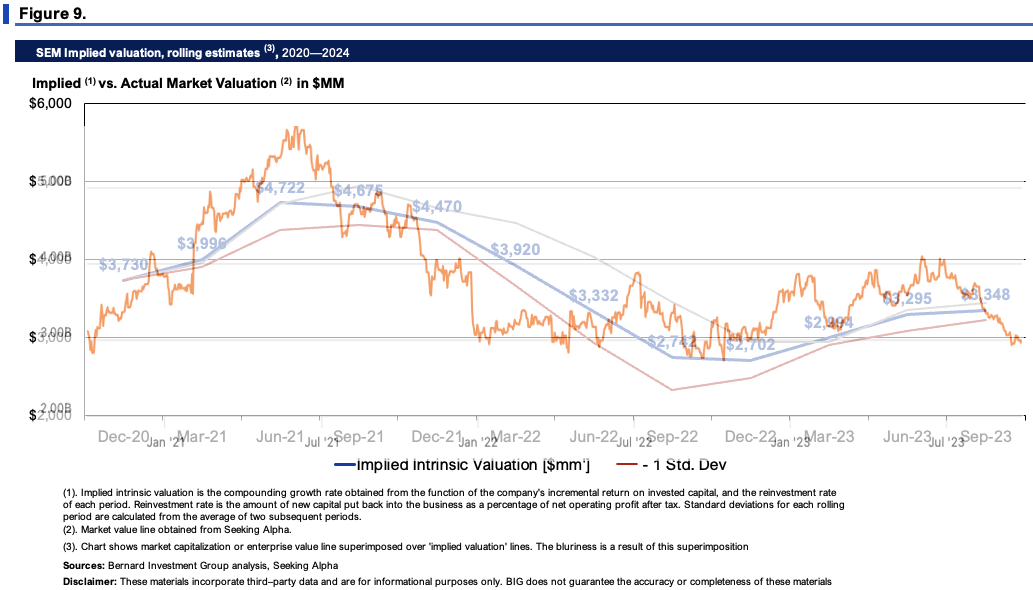
Added to this, I am giving weight to the market's appraisal of SEM given the fact it appears to have been a good judge of its intrinsic value these past few years. Figure 9 illustrates this, comparing SEM's equity line vs. its implied intrinsic value, equated at the function of its ROIC and reinvestment rates. Critically, it shows the equity line snaking around this level in similar fashion.
Why would the market be different this time? In my opinion, only if (i) SEM surprises us spectacularly at its Q3 and FY'23 numbers (low probability weighting in my book), and/or (ii) the healthcare facilities industry catches an enormous bid thanks to some unforeseen catalyst (likely regulatory). Again, I place a low probability on this. In that vein, I am comfortable rating SEM at a range of $25-$29/share, negligible upside from where it trades today for the level of implied risk.
In short, there are a number of economic hurdles SEM must overcome in order to present as a more attractive valuation to more selective opportunities at this point. The combination of macroeconomic and market tensions demands higher business returns with more prospect of withstanding a storm. I haven't identified these drivers leading into the company's Q3 numbers, and place a low probability on the firm surprising to the upside when it does report in the next few weeks. In that vein, I reiterate SEM as a hold.
For further details see:
Select Medical: Market Expectations Appear Well Justified With Technical And Economic Factors