SEM - Select Medical: Revising To Hold As Business Economics Roll Lower
2023-05-26 05:31:26 ET
Summary
- Select Medical continues to consume capital in order to grow operations, clamping growth in owner earnings.
- There is not $1.17Bn in equity holding up $7.7Bn in assets, showing the multiplier from leverage.
- Economic earnings are negative on this large capital base.
- Net-net, revise down to hold.
Investment Summary
After extensive analysis of the available data, the Select Medical Holdings Corporation's ( SEM ) investment case no longer warrants a buy rating in my opinion. The firm is consuming large sums of capital to produce sub-par returns on capital after deployment. Leverage is also a concern, although is well serviced by operating income, and there's a robust interest rate hedge in place.
I had added to my SEM position 3x over the last 12-months but have decided to close the position and allocate the capital towards more selective, fruit-bearing opportunities [note: see my last 3x SEM publications here ].
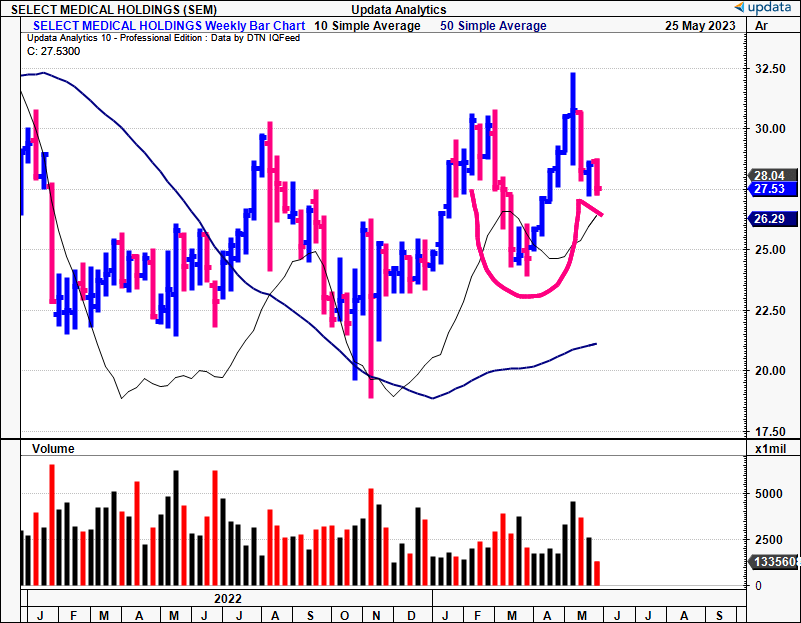
It is the lack of economic earnings that suggest SEM will have a difficult time creating value for shareholders going forward. As mentioned, this is a capital dense company with $1.17Bn in equity now holding up $7.7Bn in assets, with just 1x invested capital turnover and 5.4% post-tax margin. This are tight numbers that I hoped would improve coming out of Q1, but that hasn't been the case. Net-net, I am paring back my rating from buy to hold, and believe the current market valuation of $27-$28 per share is fair value.
This report will outlay all of the relevant factors to the revised investment thesis, with additional focus on the company's Q1 FY'23 results.
Figure 1.
Q1 Earnings Deconstruction
Looking first to the financial results, the firm booked quarterly revenue of $1.66Bn and pulled this to operating income of $151.4mm, up $49mm from Q1 last year, but still behind The Street's estimates. Total costs were flat at $1.5Bn, in an otherwise unremarkable P&L for Q1. Detailed insights follow.
I. Financial Performance
1. Leverage Situation
As you'll see here today, my eyes are drawn to the liabilities side of SEM's balance sheet as much as the firm's operating assets. For one, SEM left Q1 at 5.5x net leverage. Second, it fund's much of its growth route through acquisitions, so the talk on debt service, retirement, is extremely important in my view.
At the end of the quarter, SEM's outstanding debt stood at $3.9 Bn, comprising 1) $2.1Bn term loans, 2) $460mm in revolving loans, 3) $1.2Bn of 6.25% senior notes due 2026, and 4) c.$90mm in other long-term liabilities. At the time of writing, there is $1.17Bn in equity holding up $7.7Bn in assets, showing the multiplier from the firm's use of leverage. I'll delve into the moving parts on this in the next section. The company maintained a cash balance of $83.7mm on its balance sheet leading into Q2. To that note, interest expense in Q1 amounted to $48.6mm, up from $35mm in Q1 last year, caused by the lift in 1-month LIBOR rates (moving to SOFR), and SEM increasing the liability under its revolving credit facility. Notably, the company's rate exposure is hedged at 1% LIBOR +250bps until FY'24, giving $2Bn in term loans a ceiling.
Insights:
-
The earnings contribution from SEM's unconsolidated joint ventures was a major factor in Q1. Equity and earnings of unconsolidated subsidiaries (located below operating income on the firm's P&L, as non-operating income) amounted to $8.6mm. This is 10% of reported earnings. In my view, this is evidence of management's value-add - you've got SEM adding another 1000bps in earnings from its strategic partnerships, with no ongoing costs, and this shouldn't be discounted. In the same breath, earnings to the firm's non-controlling interests took $14.5mm from SEM's net income.
-
As mentioned above, the interest rate cap is an effective hedge to interest rate risk. Given that $2Bn is capped you can be more confident SEM will have it under control going forward. This is important, as the breadth in opinion on the Fed's next rate moves suggests this will be a continued, known risk.
-
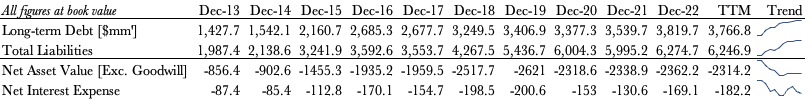
Adding to the debt talk, I'd point out a couple of positives that indicate this is actually reasonable capital budgeting (for the business, not so much for the investor). For one, SEM has a diversified debt structure and cash position, with interest-bearing liabilities spread across 4 instruments, each with their own pricing, rates differential and risks. You can see the firm's total long-term debt and total liabilities in Figure 2. Here, I took a long-term approach to show the firm's scaling of leverage over time. In 2013, long-term debt was $1.4Bn on ~$2Bn in liabilities. Looking to the TTM, debt is $3.76Bn, bringing total liabilities to $6.2Bn. The trends are shown on the far right. In one view, this does present a slight issue - the firm's net asset value is negative $2.3Bn, when excluding goodwill of c.$3.5Bn. Nevertheless, it is promising to see the transfer of wealth made through acquisitions (goodwill) circling back to cash flow and profitability.
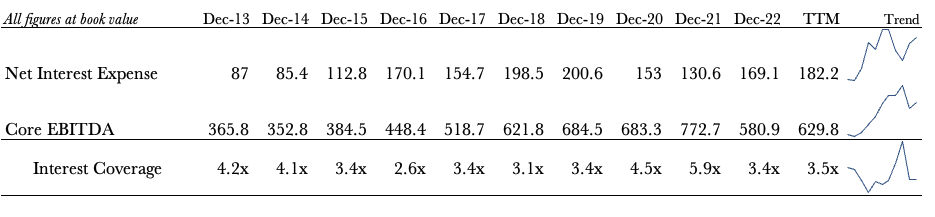
- You can see this recycling clearly in Figure 3, showing the company's interest coverage from 2013-TTM. The annual core EBITDA is divided by the interest expense to show the times-interest-earned each period. In 2022, the coverage was 3.4x, and has lifted to 3.5x in the TTM. These are very healthy numbers and imply the firm has ample cash flow to service its debt load, quashing any concern in my mind there's a risk with the company's capital structure in my opinion.
Figure 2.
Figure 3.
2. Divisional Highlights
Looking to segment performance, it was a fairly mixed contribution from both divisions. Total segment revenue missed consensus estimates by ~$50mm as mentioned, not a small miss. The critical illness recovery hospital ("CIRH") division reported a 1% decrease in net revenue, driven by downsides to both volume (demand) and rate (price).
Meanwhile, the inpatient rehabilitation hospital ("IRH") division came in with a 5% increase in net revenue, driven by a 400bps Yoy growth in both patient volumes and rate per patient.
Insights:
- in CIRH, occupancy trends are thankfully normalizing and this offset pressures in the CIRH business. Occupancy was up 100bps from 71%-72% to demonstrate this. Perhaps the big standout for me was the additional c.7 points in quarterly adj. EBITDA margin, as labour headwinds (shortages, costs, competition, etc.) finally settled, a very good sign as labour has been plaguing hospital margins in 2022/'23. Specifically, it clipped 13% adj. EBITDA margin, up from 6% the year prior as evidence of this. This could be a tailwind to relative performance in 2023 in my opinion.
- The 5% jump in IRH turnover was driven by a 400bps YoY growth in both patient volumes and rate/patient, so an demand and price in my opinion. This is a key insight because it highlights one investment benefit of service-based healthcare, in that providers have acute control over price increases and increasing volumes to raise turnover, unlike those booking product revenue. Management were happy with occupancy rates and margin here as well.
- Both divisions experienced positive labour-related changes. On the front of it, this includes reductions in agency costs, pulling through to the margin. Value-minded investors should take note of these marginal improvements in my view. You're looking potential operational efficiency which could translate to earnings growth if done well.
Collectively, fairly mute performance from both segments in my opinion. There's little to be garnered on the growth front,
II. Investment, Capital Allocation Performance
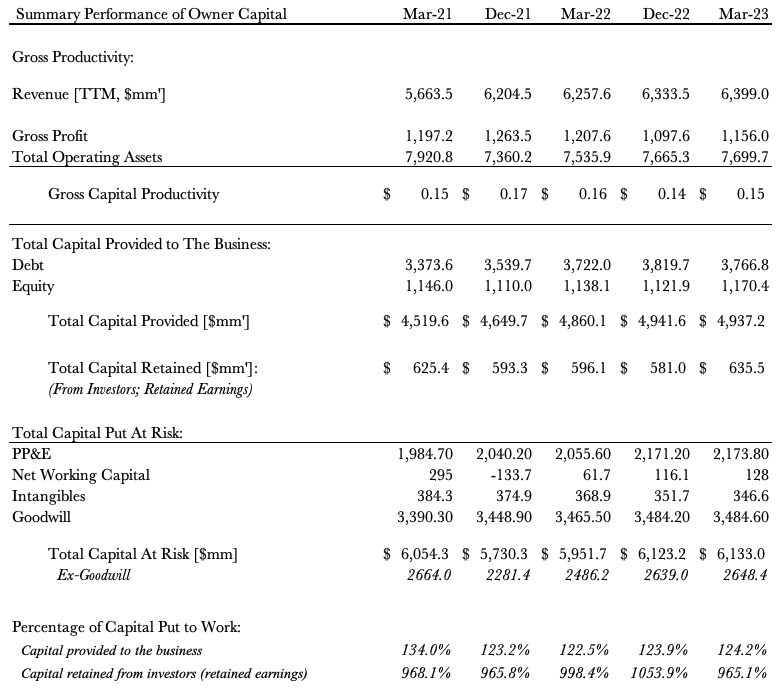
A thoughtful analysis of SEM's profitability and value-creation engine are in order following analysis of the capital structure and financial results. Figure 4 and Figure 5 reconcile the company's financial performance into performance of the firm's capital, going back to 2020 in rolling TTM periods. Being that the company is a conduit between its investors (owners) and the business' operating capital, the summary therefore represents the performance of the owner's capital.
1. Capital Provided By Investors
The total capital provided by investors (debt, equity) has ballooned from $2.2Bn in 2013 to $4.9Bn in Q1 2023. Bulk of this is debt, as discussed. Meanwhile, the company has retained $635mm in earnings. Importantly, the company has invested the entire portion of capital it's been provided into productive assets. Importantly, it has invested more than the capital provided - 24% more in Q1, exactly. It has put $6.1Bn at risk, versus $4.9Bn provided. This tells me the company has reinvested $1.2Bn of its own capital into future growth, on top of what's been provided.
Insights:
- Despite the large sum of capital SEM has put at risk, including $7.7Bn in total operating assets, it is only circling back $0.15-$0.17 on the dollar from this base.
- This is measured by the gross capital productivity shown below, calculated as the trailing gross profit scaled by total assets each quarter. I say only circling back 15%, as if $1.15Bn in gross return from assets is nothing spectacular. The real spectacle is that it consumed $7.7Bn in capital to produce the $1.15Bn, a 6.7x cost to return (7.7/1.15 = 6.7).
Figure 4.
Note: The company's stock repurchases or dividend payout is not included within this analysis. There is no meaningful change to the results with its inclusion. (Data: Author, SEM 10-K's)
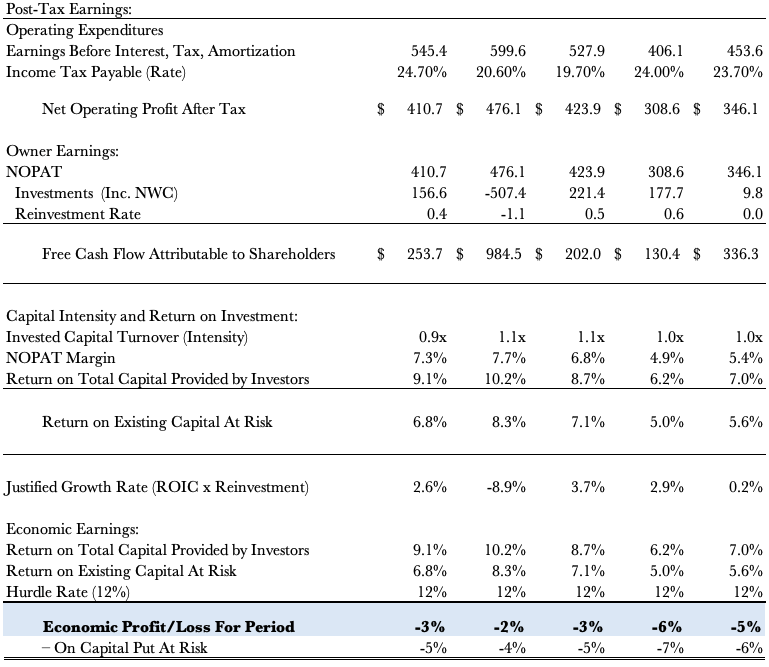
2. Post-Tax Earnings
Considering the enormous sums of capital at risk, you'd expect reasonable profit contributions from the same. Figure 5 shows the owner earnings and return on existing capital SEM has produced over the testing period. The free cash to shareholders its obtained from the net operating profit after tax less investments made, less capital required to reinvest for growth (Owner Earnings = NOPAT-investments-additional reinvestment).
Insights:
- Despite a $79mm additional investment across Q1 FY'21-'23, there's been no corresponding profit growth. Post-tax earnings decreased $64mm over the same time, a negative 81% return on incremental capital (TTM figures).
- The firm has spun off reasonable amounts of free cash flow, but there's been no sustained growth on this. This would be acceptable if the return on SEM's investments was exceptionally high, however, it isn't.
- The return on existing capital has routinely hovered at 5-7%, well below the 12% required rate of return listed here. Subsequently, the economic earnings, the return produced on the capital SEM has put at risk, are also routinely negative. A company will not create value for its shareholders unless its capital produces returns above the benchmark rate. Investors need a factor to measure the value of capital, and if SEM isn't meeting the 10-12% threshold on the investments it makes, this explains the sluggish price action observed in recent weeks.
- Whilst these are historical data, their findings are telling for the future. I do not anticipate a rapid turnaround in the economic characteristics of the business. For me to add more to my SEM position, only for the company to generate negative 3-5% spread below the hurdle rate on the capital it has been provided, is not an acceptable value proposition in my investment township. The picture is even worse when looking at the capital SEM has invested. As mentioned, going forward, my estimate is these trends to continue in the medium-term.
Figure 5.
III. Valuation
You might find SEM attractively priced at 14-15x forward earnings, a 24% discount to the sector, and in-line with the company's 5-year average. It is also priced at 3x book value, which is quite the ask, and makes the 15% trailing ROE far less attractive at 5% for the investor if paying that multiple.
At the current market cap of $3.5Bn, the market expects $420mm in post-tax earnings at a 12% discount rate, getting you to the 3.5 (420/0.12 = $3,500). At the trailing NOPAT of $346mm, this calls for 3.5% CAGR into FY'28, nothing to ride home about.
My numbers call for $351mm in FY'23 NOPAT, and thus are behind consensus estimates of $358mm, suggesting the market may have the company's market price correct at the time being. This supports a hold rating, and tells me there are likely more selective opportunities creating value elsewhere.
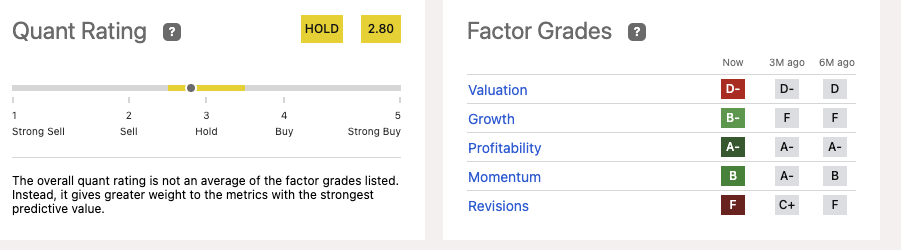
This neutral view is supported by the hold rating given by the quant grading system. The objective nature of this system adds confidence to my valuation thesis, especially given the company falls short on valuation grounds (and thus, value-creation grounds) in scope with my own findings.
Figure 6.
In short
To sum it up swiftly, the economic characteristics of SEM's business have my investment cortex firing in all of the wrong directions. Chief to the debate, is the sub-par returns on capital SEM has been provided. It hasn't recycled this into additional profit growth, no surprise as to why this hasn't transposed over to growth in market valuation. In that vein, there is robust fundamental evidence to suggest SEM is best rated a hold at the time being, and I am revising my position from buy to hold to reflect this.
For further details see:
Select Medical: Revising To Hold As Business Economics Roll Lower