QQQ - Sentiment Update: The 'Puts To Calls' Ratio Gives A Strong Buy Signal
2023-09-04 04:00:06 ET
Summary
- Investor emotion drives 50% or more of a stock's price move, so it’s vital to measure and know what investors think and feel.
- Current sentiment metrics strongly point to a continuation of this bull market. We don’t think investors have to worry until the MSI gets closer to the red zone.
- It's important to note that “put” buying, in absolute terms, is near all-time highs. This is strong, added confirmation that this bull market has higher to go.
We update indicators of investor sentiment every two weeks. Before we review the strong "puts to calls" buy signal, we’re first going to update all the major sentiment indicators. If you want this type information on a regular basis, please select to follow us.
The Short-Term Master Sentiment Indicator
By putting numerous sentiment indicators together in a mathematically consistent way, we’ve created two master sentiment indicators – one long term, the other shorter term.
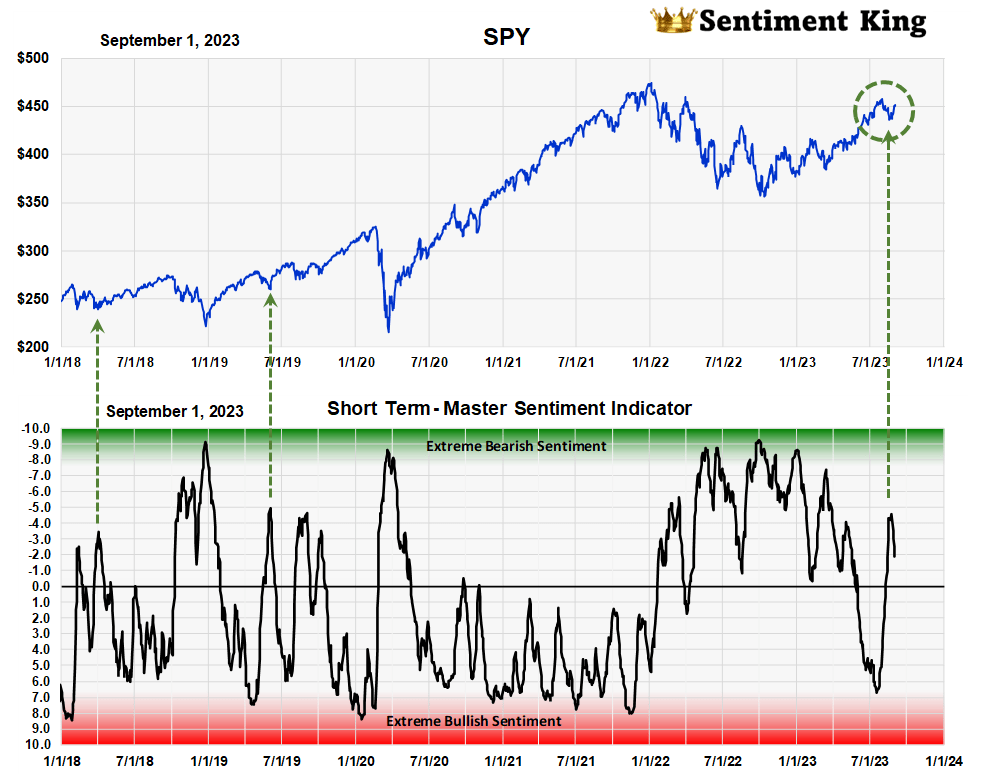
This graph plots the short-term master sentiment indicator. It's made by combining seven indicators and measures investor expectations over the short to intermediate term. It's updated daily.
Short Term Master Sentiment Indicator (Sentiment King)
An earlier article explains our ranking scale and, as you can see, this sentiment indicator is on the green or bearish side of neutral. This is positive since it indicates that during the short, three week correction too many investors switched to the bearish side. This strongly supports the idea that prices are about to move even higher.
The Long-Term Master Sentiment Indicator
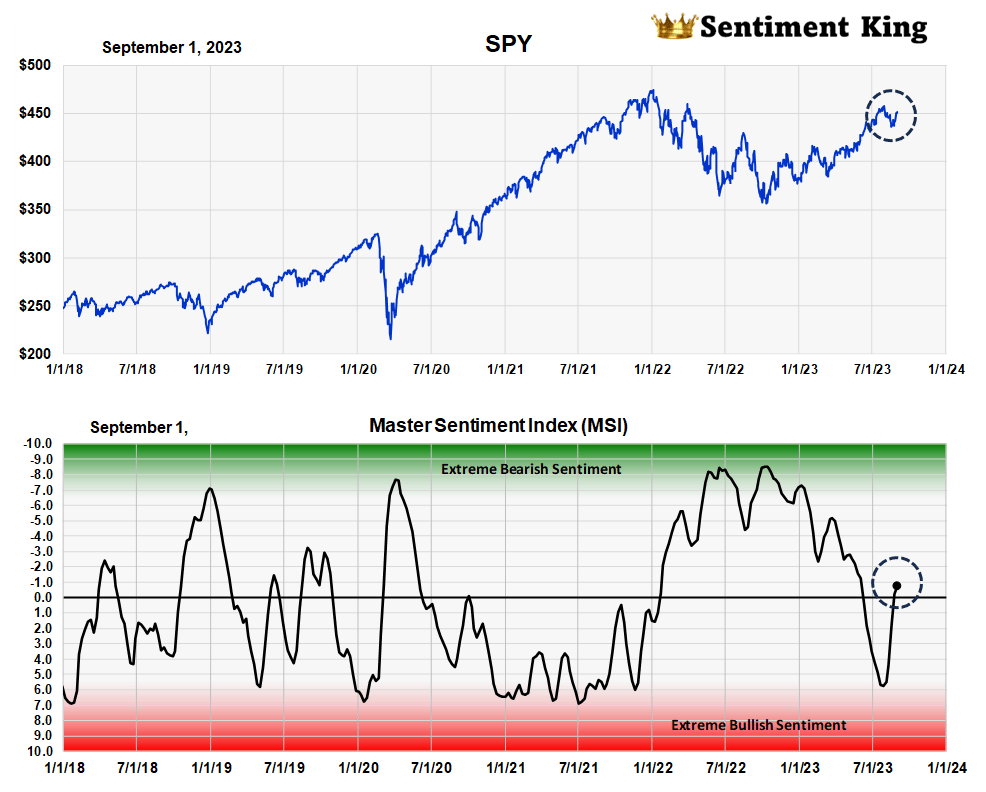
The next chart is the long-term Master Sentiment Indicator. It’s made by combining nine indicators into one and is recalculated every week. It’s used to forecast bull or bear markets.
The Master Sentiment Indicator (Sentiment King)
The chart shows that sentiment expectations for the long term (black circle) are also on the green or bearish side of neutral. This is very bullish for a continuation of the bull market. Investors shouldn't worry about a major decline until this indicator gets closer to the red zone again. As long as unexpected global events don’t disturb the situation, this bull market has higher to go.
Now let's see what the individual sentiment indicators that make up these master indicators are saying. We put them in two categories - those based on surveys, and those based on group buying and selling.
Investor Surveys and Opinions
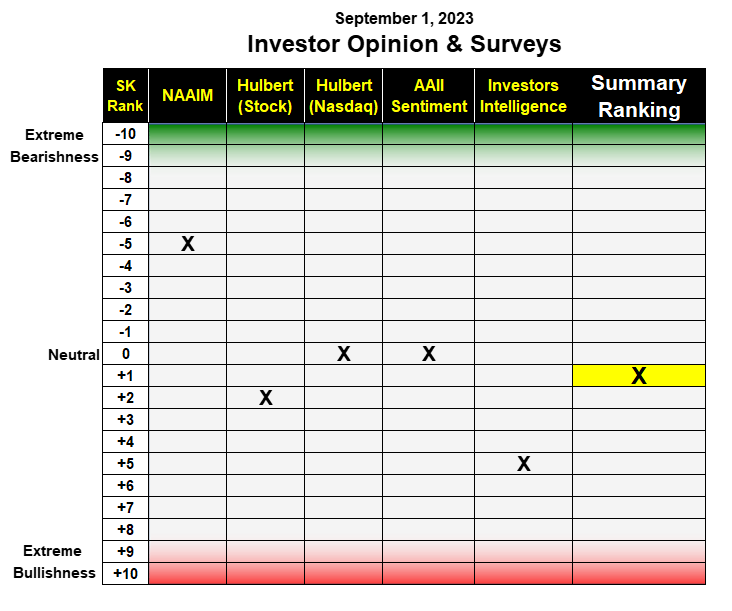
We monitor five surveys on the bullish or bearish thoughts and opinions of investors and advisors. As you can see from the table, two are neutral, two are somewhat bullish while one is somewhat bearish. The combination is effectively neutral. An explanation of each survey is contained in the text below the table.
Table of Investment Surveys and Opinions (The Sentiment King)
NAAIM Exposure Index : The American Association of Active Investment Managers (NAAIM) has an average investment position of 61%, which puts its four week moving average at minus 5 on our scale. This is a somewhat bearish position from Active Money Managers.
Hulbert Surveys: Using our ranking scale, the two Hulbert surveys of newsletter writers – one for the general stock market, and the other the Nasdaq. Together they're positioned slightly to the bullish side of neutral.
AAII Member Sentiment Survey: Last week 33% of AAII members were bullish while 34% percent were bearish. We do a moving average on these weekly numbers and the Sentiment King ranking of this average is completely neutral.
Investors Intelligence Newsletter Survey: Last week, 43% of newsletter writers were bullish, 21% bearish and 36% expecting a correction. This is the oldest investor survey there is, with a history back to 1963. Our ranking of this indicator is currently +5. This locates it half way between neutral and extremely bullish.
Summary of the Opinions and Surveys : The combined ranking of all the surveys is +1 and is shown by the yellow highlighted X.
What Investor Buying and Selling Indicators Are Saying
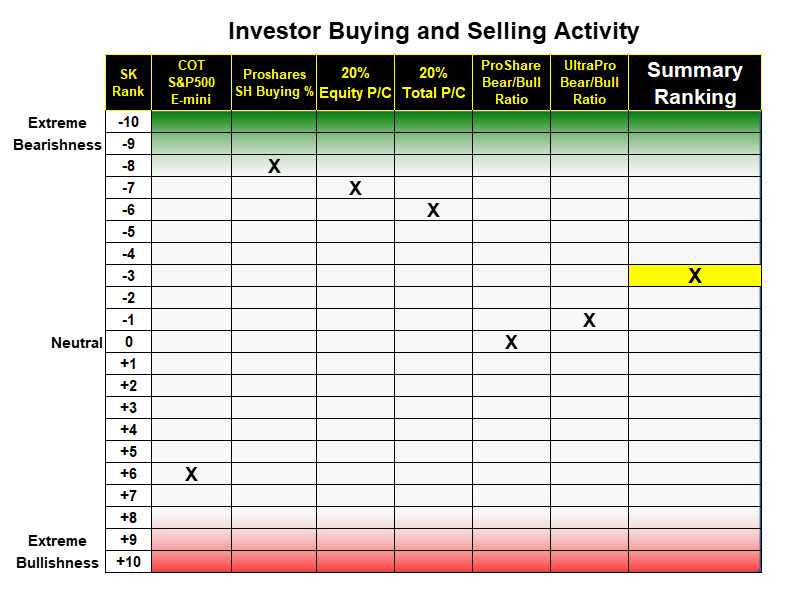
This table shows the six metrics that measure what investors are buying and selling. Remember these indicators work in a contrary way. The markets are considered bullish when investor activity becomes too bearish, and vice versa.
Table of Investor Buying and Selling Activity (The Sentiment King)
S&P 500 E-mini COT – The commitment of trader’s data for the S&P 500 E-mini futures is ranked at +6. This is because of low short selling by asset managers. This is one step closer to neutral compared to two weeks ago.
ProShares Short S&P 500 fund (SH) : This indicator has just entered the green zone. Investor buying of this short fund is at 18% of assets, which is the highest levels since April. Two weeks ago it was 16% of assets. This is very positive as it shows a measurable bearish attitude toward this market. From experience, it's extremely bullish to see this degree of bearish sentiment this far into a bull market.
"Puts to Calls" Ratio: The ratio of equity "puts to calls" and total “puts to calls” are both just shy of the green zone. This is very bullish. We explain this in detail in the next section called “Indicator Focus.”
ProShares Bear/Bull Ratios: We measure investor buying of ProShares short funds compared to long funds. One measures just UltraPro funds, the other compares all the ProShares funds. Both are at a neutral ranking.
Summary of Buying and Selling Indicators - The overall score for all six indicators of investor activity is -3, which is the bearish side of neutral and the same as two weeks ago.
Indicator Focus
At each bi-weekly update, we look in detail at a particular sentiment indicator. Today’s focus is on the “puts to calls” ratio.
The Equity Puts to Calls Ratio (The Sentiment King)
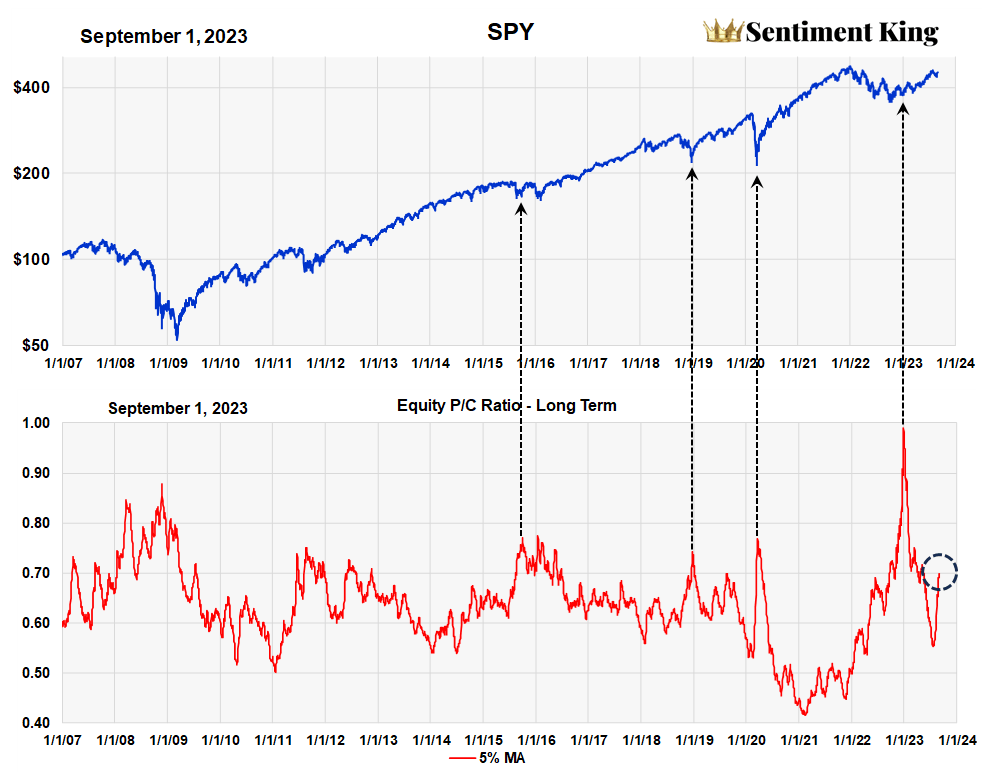
“Puts" are bets that stock prices will decline and "calls" are bets they will rise. One can learn a lot about investor expectations by comparing how many puts versus calls investors are buying. Martin Zweig, a market technician, created the puts to calls ratio back in 1971.
A high ratio means too much investor interest in "puts," which history shows is bullish for stocks. A low ratio shows little interest, which is bearish. It's the theory of contrary opinion in action.
We've drawn a black circle around the current “puts to calls” ratio, which shows the current ratio is comparable to what you get at bear market lows. From a sentiment point of view this is very, very bullish for the continuation of this bull market.
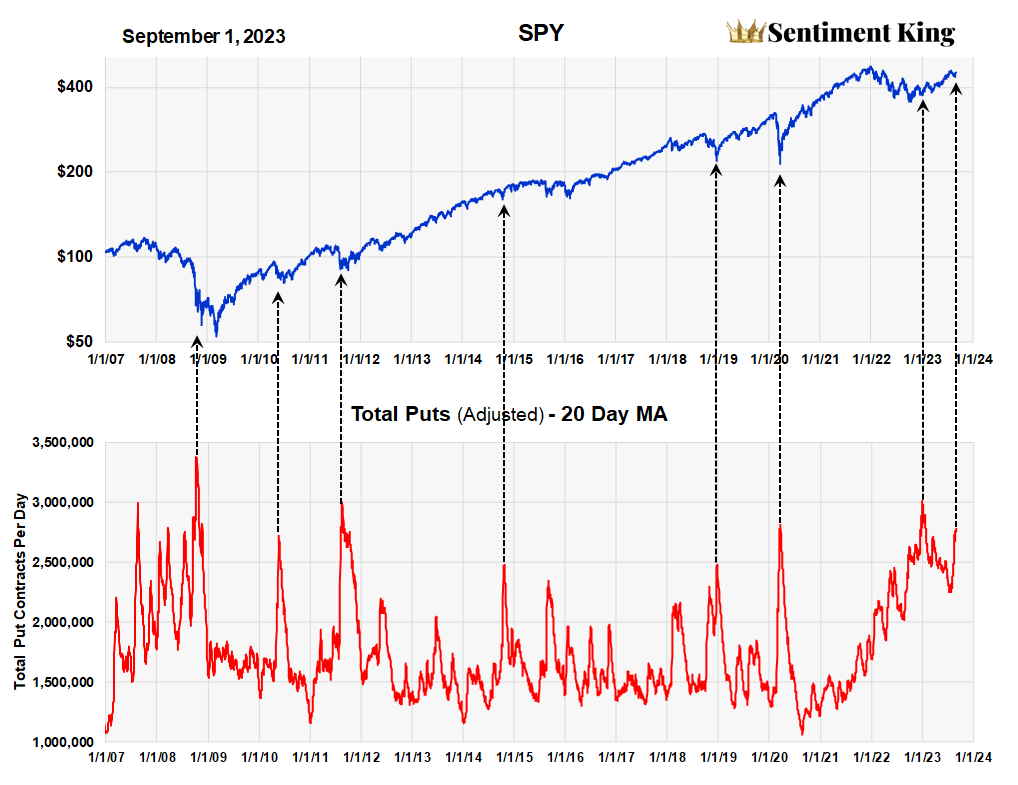
This next chart shows the average number of "put" contracts purchased each day, with past numbers adjusted for trading growth.
Total "Put" Buying Adjusted For long Term Growth (The Sentiment King)
While the classic option indicator of sentiment is the p/c ratio, we've found it beneficial to also look at the actual number of puts being purchased. That's this chart.
The current level of "put" buying is 2.76 million contracts a day and, as the graph clearly shows, that's near all time highs. This is added confirmation to the bullish scenario all the sentiment indicators are pointing to.
If you want to follow these important indicators, we update them every two weeks at Seeking Alpha, so please chose to follow us.
For further details see:
Sentiment Update: The 'Puts To Calls' Ratio Gives A Strong Buy Signal