DJIA - September Wholesale Trade Report: Red-Hot Growth
2023-11-08 13:05:12 ET
Summary
- The Wholesale Sales Report was red hot.
- Real Wholesale Sales grew at a historically fast pace in the past month and three months, driven by primarily by nondurable goods.
- The strong growth in wholesale sales seems to contradict other indications of a slowdown in the U.S. economy.
- High interest rates could cool off wholesale sales growth, and overall U.S. economic growth, in the fourth quarter.
The Monthly Wholesale Trade Report was published by the Census Bureau on November 8, 2023, at 10:00 a.m. This report provides detailed data on sales of US Merchant Wholesalers' (except manufacturers' sales branches & offices) and their inventories, during the month of September, 2023. Although the wholesale trade report is rarely discussed in the popular financial media, the most astute analysts follow it closely because it provides extremely important indicators for tracking the course of overall US economic activity. Wholesale Sales is one of eight concurrent indicators explicitly utilized by the National Bureau of Economic Research ((NBER)) Business Cycle Committee ((BCC)) in their deliberations regarding the dating of the U.S. business cycles.
In this article, we will walk our readers through an in-depth analysis of the Wholesale Sales data. We will then discuss the implications of these data for the US economy and financial asset prices.
Summary Data and Analysis
We begin our review of the Monthly Wholesale Trade Report for September with summary analytics which we highlight in Figure 1. In examining this table, we recommend that readers pay particular attention to the percent rank of Month-on-Month (MoM) growth, MoM acceleration, and the surprises relative to forecasts.
Figure 1: Change, Acceleration, Expectations, and Surprise
Summary of Wholesale Data (Census & Investor Acumen)
Change in nominal value of Wholesalers Sales accelerated from $13,176 million (2.03%) to $14,427 million (2.17%). This represents an acceleration of 0.15%. The acceleration in nominal terms was driven by Durable Goods (0.53%). Although Nondurable Goods decelerated by -0.24%, its 3.41% growth is still in the 96.3 percentile, and as we will see below, in real terms it accelerated.
The Impact of Inflation on the Value of Wholesale Goods
In this section, we highlight the impact of inflation on the interpretation of Wholesale Sales data. Price inflation impacts the quantity of goods and/or services that a given amount of money can buy. In order to track the actual quantity (as opposed to mere dollar value) of goods that wholesale merchants sell, it is necessary to adjust the nominal sales figures (reported in "current dollars") for the impact of inflation. In this particular regard, we are one of the only firms in the world that performs detailed line-item inflation-adjustment of Wholesale Sales data. In Figure 2, we show Wholesale Trade in both "current dollars" and in "real" terms. The "real" figures represent the economic value of wholesale goods sold by merchant wholesalers, after they have been adjusted for inflation in specific wholesale goods categories.
Figure 2: Wholesale Sales in Current Dollars and Adjusted for Inflation
Inflation Adjustment to Nominal Wholesale Data (Census & Investor Acumen)
As can be seen, the Real MoM growth was 1.81% versus the reported nominal growth of 2.17%. However, growth in the more economically-sensitive durable goods category was minimally impacted by inflation.
For the remainder of this article, all figures will be presented in "real" (inflation-adjusted) terms. This is important because the most important indicators of economic activity in the US economy, such as Real Gross Domestic Product and Real Gross Domestic Output, are accounted for in real-inflation adjusted terms. Read this article to learn more about the Census Bureau's Real Dollar Estimates of Wholesale Sales.
Analysis of Annualized Growth of Major Components of Real Wholesale Trade Over Various Time Periods
In this section we break down Real Wholesale Trade into major components, scrutinizing their annualized growth rates over various time frames (1m, 3m and 12m). The purpose of this analysis is two-fold. Our first purpose is to identify which components of PCE are growing at a faster or slower rate than the overall aggregates. Our second purpose is to determine whether, and to what extent, growth rates are accelerating or decelerating over various time frames.
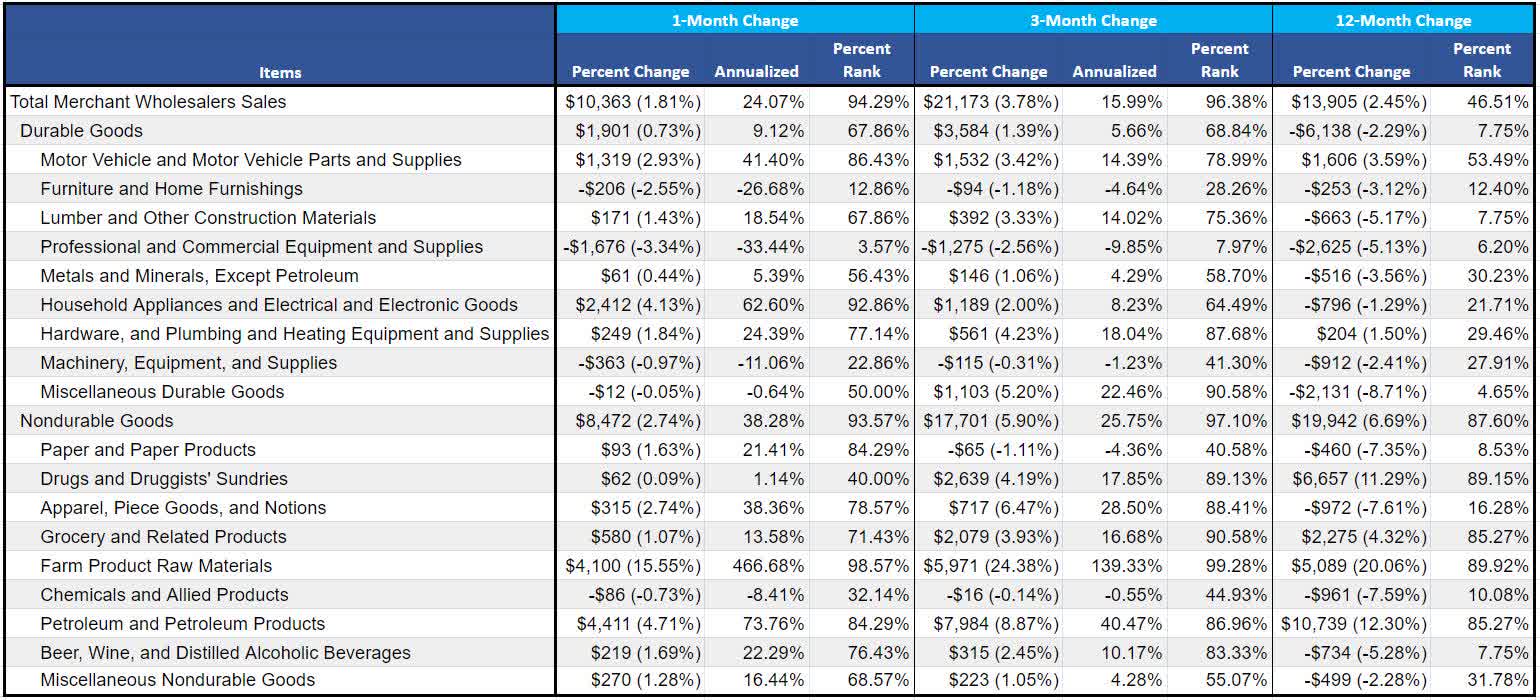
Figure 3: Annualized Growth Rates of Major Components of Real Wholesale Trade
Annualized trends in Real Wholesale Data (Census & Investor Acumen)
As can be seen, Real (inflation-adjusted) Total Merchant Wholesale Sales has been growing at a historically very fast pace in the past 1-month (94.3 percentile) and 3-month (96.4 percentile) periods, having accelerated from earlier in the year.
We now turn our attention to analysis of inter-sectoral growth. Durable Goods tend to be more "economically sensitive" (i.e. more responsive to macroeconomic developments) than sales of Nondurable Goods. Therefore, durable goods sales statistics can sometimes serve as a leading indication of tendencies and trends in the overall economy - particularly in the goods-producing sectors. In this regard, Durable Goods sales grew at a 9.12% annualized MoM pace, exhibiting significant strength (68th percentile) on a historical basis. This compares to the 38.28% MoM annualized rate of growth in the Nondurable Goods sector, which was extremely strong in historical terms (93.57th percentile). From analysis of the relative growth in these two sectors we can draw few inferences -- except to point out that the growth in the more economically sensitive sector (durables) is relatively less vigorous (albeit still historically high), while recent growth in the less economically sensitive sector (nondurables) is probably unsustainable in the medium-term.
Within the durable goods category, Household Appliances and Electrical and Electronic Goods (92.9 percentile) and Motor Vehicle and Motor Vehicle Parts and Supplies (86.4 percentile) stood out for their relative strength in September, while Professional and Commercial Equipment and Supplies (3.6 percentile) and Furniture and Home Furnishings (12.9 percentile) stood out for their relative weakness (in terms of historical percentile rank).
Within the nondurable goods category, Farm Product Raw Materials (98.6 percentile) and Petroleum and Petroleum Products (84.3 percentile) stood out for their relative strength in September, while Chemicals and Allied Products (32.1 percentile) and Drugs and Druggists' Sundries (40.0 percentile) stood out for their relative weakness (in terms of historical percentile rank).
Decomposition Analysis: Change and Acceleration of Real Wholesale Trade
In this section our analysis is focused on identifying the sectoral contributions to the MoM Change and MoM Acceleration of Real Wholesale Trade.
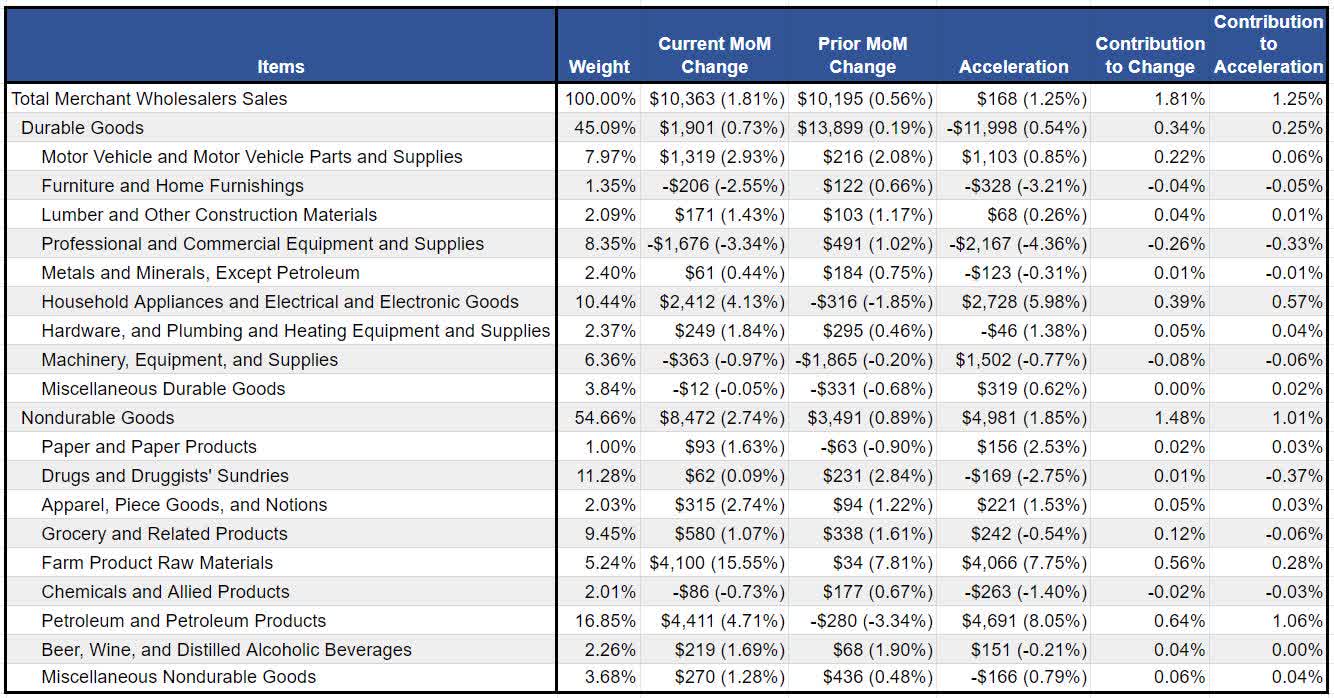
Figure 4: Contributions to Change and Acceleration Attributable to Major Components
Component Contribution to Real Wholesale Data (Census & Investor Acumen)
As can be seen from this table, total Real Merchant Wholesalers Sales accelerated from 0.56% growth the prior month to 1.81% growth in the most recent month. Decomposing this total MoM acceleration of 1.25%, we can see that the durable goods category contributed approximately 0.25% while nondurable goods contributed 1.01%.
Among the subcategories, Petroleum and Petroleum Products (1.06%), Household Appliances and Electrical and Electronic Goods (0.57%) and Farm Product Raw Materials (0.28%) were the largest positive contributors in the direction of acceleration, while the Drugs and Druggists' Sundries (-0.37), Professional and Commercial Equipment and Supplies (-0.33%) and Grocery and Related Products (-0.06%) subcategories made the largest contributions in the direction of deceleration.
Implications for the U.S. Economy
Wholesale sales is a very big part of the U.S. economy. It will probably be surprising to many to learn that the value added contribution of the Wholesale Sales sector is virtually the same as that of the Retail Sales sector, in the calculation of U.S. Gross Domestic Product and Gross Domestic Output.
This month's data on wholesale sales growth was very strong, even when adjusted for inflation. This fact flies in the face of various other indications that the rate of growth in the US economy may have been slowing in recent months. This also partially helps to explain the extremely strong growth in GDP registered during the third quarter of 2023.
It will be interesting to see if, in the fourth quarter of 2023, growth in wholesale sales cools off in response to high interest rates. Wholesale sales are primarily sales of goods, and the goods sector of the economy is sensitive to interest rates.
Implications for Financial Markets
The data in this month's Wholesale Trade report is unlikely to have a major impact on asset prices. However, the extremely "hot" growth in the wholesale sector is, on the margin, bearish for long-term bonds. Furthermore, the report this month and last month have highlighted the fact that there is some inflationary pressure in the wholesale "pipeline" which could result in upward pressure on retail consumer price inflation going forward.
Concluding Thoughts
Our outlook for the U.S. economy is that it is likely to experience a severe economic slowdown in the coming months. As a result, we are bullish on long-term Treasuries and believe long-term bond yields have begun a major downtrend that will last many months. However, in this regard, it is important to note that this particular report is not supportive of our overall outlook. Nonetheless, mixed signals from data at potential turning-points is not at all unusual. Furthermore, it should be noted that the data in this report are lagged by 15-40 days relative to other economic data that have indicated that the U.S. economy is probably slowing.
For further details see:
September Wholesale Trade Report: Red-Hot Growth