TNK - SFL Corporation: Great Company To Own At A Lower Price
Summary
- SFL has held up very well in 2022 just as trade transportation looks to weaken materially.
- Does the FedEx warning mean bad times for marine shipping?
- Does it even matter when SFL isn't listed in the correct market sector?
- One of the least understood stocks should weather the recession from an operating perspective even as misperceptions threaten the stock price.
- We booked profits by selling all our SFL today at better than $9.30 per share for NLY.PF. We rate SFL a buy at $6.50 or lower.
The shipping industry has performed well through most of the Pandemic for shareholder returns. Whether air, ground or sea, volume and demand soared. Even horrible bottlenecks at many of the world's ports couldn't back off demand.
Fed Ex's announcement that shipping volumes are dropping quickly may be the "canary in the coalmine" for a global trade recession. Threats are mounting for ship lessors.
How is SFL ( SFL ) positioned to ride this next phase of the economic cycle when it isn't even listed in the correct sector and the market doesn't understand its cash flows? Does it matter if everything in transportation gets whacked anyway?
Maybe.
But first let's clear up the misinformation:
- Because SFL started 100% servicing the oil and gas sector, it is listed as "Oil and Gas Transportation" rather than as "Marine". Today, oil tanker revenues comprise only 20% of SFL's business.
- Despite this, SFL stock still moves with energy.
- SFL has many sale leases, which run entirely through the balance sheet so that EBITDA has to be adjusted to understand true cash flows. Otherwise, SFL looks terrible.
Investment Thesis
SFL is a completely misunderstood company with solid management, strong contract revenues, and smart financing in a market about to undergo turmoil.
From a revenue perspective, SFL inflows are predominantly tied to long term charters (90% of future revenues) where lessees assume all the maintenance costs. That predictable income stream with a variety of large lessees creates greater revenue and profit certainty. The remaining 10% of the fleet is rented out pending longer term leases, disposals or trades. These volatile cash flows move with the charter/hire market.
SFL funds its ships through a combination of equity and long-term debt that is further hedged through swap transactions. From 2023 to 2026, less than 10% of debt comes due each year, reducing refinancing risk. We do not see material risk in the financing stack.
Shipping Industry
Shipping, notoriously volatile because there are long lead times to build ships, would normally expect a flood of new boats over the next 5 years after the volume surge we've experienced. That is not happening . COVID-19 uncertainty meant shipbuilders missed the volume explosion, which will turn out to be a blessing in disguise.
Despite Asian shipbuilders working to increase new ship build growth, the waning global economy is keeping ship inventory in check. Retrofits for greater energy efficiency is expected to be a growth area given the lack of new builds and the need for greater energy efficiency within existing fleets.
SFL Lessee Quality
We already see SFL has laddered its debts well and is not facing a flood of new ships coming into the market. What about credit quality among the lessees in the global recession?
SFL Lessees (SFL 2022 Q2 Investor Presentation)
This is a far stronger and more diversified list than a decade ago when Frontline and Seadrill dominated this once oil focused lessor. It's hard to fault this list which represents 90% of SFL revenues as follows:
SFL Contract Revenues (SFL 2022 Q2 Investor Presentation)
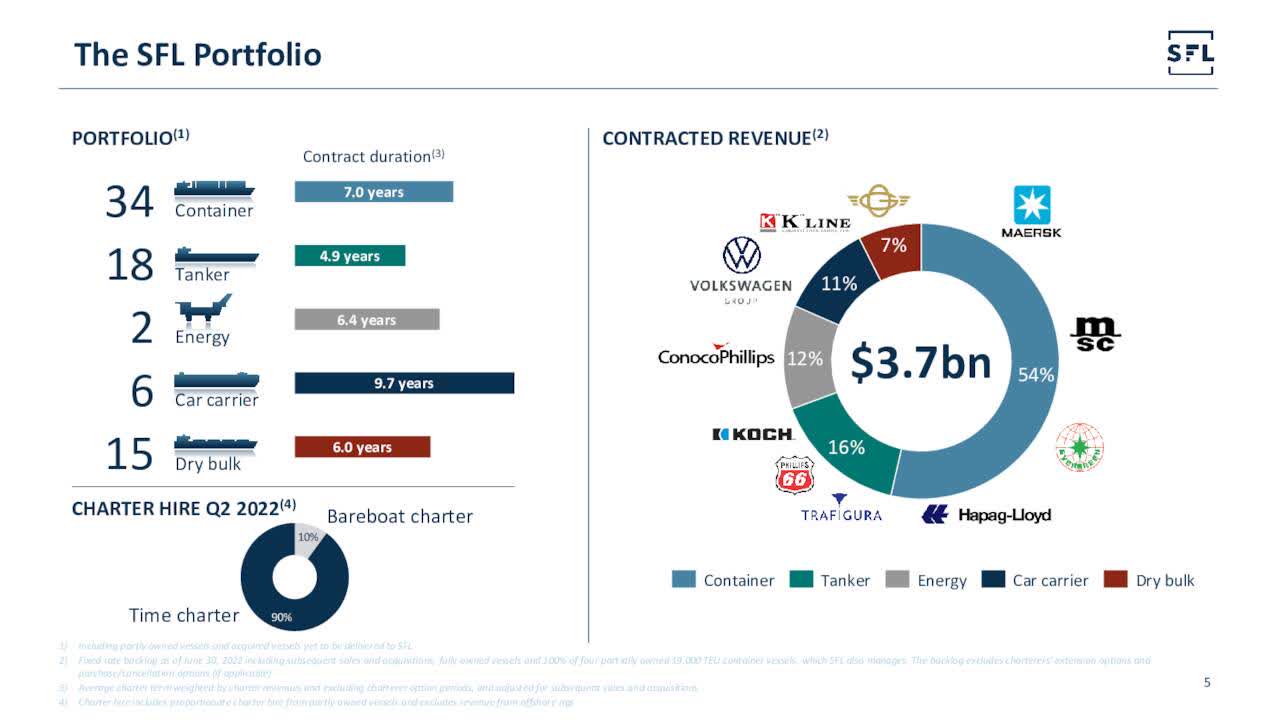
If you are looking for a stable, credit-worthy lessee list, this is competitive. Major shipping players plus large direct industrial clients really tells the SFL makeover story.
Multiple Valuation
We can see that SFL makes an interesting and very overlooked recession investment. What is its relative value to a peer group and where are the good entry points to own the stock?
To take a closer look, we have selected a peer group that represents oil and gas transportation in DHT Holdings ( DHT ) and Teekay Tankers ( TNK ) as well as container/bulk oriented competitors in Star Bulk Carriers ( SBLK ), Costamare ( CMRE ), and Golden Ocean Group ( GOGL ).
| Ticker |
| Sector |
| Yield ('TTM') |
| Payout Ratio |
| EV/ EBITDA ('TTM') |
| EBITDA Growth 3YR CAGR |
| EBITDA Margin |
| L-T Debt/ Total Capital |
| SFL |
| Container + Energy |
| 8.77% |
| 63.93% |
| 8.39x |
| 9.22% |
| 69.71% |
| 47.13% |
| DHT |
| Energy |
| 1.20 |
| -25.93 |
| 23.35 |
| -25.05 |
| 23.51 |
| 29.91 |
| TNK |
| Energy |
| 0.00 |
| 0.00 |
| 34.75 |
| -36.85 |
| 6.33 |
| 36.27 |
| SBLK |
| Container |
| 34.37 |
| 73.84 |
| 2.71 |
| 72.78 |
| 65.04 |
| 34.87 |
| CMRE |
| Container |
| 4.87 |
| 13.69 |
| 4.69 |
| 38.91 |
| 65.94 |
| 51.36 |
| GOGL |
| Container |
| 34.42 |
| 90.10 |
| 3.72 |
| 52.57 |
| 56.93 |
| 37.13 |
Source: SA
So much going on here. Numbers clearly break between energy and container/bulk shipping. We can see how SFL is somewhere betwixt and between. Let's dive deeper.
Within our Container/Bulk peers, Star Bulk and Golden Ocean operate most of their ships in addition to owning and leasing ships, which is reflected in their rich cash flows. Costamare is our most direct comparison with respect to operations.
What stands out here are the far higher EBITDA margins, payout ratios and lower enterprise value/EBITDA multiples in the container/bulk sector.
For the energy sector, we see far more challenging returns on far thinner margins.
For the ship leasing industry, an EV/EBITDA multiple is appropriate. Even though this company leases assets, tangible book value does not help us when the secondary market for ships is fairly volatile. We would need some sort of NAV estimate, which is not available to us.
Our energy sector average multiple is 29.05x while the container/bulk average multiple is 3.69x. If we weight these by SFL's product mix of 20% energy, we get a weighted multiple of 8.76x, or almost slightly higher than its price today.
But we don't feel confident with only one value measure. Let's look from a dividend income perspective to triangulate better.
Income Valuation
As we consider the payout ratios each dividend paying peer uses, we judge SFL, SBLK and CMRE to have sustainable policies going forward. DHT and TNK are not relevant since one is not paying a dividend and the other has experienced losses.
To establish some patterns, we look at the last ten years to give us some sense for predictability among SFL, SBLK and CMRE.
| Ticker |
| Revenue Growth Rate (10 yrs.) |
| EBITDA Growth Rate (10 yrs.) |
| Dividend Growth Rate (10 yrs) |
| SFL |
| 8.9% |
| 4.76% |
| -7.97% |
| SBLK |
| 32.40 |
| 40.44 |
| Started dividends in 2021 |
| CMRE |
| 7.47 |
| 8.38 |
| -8.38 |
Source: SA
None of these has a solid dividend paying track record. Two have shrunk their dividends while SBLK just started to pay after experiencing record cash flows due to the COVID-19 Pandemic. Star is also far riskier because it operates as well as owns the ships.
We will have to make a simplifying assumption that each company will continue to pay dividends at its most recent dividend rate.
To determine the appropriate discount rates, we start with current S&P 500 risk (standard deviation) from Kwanti before adjusting for each company's beta calculation (3-year trailing). Then we divide the annualized dividend rate by our adjusted discount rate for an implied share price value as follows:
| Ticker |
| Annualized Dividend |
| Current Beta |
| Adjusted Discount Rate* |
| Implied Share Price Value |
| SFL |
| $0.92 |
| 0.63 |
| 14.87% |
| $6.19 |
| SBLK |
| 6.60 |
| 1.13 |
| 26.67 |
| 24.75 |
| CMRE |
| 0.46 |
| 1.31 |
| 30.91 |
| 3.81** |
Source: SA, Kwanti and my calculations.
*Adjusted using the S&P 500 23.6% Risk rate multiplied by each company's beta calculation.
**CMRE payout is so low, we further assume 80% of accumulated cash is paid out on acquisition as a compensating adjustment.
We have somewhat different conclusions. Both SFL and CMRE appear very vulnerable to the slowing market. STAR comes out undervalued in both analyses, but its dividend policy is just too new for us to trust.
Given our belief that a steady dividend in volatile times helps to underpin stock values, we lean toward the Income Valuation conclusion that SFL has farther to fall.
Conclusions
First, we love SFL as a company. Management is great, the tax haven status is efficient and we have held the stock off and on since 2006.
However, interest rates are going up just as shipping line (lessee) and global recession risk have increased. When we look at SFL on an adjusted Enterprise Value to EBITDA basis, SFL looks slightly undervalued. When we attempt to look from an adjusted dividend discount perspective, we see SFL has more downside exposure.
Adding to this, the market wrongly treats SFL as though it is in the energy transport sector (only 20% of its business comes from this sector today) and fails to understand its sale lease structure where the bulk of the cash flows run through the balance sheet rather than the P&L statement.
Even though we see value here, we think the market will knock SFL for unpredictable dividends as energy prices weaken. As global shipping further weakens, the stock price can fall all the way to the $6 range where it sat in December, 2020 (Seadrill lessee issues and write downs). SFL had just cut the dividend at the point, something it does whenever management is driving to build cash to solve problems or invest in new leases.
We rate SFL a Sell today and a Buy below $6.50 per share.
For further details see:
SFL Corporation: Great Company To Own At A Lower Price