SGSOF - SGS SA: A Defensive High-Quality Business Finally Trading At A Fair Price Once Again
2023-12-14 12:28:25 ET
Summary
- We return to the Testing, Inspection, and Certification market following an introductory article earlier this year.
- In this article, we focus on SGS SA, the market leader in this space.
- We conclude that the company is a good fit for investors looking to add to the defensive core of their portfolios.
- Following numerous years of being arguably overvalued, we believe SGS to be trading at a fair price once again.
Introduction
Earlier this year, we wrote an article that aimed to introduce readers to the Testing, Inspection, and Certification ((TIC)) market, and present the four main companies active in this market – SGS SA (SGSOF), Bureau Veritas SA (BVRDF), Eurofins Scientific SE (ERFSF), and Intertek Group Plc (IKTSF).
We highlighted what we consider to be a number of positive characteristics of this niche segment of industrial support services, including relatively stable revenues, a number of structural growth drivers, and an industry structure that is both consolidated at the top and very fragmented at the bottom, which creates the opportunity for acquisition-led growth.
We also drew attention to the fact that these companies have pursued somewhat different strategies over the past decade and beyond, which has had a non-negligible impact on their financial performance and total shareholder returns.
At one end of the spectrum, there is SGS, which has been largely focused on growing its business via organic investments, and returning capital to shareholders via dividends. Then, somewhere in the middle, we find Bureau Veritas and Intertek, which have elected to balance their capital allocation between growing their business, both organically and via acquisitions, as well as distributing a share of profits via dividends - each representing about a third of total capital allocations. And finally, at the other end of the spectrum, we see that Eurofins has had an undeniable focus has been on growing the business, both via acquisitions and organically, while the dividend clearly represents a much lower priority when compared to peers.
We concluded that while the entire peer group has delivered attractive total shareholder returns over time, SGS clearly stood out for its conservative approach, while Eurofins distinguished itself for its more aggressive pursuit of growth.
In this article
Today’s article aims to go further into details on SGS, including a comprehensive review of the firm’s historical financial performance, as well as a valuation exercise.
We also want to spend a little bit of time discussing the inconvenience for a company like SGS to report financial results in Swiss Francs (CHF), despite deriving less than 2% of total revenues in that currency, and the manner in which this may lead investors to underestimate its growth profile.
Finally, we want to consider the recent IPO filing of UL Solutions Inc. ( ULS ) and subsequent news flow, and what the indicative pricing might imply in terms of valuation for the entire peers group.
Financial performance
Let us briefly go over a number of graphs that illustrate the firm's financial performance over the past couple of decades, before focusing on more recent developments.
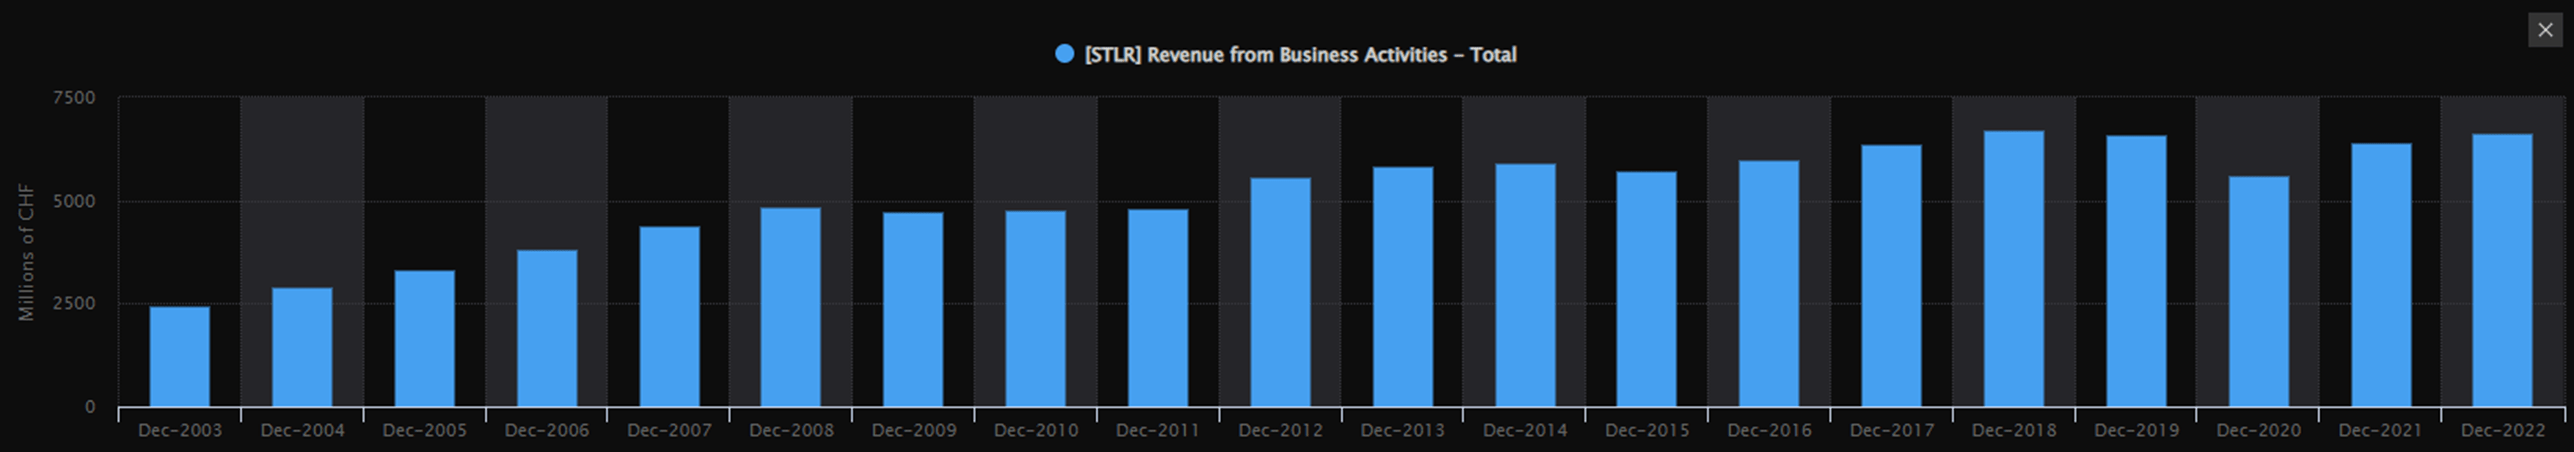
As shown below, the company has grown sales from nearly CHF 2.5 billion to nearly CHF 6.7 billion between 2003 and 2022. That’s a compounded annual growth rate ((CAGR)) of 5.4% over the past 20 years. Zooming in on the past decade alone, we can see that growth has slowed down considerably, with a CAGR of only 1.5%. The pandemic of 2020 had of course a big role to play in this, with revenues falling by 15% in 2020, and only returning to its pre-crisis level by the end of fiscal 2022.
LSEG Refinitiv
But as we’ve alluded to in the introduction, in order to gain a better understanding of what’s driven sales growth, is it important to decompose it into its various factors, including organic growth, external (i.e. acquisition) growth, and foreign currency (i.e. FX) movements. This is particularly relevant for SGS, which derives over 98% of its revenues in non-CHF currencies (see full breakdown in the Appendix).
We can make a number of observations from the graph below.
First, focusing on organic growth, one can highlight the resilient and defensive nature of the company’s business. For instance, one can note that organic growth remained in positive territory during the last global recession in 2009. More recently, during the temporary shutdown of the global economy in 2020, organic growth amounted to -6.5% year-on-year (yoy), faring much better than the vast majority of industrial businesses. Overall, SGS’s organic growth has been relatively stable, despite not being immune to the cyclicality of the underlying end-markets, and has averaged 6.2% per annum (p.a.) over the past 2 decades.
Looking at external growth, the data below confirms the conclusions of our prior article on the TIC market, which focused on the different capital allocation strategies of the main players in this space. In short, SGS is not a very acquisitive company, relative to all of its competitors. That is not to say SGS never makes acquisitions, which could amount to a missed opportunity for a company that generates ample free cash flows and operates in a highly fragmented industry. For example, 2020 saw SGS complete a record number of acquisitions for close to half a billion Swiss Francs, which led to a 5%+ contribution in external growth in 2021. But all in all, SGS can best be described as a disciplined undertaker of fairly small, bolt-on acquisitions, whenever such businesses can be purchased at reasonable prices, which tends to coincide with economic slowdowns.
Lastly, let’s take a look at the impact of foreign currencies translation on SGS’s reported sales growth. Amazingly, FX didn’t result in a negative impact on top-line growth for only approx. 30% of the calendar years between 2003 and 2022. For the rest of the time, the weakening of foreign currencies relative to the Swiss Franc proved to be a considerable headwind. As shown below, the average negative FX contribution throughout this period amounted to -2.6%. In the bad years, this headwind can easily reach a mid-single-digit figure. And in the exceptionally bad years, such as the height of the European debt crisis in 2011, FX headwinds can go well into double-digit territory.
SGS Annual reports
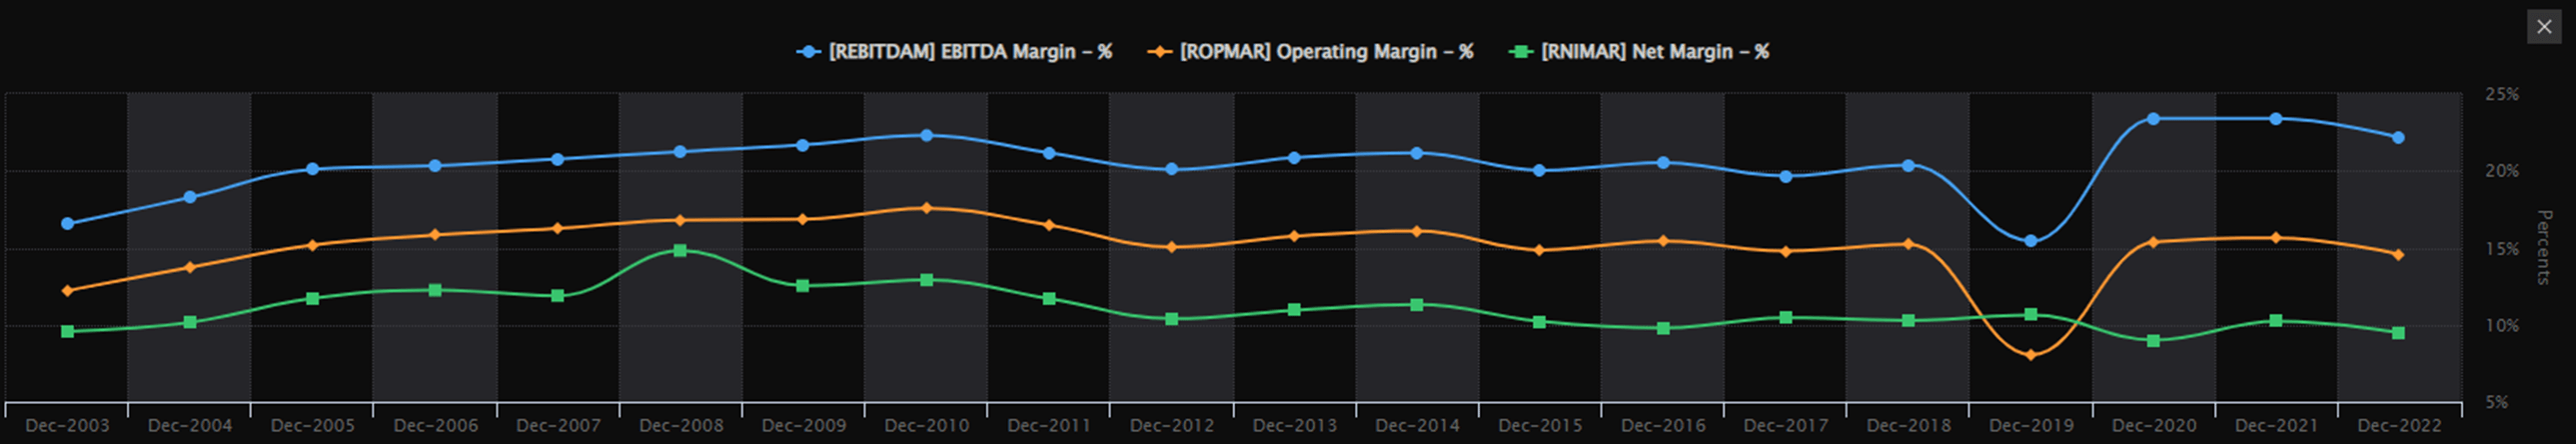
Similarly to organic revenue growth, profitability levels also display a remarkable level of consistency, with EBITDA, operating, and net margins averaging approx. 20%, 15%, and 10% respectively over the past 20 years. Returning to our prior point on FX, this indicates that the currency denomination of SGS’s fixed and variable costs is fairly well aligned with its revenues. If that wasn’t the case, one would expect a larger level of variability in profitability levels on the back of large FX moves.
LSEG Refinitiv
As a result of a fairly low level of capital intensity and a good level of profitability, returns on investment are typically very acceptable, if not better. For example, the level of return on invested capital ((ROIC)) has historically been well in excel of the firm’s capital costs (illustrated by the red line in the graph below), averaging approx. 15% between 2003 and 2022. For those that prefer to consider levels of return on investment excluding goodwill from acquisitions, SGS’s level of ROIC ex. goodwill has averaged closer to 20% over this period. More recently, returns have been pressured by a combination of slightly lower profitability levels, as well as a slightly lower level of capital efficiency (i.e. how many Swiss Francs of sales does the company generate per Swiss Franc of invested capital). Having said that, the level of ROIC including goodwill remains above our hurdle rate for a company such as SGS.
Oyat calculations
Let's now look at cash flows. As expected, the company generates cash from operating activities well in excess of net income, due to fairly sizable non-cash depreciation and amortization expenses. Over the past decade, SGS has generated more than CHF 1 billion in cash from operations on average. However, the company must undertake sizable investments capital expenditure ((CAPEX)) in order to drive organic growth. In fiscal 2022, over CHF 300 million was spent capex, representing approx. 5% of sales.
Thus, free cash flow ((FCF)) generation has averaged in excess of CHF 700 million per year over the past decade, representing a FCF margin (i.e. FCF / sales) of about 12%, and a FCF conversion rate (i.e. FCF / net income) of 125%.
LSEG Refinitiv
In other words, SGS can best be described as a pretty steady free cash flow machine.
Financial position
Over time, SGS has generally maintained a very strong balance sheet, with hardly any debt to speak of prior to 2009. Having said that, over the past 15 years, the company has gradually increased its level of financial leverage to levels that are comparable to most of its peers. As of the end of 1H23, SGS had a total debt of CHF 3.825 billion, and cash & equivalents of CHF 1.053 billion, or a net debt of CHF 2.772 billion. According to consensus estimates, SGS will achieve a level of EBITDA in excess of CHF 1.6 billion in fiscal 2023. This corresponds to a net debt / EBITDA ratio of approx. 1.7x.
Despite the gradual increase in leverage levels, we remain comfortable with the firm’s current state of indebtedness, mainly due to the stability of its cash flow generation over economic cycles. We would reconsider our position on the firm having and adequately strong balance sheet should the net debt / EBITDA ratio go above 2.0-2.5x for a prolonged period.
In its latest credit opinion dated April 2021, Moody’s maintained its long-term issuer rating of A3, with a stable outlook. (see Moody’s rating scale and definitions )
Dividend
As we documented in our previous article on the TIC market, SGS distinguishes itself from its peers with its focus on regularly returning capital to shareholders via a generous annual dividend payment.
Over the past decade, the dividend represented 90%+ of net income, and approx. 50-60% the amount of cash generated by operations.
The expected dividend payment in 2024 (from profits realized during fiscal 2023) will amount to CHF 3.22 per share, to be paid shortly following the ex-date at the end of the month of March. This represents a dividend yield of approximately 4.37% at today's share price.
Note: Dividend payments from public Swiss companies are subject to a 35% withholding tax. Having said that, under the double taxation treaty between the U.S. and Switzerland, U.S. investors are theoretically entitled to a full tax refund . This does however require some paperwork (Form 82 I for U.S. individual investors).
Valuation
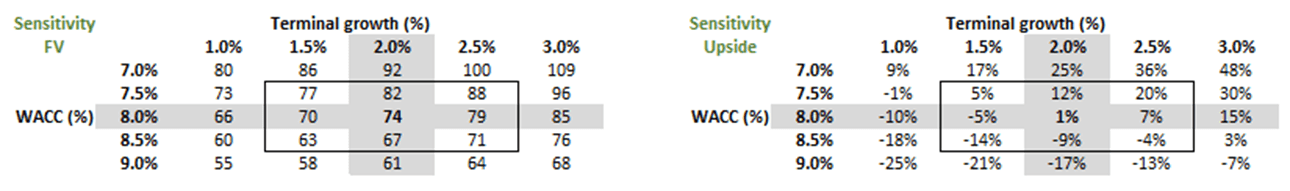
Let’s first consider measures of intrinsic worth, before turning our attention to SGS’s valuation relative to peers. Starting with a conservative discounted cash flow ((DCF)) model, which is our preferred valuation methodology, we estimate SGS to be worth approx. CHF 74 per share – more or less level with today’s stock price.
Our assumptions can be summed as follows:
- Sales growing at a CAGR of 4.1% over the next 10 years, reaching nearly CHF 9.7 billion by 2032. Long-term growth assumptions p.a. can be broken down into: 5% organic growth, 2% external growth, and -2.5% FX headwinds.
- Operating margins to gradually recover from 13.5% in 2022 to 15.5%, which is more or less in-line with long-term profitability levels.
- A free cash flow conversion rate of 115% of net income on average over the next 10 years.
- A tax rate of 26%.
- A terminal growth rate of 2%, and a WACC of 8.0%.
The graphic below displays our fair value’s sensitivity to the terminal growth rate and discount rate (i.e. WACC):
Oyat calculations
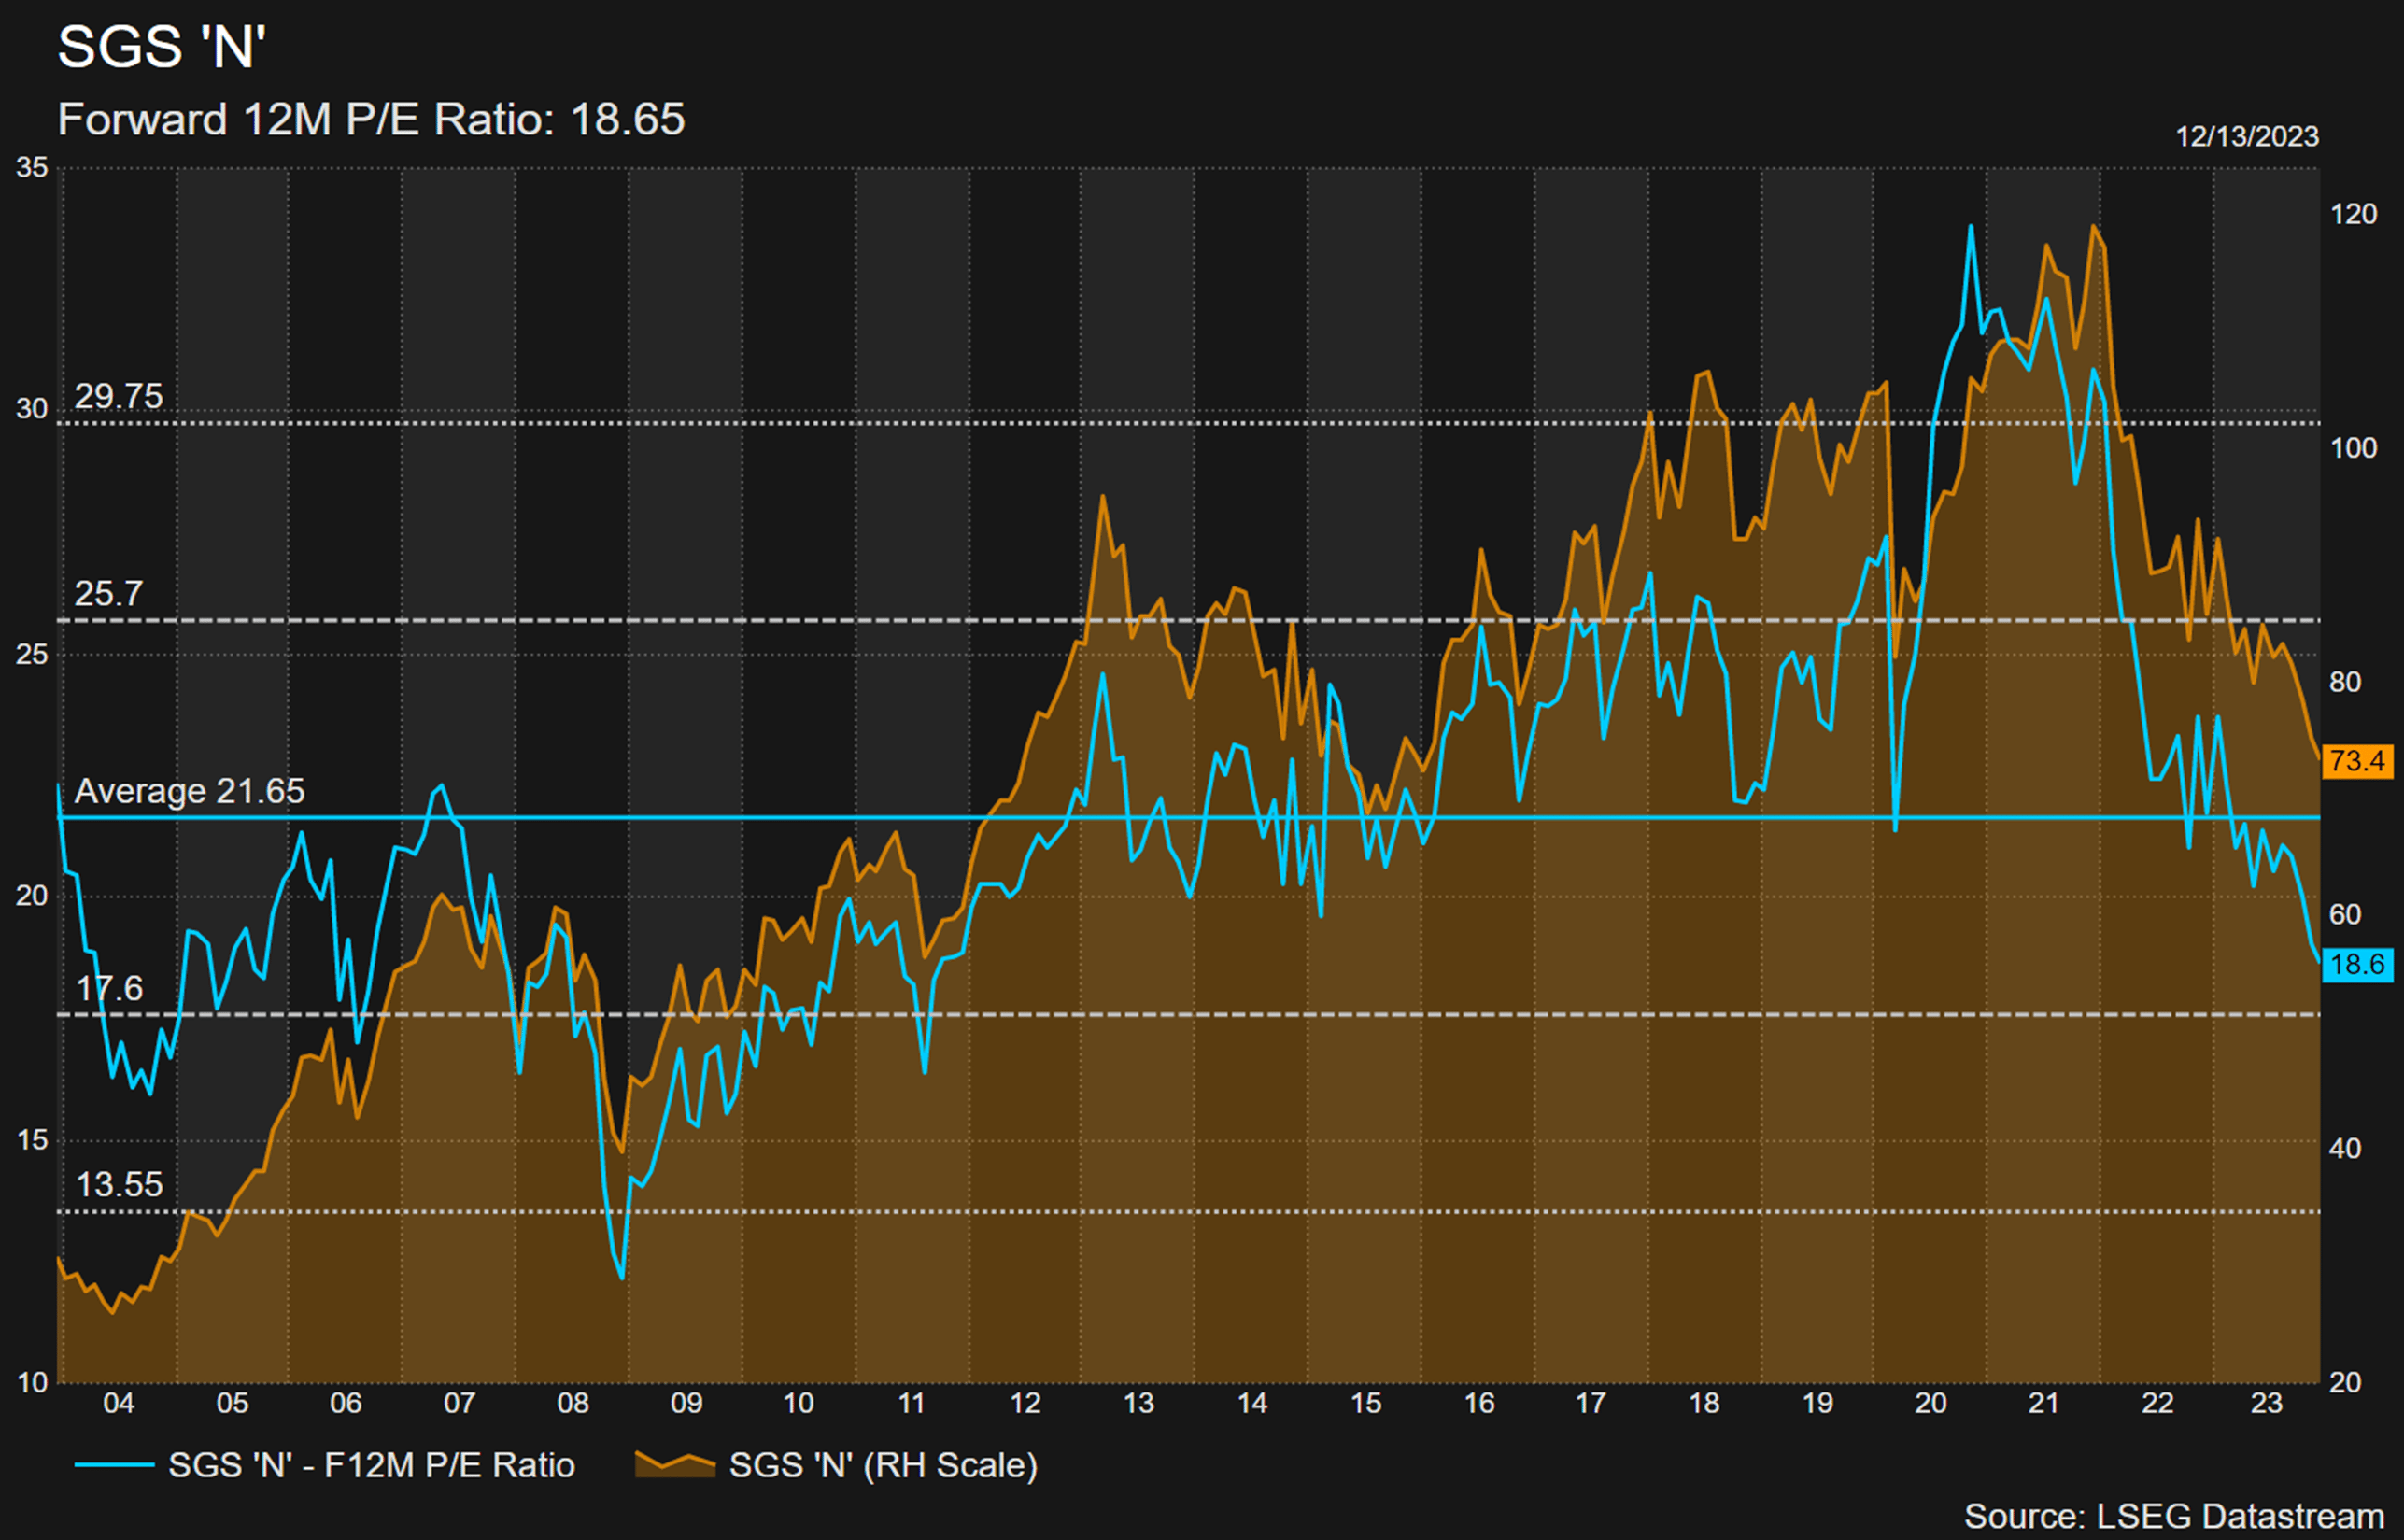
Looking at valuation multiples, the stock is currently trading at approx. 18.5x our 2024 EPS estimate of nearly CHF 4.00 per share, which is in-line with consensus estimates. This compares to a 20-year average PE multiple of over 21.6x, as shown below:
LSEG Refinitiv
Overall, we see SGS’s shares as now being fairly valued once again. This follows a number of years of being arguably overvalued, which coincides with the Swiss National Bank taking nominal interest rates into negative territory back in 2015 (until late 2022). As a result, many Swiss investors – similarly to other investors elsewhere around the world – turned to defensive companies that return the majority of their earnings to shareholders via dividends as an alternative to their traditional fixed income allocation. This, amongst other factors, contributed to the overvaluation of many such companies, whether in Switzerland and elsewhere.
Next, let’s look at relative valuation multiples, based on consensus estimates for fiscal 2024. As shown below, SGS trades at a slight premium to its peers, which is arguably justified given its leadership position in the TIC market, as well as industry-leading levels of profitability and return on investment.
LSEG Refinitiv
Finally, let’s consider the recent IPO filing of UL Solutions Inc. ((ULS)) and subsequent news flow, and what the indicative pricing might imply in terms of valuation for the entire peers group.
When it was first announced that safety testing group UL Solutions Inc. was planning an IPO in late October, the Financial Times reported that ‘two people familiar with the IPO plans said the company had discussed a valuation of as much as $10bn, but a third said it was currently targeting a range of between $5bn and $7bn.’
This struck us as very optimistic, as it implied a substantial premium to peers. However, as the TIC companies’ stock prices continued to decline throughout the month of November, Bloomberg reported that UL Solutions had decided to postpone its IPO until 2024, and was now targeting a valuation of USD 5 billion.
As shown in the table below, this is much more coherent with the current valuation levels of the peer group. Overall, we would be quite surprised if UL Solutions’ post-IPO valuation came in above USD 7 billion, although we recognize that the fact it would be the sole U.S.-based company operating in the TIC space, as well as its debt-free balance sheet, might well command a sizable premium relative to peers.
LSEG Refinitiv, ULS IPO prospectus
Conclusion
In our previous article on the Testing, Inspection, and Certification market, we highlighted a number of positive characteristics of this segment of industrial support services. These include a very broad and diversified customer base, spanning consumer goods & retail, food & agriculture, oil & gas, construction, chemicals, metals & minerals, industrial goods, and aerospace & automotive, amongst others.
We also drew attention to a number of structural growth drivers, including a growing need for companies to obtain a license to operate, access global markets, and facilitate trade, which can only be achieved by demonstrating their compliance with an increasingly large number of industry standards and regulations. Additionally, TIC services help companies reduce risks related to product quality, health, safety, and environment protection, which serves to protect their brand names.
Last, we spoke positively about the overall industry structure that is both consolidated at the top and very fragmented at the bottom, which creates the opportunity for acquisition-led growth. This has been demonstrated by Eurofins’ strategy over the past couple of decades.
Today’s article focused specifically on SGS. Similarly, there is much to like about this company, including the company’s market leadership, its strong long-term track record of organic growth through the cycle, as well as its ability to offset pricing pressures and maintain steady profitability levels.
Overall, SGS ticks all of the boxes that make up our investment checklist, and is the type of company that can be part of the defensive core of a portfolio construct alongside other such stalwarts. It just requires a lot of patience and discipline to ensure that such companies are acquired at reasonable prices. Following a decade of being arguably overvalued, SGS is now finally trading at a fair price once again.
---
Appendix
SGS currency breakdown
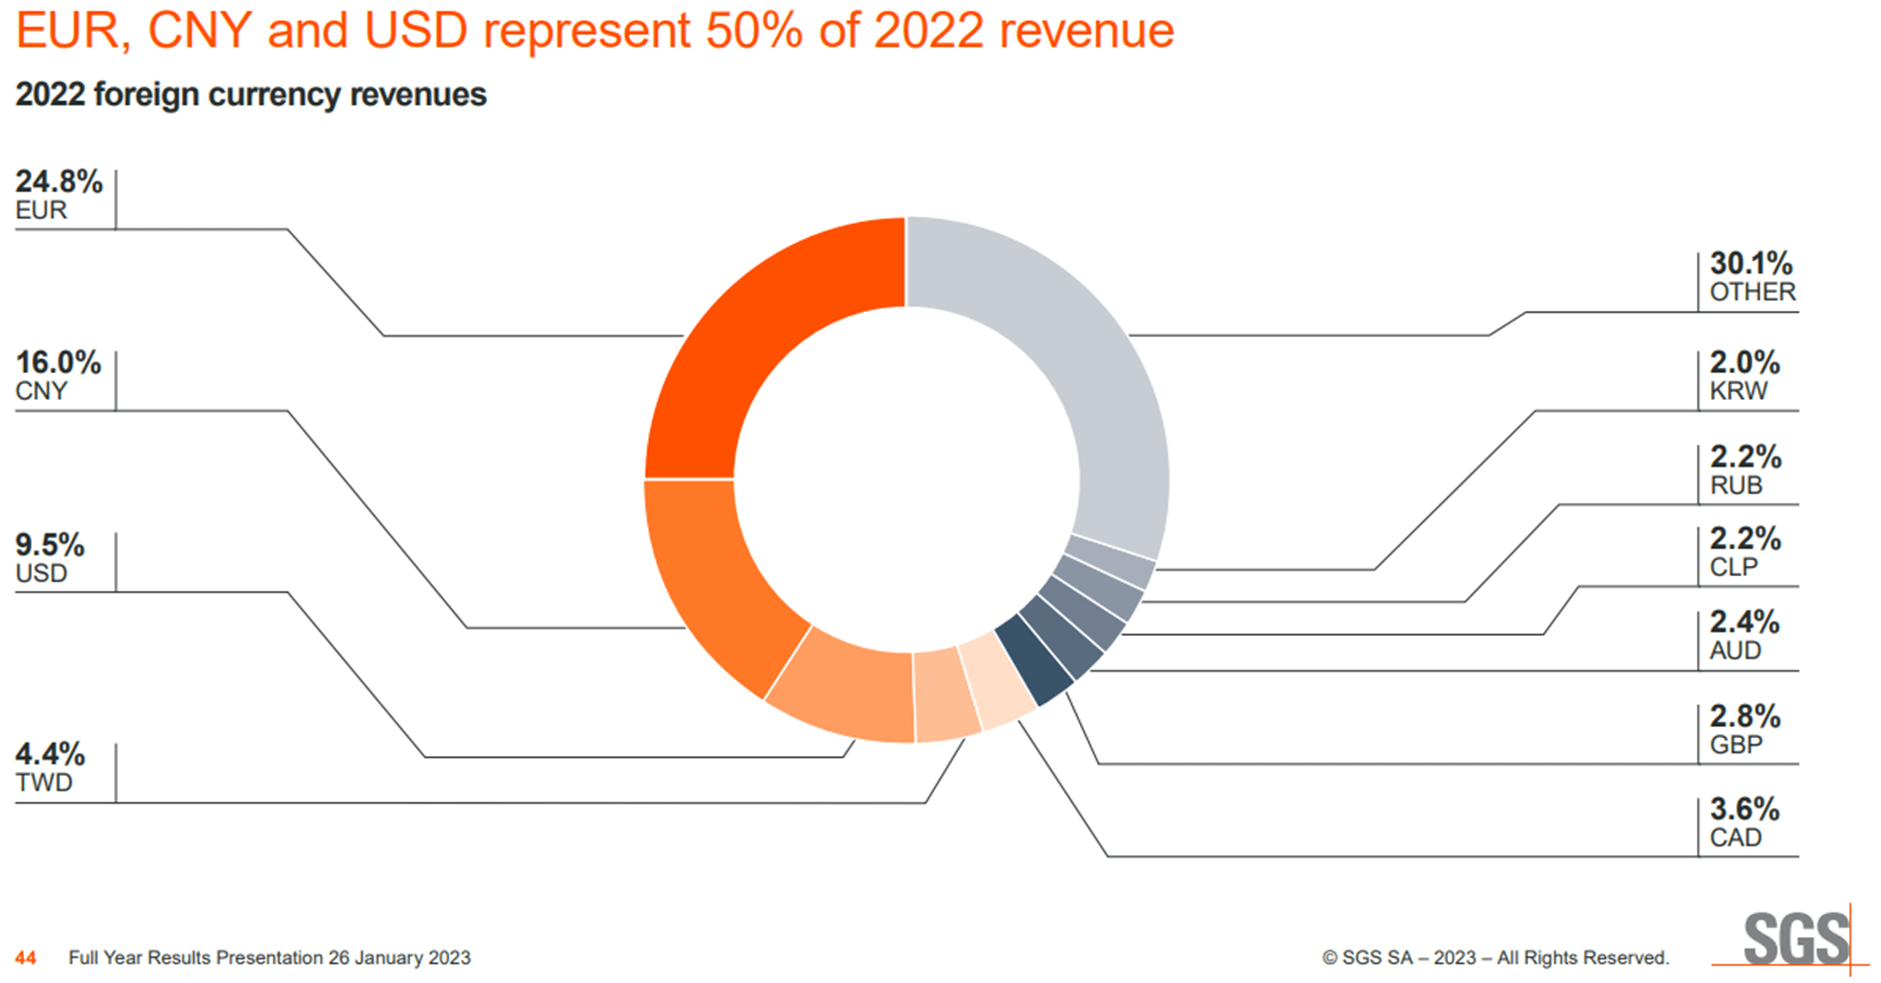
SGS
SGS valuation multiples
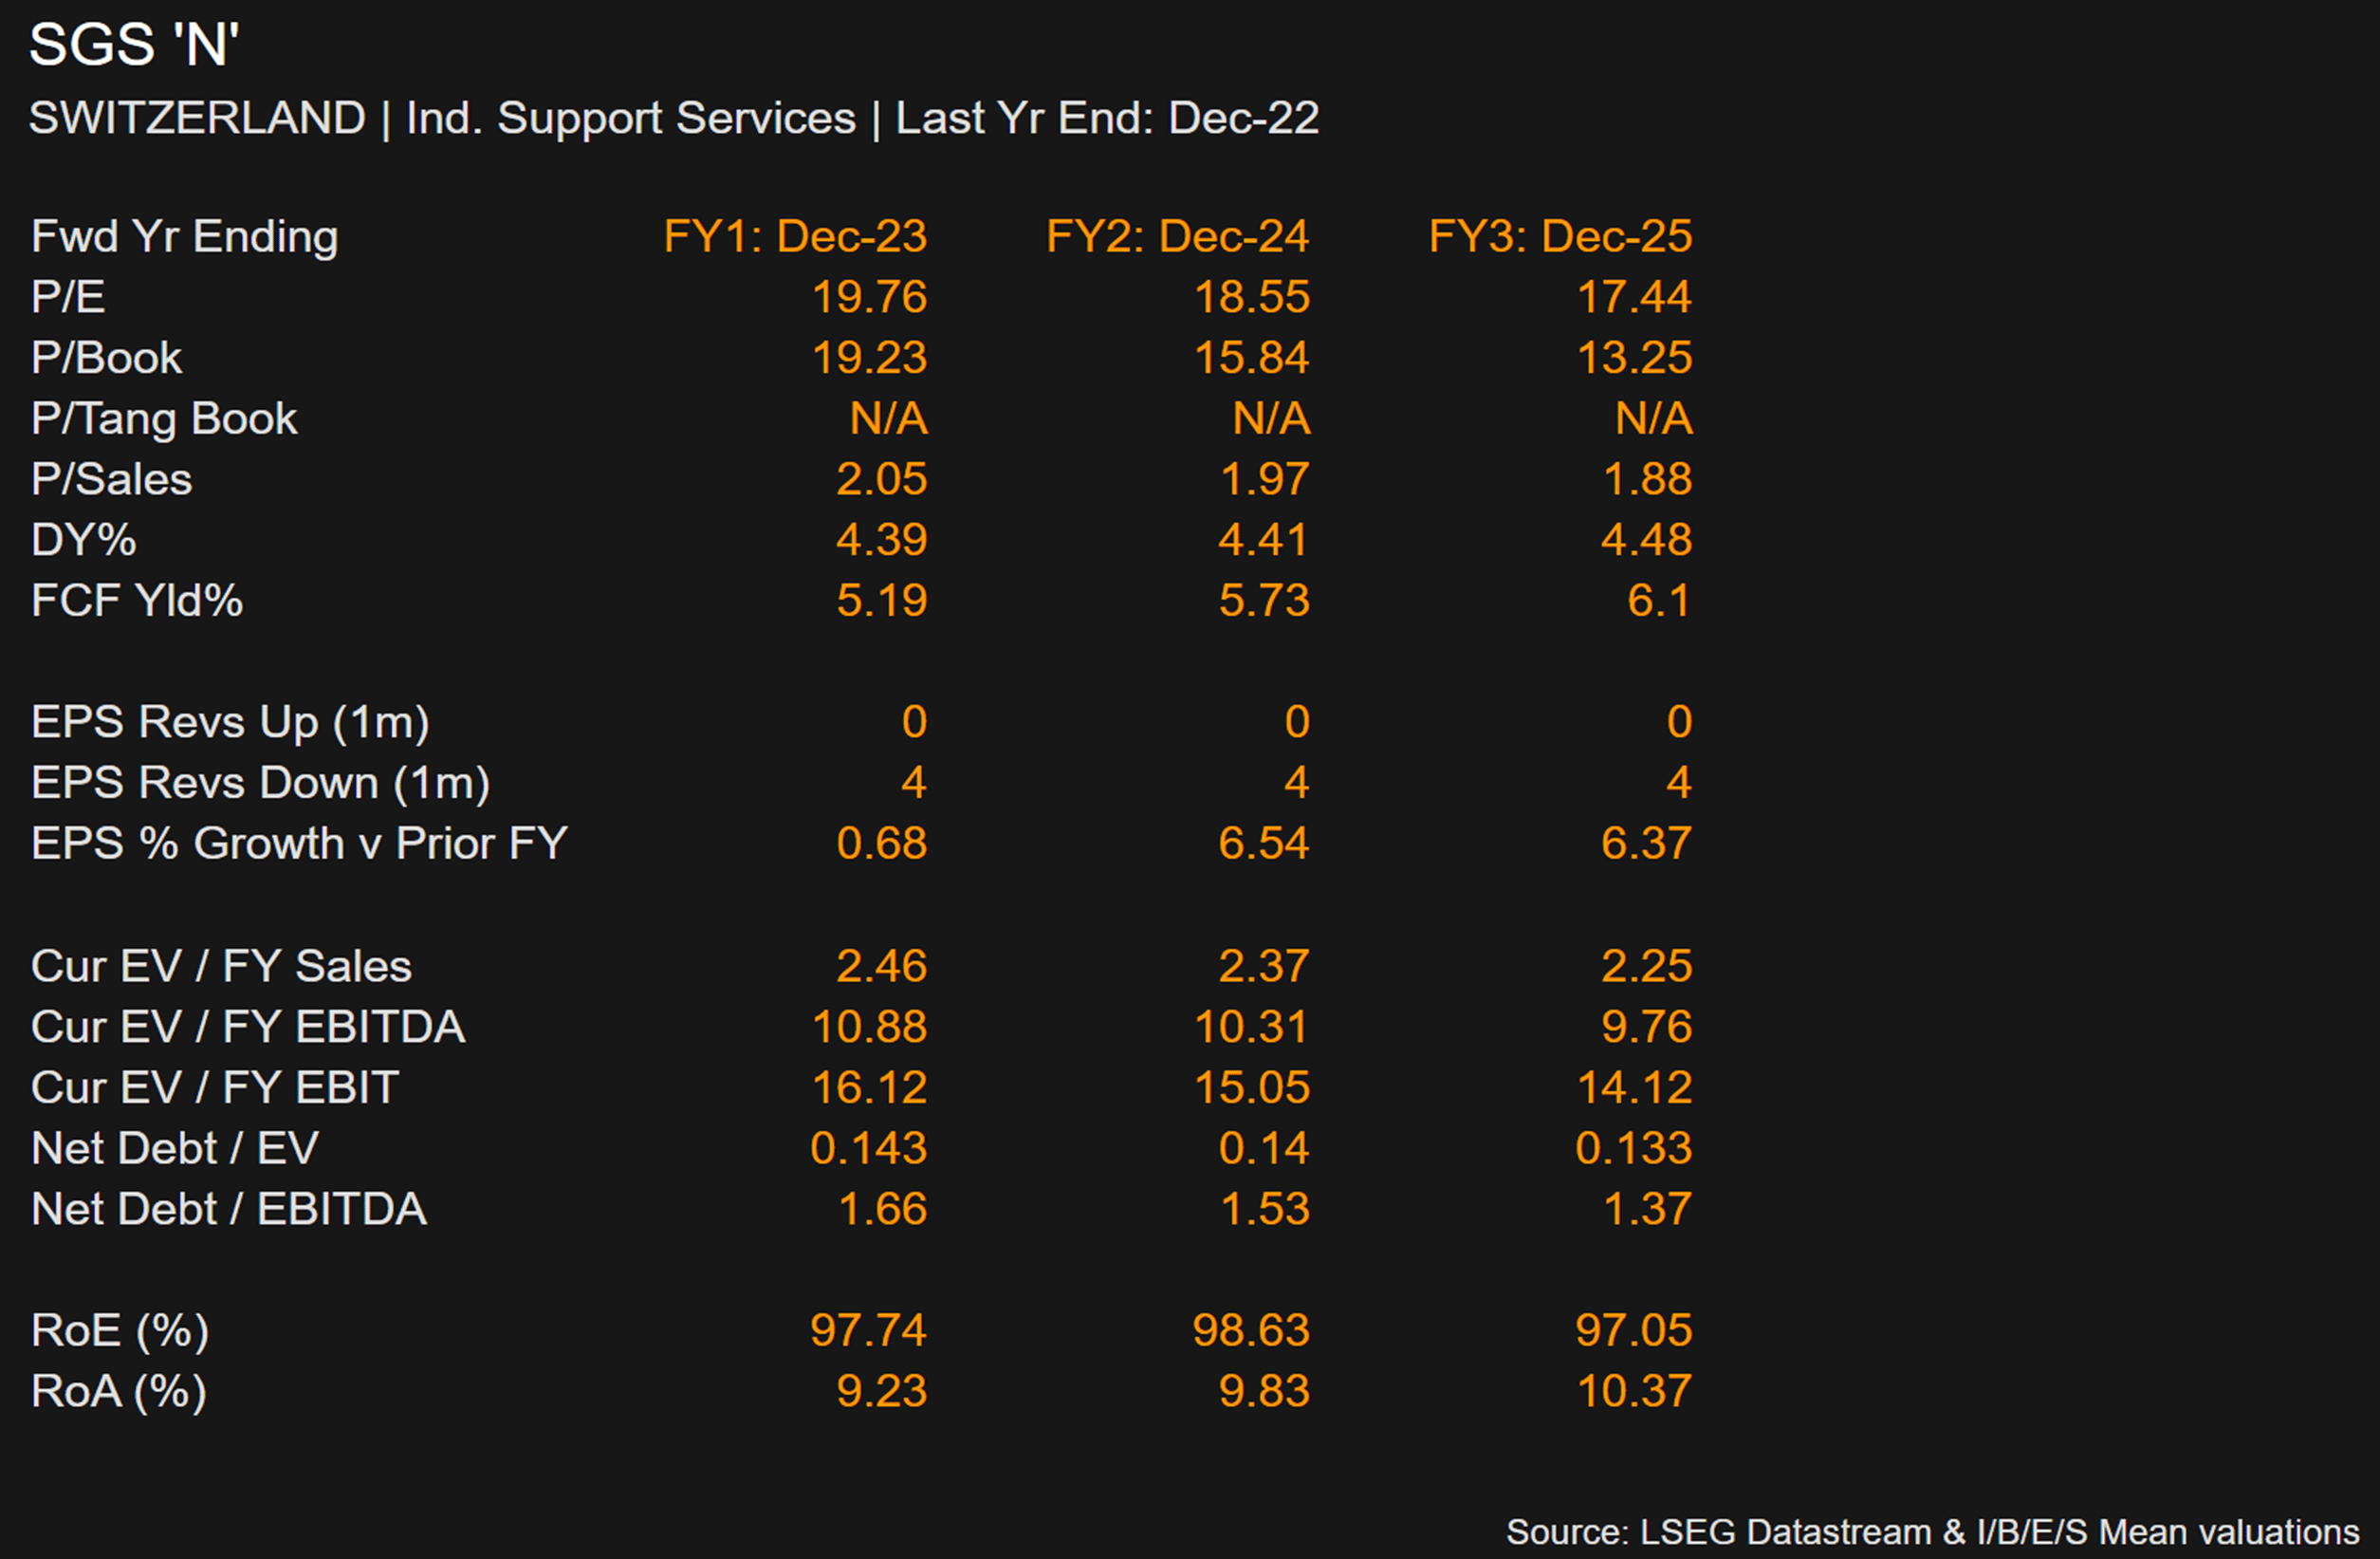
LSEG Refinitiv
For further details see:
SGS SA: A Defensive, High-Quality Business Finally Trading At A Fair Price Once Again