VOO - SH: Mr. Market Is Paying More To Be Short S&P 500 Than Long
2023-09-06 22:15:03 ET
Summary
- ProShares Short S&P500 is currently paying a higher cash yield than owning stocks long through a regular index fund.
- The trust is yielding around 3.5% annualized on a forward basis, with excess cash income beyond its management fee paid to holders.
- This setup is encouraging risk takers to go short stocks instead of long, a major change of tune for investors.
In a rare setup today, much higher interest rates on cash holdings (5%+ presently) than stocks are paying as dividends has opened a different world for many short ETF designs. In fact, the futures/swap contract pricing structure of the market is allowing ProShares Short S&P500 ( SH ) to deliver a stronger cash yield than owning stocks long through a regular index fund like the SPDR S&P 500 Trust ETF ( SPY ) at 1.5%!
That's right. In a flat market scenario over the next 12 months, I should earn a greater profit being short than long (assuming cash interest rates stay above 3%). The ProShares short product is paying out excess cash returns beyond its 0.89% management fee yearly to trust holders. Using the last two quarters of dividend payouts, the trust is yielding between 3.5% and 4% annualized currently, all other variables remaining the same.
You can review the "trailing" yield on SH of 2.5% vs. various stock market index ETFs below. In reality, SH's cash distribution is following Treasury money market yields (with durations under one year yielding better than 5% annualized for payouts).
YCharts - SH vs. Various Equity Index ETFs, Trailing Dividend Yield, 1 Year
YCharts - SH vs. Vanguard Treasury Money Market, Trailing Dividend Yield, 1 Year
Plus, with the 1x short SH hedge position in my portfolio, if the stock market declines by -10%, -15% or more in the autumn, I will pocket that on top of the dividend. To me, Mr. Market (and the Fed) are encouraging risk takers to go short stocks. It's the exact opposite investment situation of years ago, where "easy money" bank policies forced everyone to buy stocks, bonds and real estate.
The SH Portfolio
Let me explain by showing the September 1st, 2023 list of trust holdings . The fund creates its net short position through swap contracts with a diversified list of counterparties including Wall Street's leading banks. SH basically requires the banks to buy a basket of stocks from the trust at a fixed price. So, if the market declines from today, SH holders earn the profit spread between lower prevailing prices (bought) and the higher fixed-price contracts (sold).
In addition, SH owns cash (lots of cash) outside of equity contract promises at fixed pricing and future dates. As of a few days ago, SH's market cap of $1.6 billion was backed by better than $1.3 billion in Treasury bills and $270 million in other assets [cash].
SH Holdings - September 1st, 2023
| Exposure Weight | Ticker | Description | Exposure Value (Notional + GL) | Market Value | Shares/Contracts | SEDOL Number |
|---|---|---|---|---|---|---|
| -- | ||||||
| -- | ||||||
| TREASURY BILL | ||||||
| -- | ||||||
| $74,362,302.00 | ||||||
| 75,000,000 | ||||||
| BQHN616 | ||||||
| -- | ||||||
| -- | ||||||
| TREASURY BILL | ||||||
| -- | ||||||
| $24,897,395.00 | ||||||
| 25,000,000 | ||||||
| -- | ||||||
| -- | ||||||
| -- | ||||||
| TREASURY BILL | ||||||
| -- | ||||||
| $34,379,160.90 | ||||||
| 35,000,000 | ||||||
| BPXXGD5 | ||||||
| -- | ||||||
| -- | ||||||
| TREASURY BILL | ||||||
| -- | ||||||
| $34,533,087.75 | ||||||
| 35,000,000 | ||||||
| BRF3T16 | ||||||
| -- | ||||||
| -- | ||||||
| TREASURY BILL | ||||||
| -- | ||||||
| $24,659,716.75 | ||||||
| 25,000,000 | ||||||
| BRXJ9X8 | ||||||
| -- | ||||||
| -- | ||||||
| TREASURY BILL | ||||||
| -- | ||||||
| $74,977,993.50 | ||||||
| 75,000,000 | ||||||
| BQ6C0P6 | ||||||
| -- | ||||||
| -- | ||||||
| TREASURY BILL | ||||||
| -- | ||||||
| $49,524,462.00 | ||||||
| 50,000,000 | ||||||
| BR843D6 | ||||||
| -- | ||||||
| -- | ||||||
| TREASURY BILL | ||||||
| -- | ||||||
| $34,495,980.40 | ||||||
| 35,000,000 | ||||||
| BQH6251 | ||||||
| -- | ||||||
| -- | ||||||
| TREASURY BILL | ||||||
| -- | ||||||
| $24,974,399.00 | ||||||
| 25,000,000 | ||||||
| -- | ||||||
| -- | ||||||
| -- | ||||||
| TREASURY BILL | ||||||
| -- | ||||||
| $99,868,375.00 | ||||||
| 100,000,000 | ||||||
| BMF0FQ9 | ||||||
| -- | ||||||
| -- | ||||||
| TREASURY BILL | ||||||
| -- | ||||||
| $74,210,625.00 | ||||||
| 75,000,000 | ||||||
| BLB3TK7 | ||||||
| -- | ||||||
| -- | ||||||
| TREASURY BILL | ||||||
| -- | ||||||
| $99,795,143.00 | ||||||
| 100,000,000 | ||||||
| BNBXRD0 | ||||||
| -- | ||||||
| -- | ||||||
| TREASURY BILL | ||||||
| -- | ||||||
| $34,604,527.30 | ||||||
| 35,000,000 | ||||||
| BR1W821 | ||||||
| -- | ||||||
| -- | ||||||
| TREASURY BILL | ||||||
| -- | ||||||
| $199,532,112.00 | ||||||
| 200,000,000 | ||||||
| BMTTP62 | ||||||
| -- | ||||||
| -- | ||||||
| TREASURY BILL | ||||||
| -- | ||||||
| $123,532,291.30 | ||||||
| 125,000,000 | ||||||
| BP489W9 | ||||||
| -- | ||||||
| -- | ||||||
| TREASURY BILL | ||||||
| -- | ||||||
| $99,252,118.00 | ||||||
| 100,000,000 | ||||||
| BMDLR02 | ||||||
| -- | ||||||
| -- | ||||||
| TREASURY BILL | ||||||
| -- | ||||||
| $99,663,146.00 | ||||||
| 100,000,000 | ||||||
| BRPT226 | ||||||
| -- | ||||||
| -- | ||||||
| TREASURY BILL | ||||||
| -- | ||||||
| $148,106,208.00 | ||||||
| 150,000,000 | ||||||
| BP8JTH3 | ||||||
| -- | ||||||
| -- | ||||||
| NET OTHER ASSETS (LIABILITIES) | ||||||
| -- | ||||||
| $270,757,774.10 | ||||||
| 270,757,774 | ||||||
| -- | ||||||
| -1.39% | ||||||
| -- | ||||||
| S&P500 EMINI FUT EQUITY INDEX 15/SEP/2023 ESU3 INDEX | ||||||
| -22,607,500 | ||||||
| -- | ||||||
| -100 | ||||||
| -- | ||||||
| -8.81% | ||||||
| -- | ||||||
| S&P 500 INDEX SWAP BANK OF AMERICA NA | ||||||
| -143,199,582 | ||||||
| -- | ||||||
| -31,711 | ||||||
| -- | ||||||
| -9.12% | ||||||
| -- | ||||||
| S&P 500 INDEX SWAP BNP PARIBAS | ||||||
| -148,361,108 | ||||||
| -- | ||||||
| -32,854 | ||||||
| -- | ||||||
| -10.31% | ||||||
| -- | ||||||
| S&P 500 INDEX SWAP GOLDMAN SACHS INTERNATIONAL | ||||||
| -167,593,772 | ||||||
| -- | ||||||
| -37,113 | ||||||
| -- | ||||||
| -10.76% | ||||||
| -- | ||||||
| S&P 500 INDEX SWAP MORGAN STANLEY & CO. INTERNATIONAL PLC | ||||||
| -175,013,182 | ||||||
| -- | ||||||
| -38,756 | ||||||
| -- | ||||||
| -13.26% | ||||||
| -- | ||||||
| S&P 500 INDEX SWAP CITIBANK NA | ||||||
| -215,623,502 | ||||||
| -- | ||||||
| -47,749 | ||||||
| -- | ||||||
| -13.88% | ||||||
| -- | ||||||
| S&P 500 INDEX SWAP SOCIETE GENERALE | ||||||
| -225,653,027 | ||||||
| -- | ||||||
| -49,970 | ||||||
| -- | ||||||
| -15.30% | ||||||
| -- | ||||||
| S&P 500 INDEX SWAP UBS AG | ||||||
| -248,876,313 | ||||||
| -- | ||||||
| -55,113 | ||||||
| -- | ||||||
| -17.15% | ||||||
| -- | ||||||
| S&P 500 INDEX SWAP JP MORGAN SECURITIES | ||||||
| -278,875,892 | ||||||
| -- | ||||||
| -61,756 | ||||||
| -- |
Positive Effect of Cash Yield
Let's review how the SH product has performed for investors vs. SPY over the last year. While time decay for swap contracts (often requiring premium prices vs. spot to create the leverage, 3%+ S&P 500 premiums on 1-year futures today) was the norm for most years since 2009, high cash yields are now able to overcome the costs of running the trust's 1x net short goal.
In the past, you would expect a +10% annual market increase for the S&P 500 to generate a -12% to -15% SH drop from all the costs involved to create its positioning. Not anymore. Below I have graphed, 3-month, 6-month, and 1-year total returns for both the short and long S&P 500 ETFs. You will notice SH is now performing far better than in past experience.
YCharts - SH vs. SPY, Total Returns, 3 Months
YCharts - SH vs. SPY, Total Returns, 6 Months
YCharts - SH vs. SPY, Total Returns, 1 Year
The good news for investors wanting to go short the S&P 500 in an IRA, 401k, or regular brokerage account is you don't have to borrow shares and incur major interest costs. All you have to do is go long SH, and put its design advantages in your pocket.
And, if interest rates keep going up, all the better for SH holders. And, if the market begins to fall in price, you capture the upside of being short the market, with the trust's cash holdings rising fast to generate even smarter net dividend yields in the future.
Of course, if you are wildly bullish on the direction of stocks, going short the market has no appeal to you. However, if you want a hedge idea to stay long your favorite names, helping you sleep at night given trouble is coming down the line, SH is an excellent choice right now. Even if wrong to a minor degree, with the S&P 500 rising say +5% to +10% in price over the next 12 months, SH might slide just -1% to -8% for a total return, depending on daily rebalancing (changing swap contract discounts/premiums) and interest rates on cash over the span.
Lingering Reasons for New Market Selloff
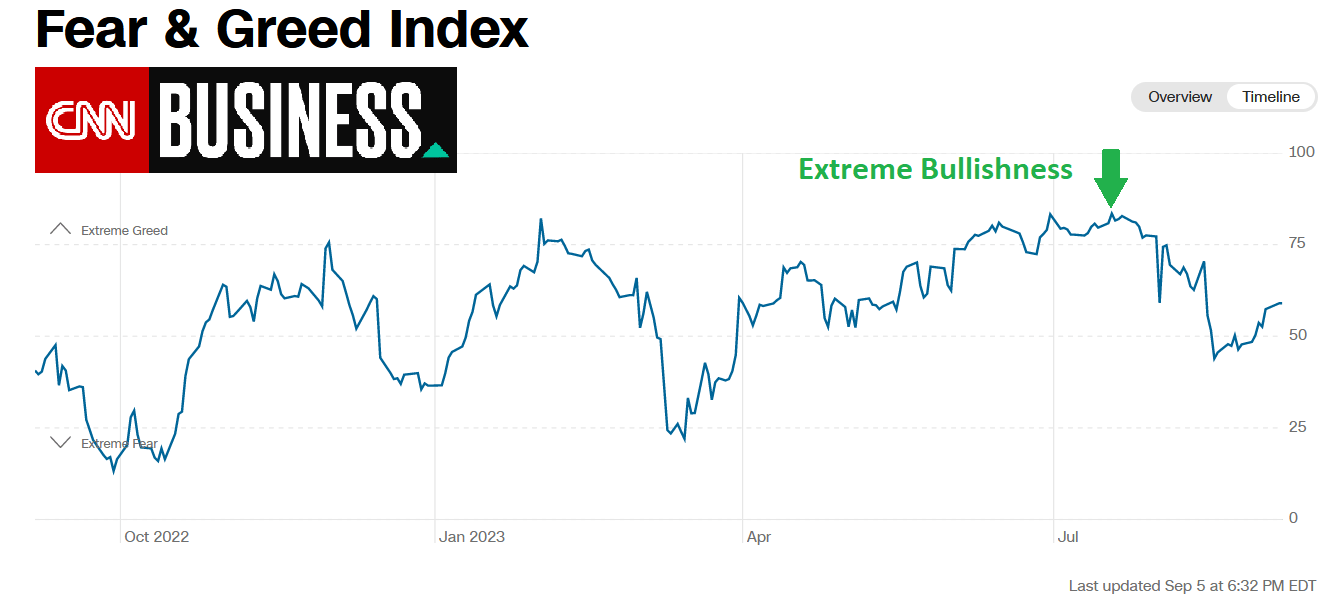
My first excuse to be a little leery of the stock market into the autumn is investor sentiment reached a fever pitch of bullishness in July. You have to go back to December 2021's major equity top to find an equivalent level of investor optimism in surveys and trading action. Below is a graph of 1-year highs in "greed" weeks ago as measured by CNN Business . We reached the opposite extreme of "fear" witnessed at last October's price bottom.
CNN Business - Fear & Greed Index, 1 Year, Author Reference Point
One prerequisite for a major bear market drop is investor bullishness that seems to be stretched beyond economic fundamentals. What if soft-landing hopes are knocked into recession by a black swan event in coming days?
Another requirement for an oversized slide in price is stocks have to be overvalued vs. peaking business profits and consumer spending. Below I have charted two long-term valuation charts. The first is Warren Buffett 's favorite data point looking at the value of all U.S. equities (total market cap) vs. the prevailing rate of GDP economic output. Usually, readings over 100% are considered expensive. Right after the pandemic started, Wall Street reached for a 200% reading. We have come down a little, but 153% as of yesterday is still very, very expensive. We remain ABOVE the peak levels of either the Roaring 1920s (120% not pictured) or 1990s technology booms! Think about it.
YCharts - Total U.S. Market Cap to GDP, Since 1971
My second valuation look is the Shiller S&P 500 CAPE Ratio . It reviews price vs. the last 10 years of earnings. Today's 31x ratio is about the same as the fabled 1929 market top, but slightly under the all-time Dotcom Tech Bubble peak of 2000.
YCharts - Shiller 10-Year CAPE Ratio, Since 1880
Perhaps the main reason to worry about the market's direction is a recession is getting overdue, based on the inverted Treasury yield curve. Below I have charted 3-month bill vs. 30-year bond yields since 1981. You can see the last five recessions were all predated by a period of 3-month rates eclipsing 30-year ones. Today's oversized inversion by 1.24% may be the greatest warning signal of them all for both recession and another Wall Street dump.
YCharts - 3-Month vs. 30-Year Treasury Rates, Since 1981, Recessions Shaded
So, if investors are overly optimistic, stocks are quite overvalued in a long-term sense, and a recession is quickly approaching with falling income levels on top of weaker corporate earnings, why not consider holding some shorts/hedges in your portfolio? It's a natural and logical response to Mr. Market's setup right now.
Final Thoughts
Nearly free-money loans had been the fuel for bull markets and rising brokerage accounts since the Great Recession turmoil of 2009. No longer is this our reality. In truth, the opposite is now playing out. Smart money hunting for yield is now being encouraged to sell stocks short through designs like the ProShares Short S&P 500. Talk about a major change of tune for investors!
What's the downside risk for SH? Essentially, stocks must continue a wild advance into the end of the year, similar to the AI enthusiasm-supported jump since March. Nevertheless, today's extra cash yield will help to keep potential SH losses limited, just like this past year's total return zigzag.
In the end, a drop in cash interest rates may only be possible after a major stock market drawdown occurs to pull CPI inflation lower, still running hot close to +4% YoY in the second half of 2023 (on the back of rising crude oil).
If you believe the odds of a flat to lower stock market into 2024 are great, like I do, the seasonally weak September-October period could easily bring another -10% correction or -20% bear market on Wall Street. (I wrote about rotten approaching seasonals in an article last week here .)
Just to get it out of the way, the same scenario of a sharp rise in interest rates over several years, with an inverted yield curve, was part of the investment equation in early September 1929. Excessive investor enthusiasm, check. Record high overvaluations at the time, check. A developing recession, check.
I am not personally expecting a once-in-a-lifetime stock market crash like September-December of that year leading to a depression in economic activity, but today's background situation is not much different. Of course, if you own SH into a stock market crash, you will feel like a king, earning money hand over fist while nearly everyone else is watching their lifetime of wealth building disappear.
Pulling all the ideas together, I would rather own SH today, get a solid cash yield for waiting, and introduce a nice direct hedge to my U.S. stock market portfolio design. For weightings, SH sits at 5% of my total portfolio value. You don't have to go hog wild owning the trust. In fact, I recommend against overweighting the idea. SH should be part of a well-diversified portfolio. My financial worth will survive just fine if stocks rise or fall by 20% over the next 12 months.
Owning ProShares Short S&P 500 is one way to put Mr. Market's current math in your favor, especially if a flat to lower Wall Street condition is next into autumn. I rate SH a Buy , in small proportions.
Thanks for reading. Please consider this article a first step in your due diligence process. Consulting with a registered and experienced investment advisor is recommended before making any trade.
For further details see:
SH: Mr. Market Is Paying More To Be Short S&P 500, Than Long