ILTB - Short-Rates Will Decline And Long-Term Rates Will Follow
2023-11-20 22:37:51 ET
Summary
- September/October saw declines in the stock market, bonds, small-cap, and tech, but all bounced back in November.
- China, Brazil, Saudi Arabia, and Japan have halted buying U.S. bonds and have been net sellers.
- The Fed's hawkish remarks and significant increases in long-term bond yields act as an anchor to stocks.
- Intermediate-term high-quality U.S. or corporate bonds offer an unusual opportunity to lock in yields.
The Market Lately/Bond Vigilantes
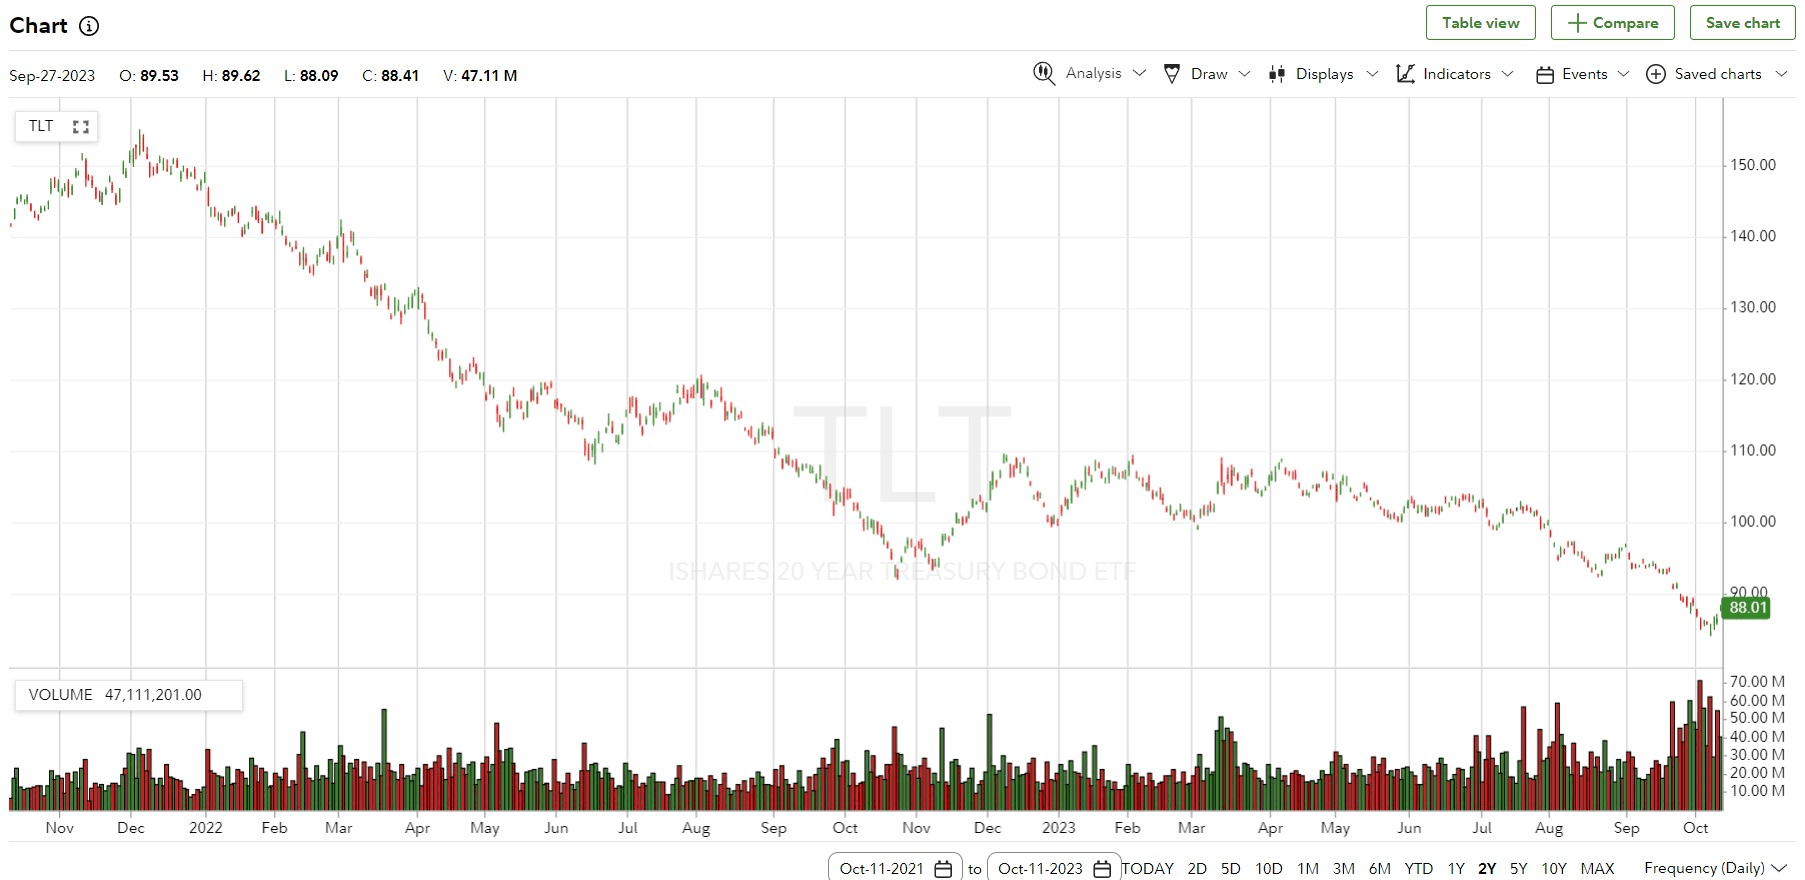
There was nowhere to hide in September/October except short-term T-bills, or money markets. The S&P was down 4.7% in September. Bonds fell around 2.5%. Small cap and tech had similar declines to the S&P. Income stocks like REITs and Utilities were hit even harder hit as interest rates spiked. All have bounced back in November. Of note, September is the worst-performing month for the stock market historically and November is the best. The fourth quarter is historically strong, particularly starting in November. What we saw in September though was unsustainable. Longer-term bond yields increased almost daily (bond values declining) with coincident drops in all the above equities. Below is a chart of the long bond ETF ( TLT ) showing a 45% decline from peak (a.k.a. Bond Vigilantes are back!). China, Brazil, Saudi Arabia, and Japan have halted buying U.S. bonds and have been net sellers. Link Japan, China pare U.S. Treasury holdings as currencies hit new lows. There are loads of new issuance. The Fed's hawkish remarks also impact. Significant increases in long-term bond yields act like an anchor to stocks.
2-Year Chart of 20-Year U.S. Bond ETF: TLT
Speaking of bond supply being up. U.S. GDP is around 3% for the year thus far. Pretty solid right? Well, until you factor in the deficit which will range between $1.8T to $2T by year-end, or 7 to 8% of U.S. GDP. So let's take the mid-point of 7.5% subtract that 3% gain to find out the U.S. economy is really contracting by 4.5% absent a tremendously unnatural and inflated government deficit.
What's the right bet and hedge in these conditions? It seems the Fed is at or close to the end of the rate raising program and inflation is ebbing - thus the recent rally. That means we are also closer to a new rate lowering regime when something in the economy breaks.
History has shown that when the central bank pivots whether by reversing quantitative tightening by easing or by halting interest rate increases and reversing course, the economy is about to go through a rough period. In fact, the Fed is usually late and the downward slide has already begun.
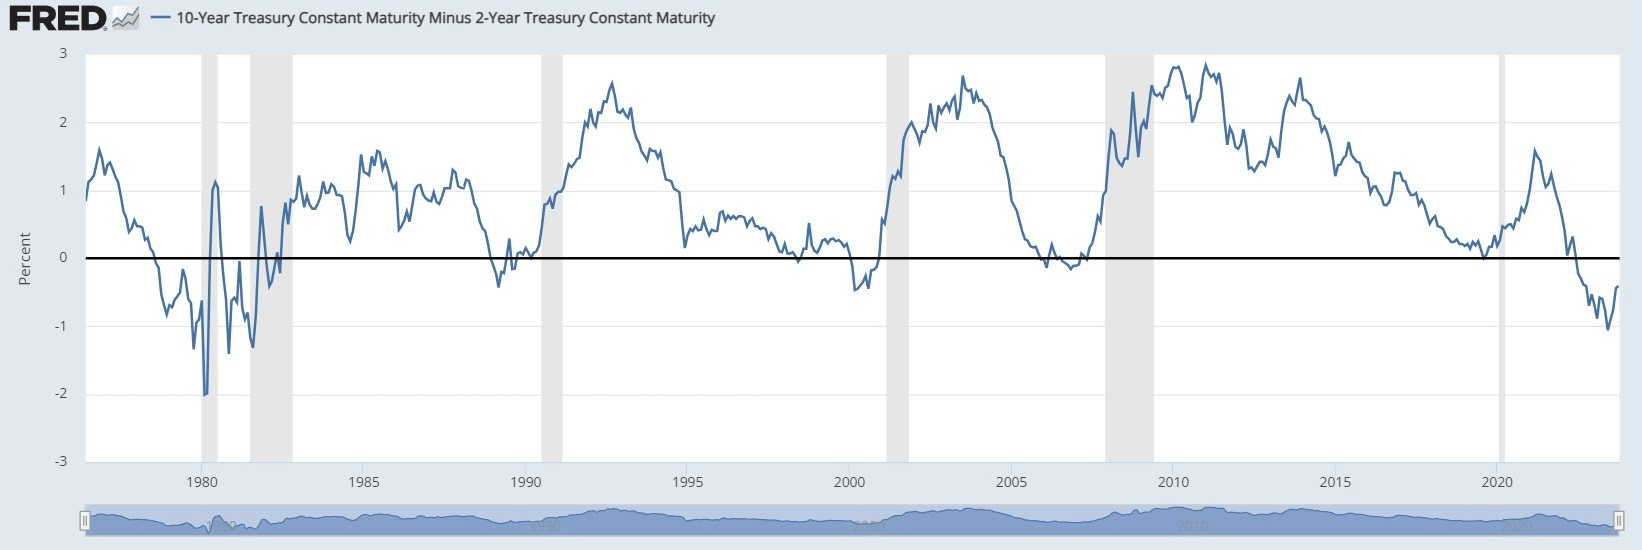
Regardless, as famed bond guru Jeffrey Gundlach recently put it , "rates take the stairwell up, but the elevator down." The following chart is the 2-year to 10-year spread showing yield curve inversions.
We've shown before how yield curve inversions (blue line dipping below 0) predict recessions (shaded vertical lines).
But notice how rapid and severe the yield spread increases just before, during or after the recession to correct the inversion. This is a result mostly of the 2-year bond rallying (yield declining) as a result of Fed Funds rate decreases.
Watch Out for Plateaus!
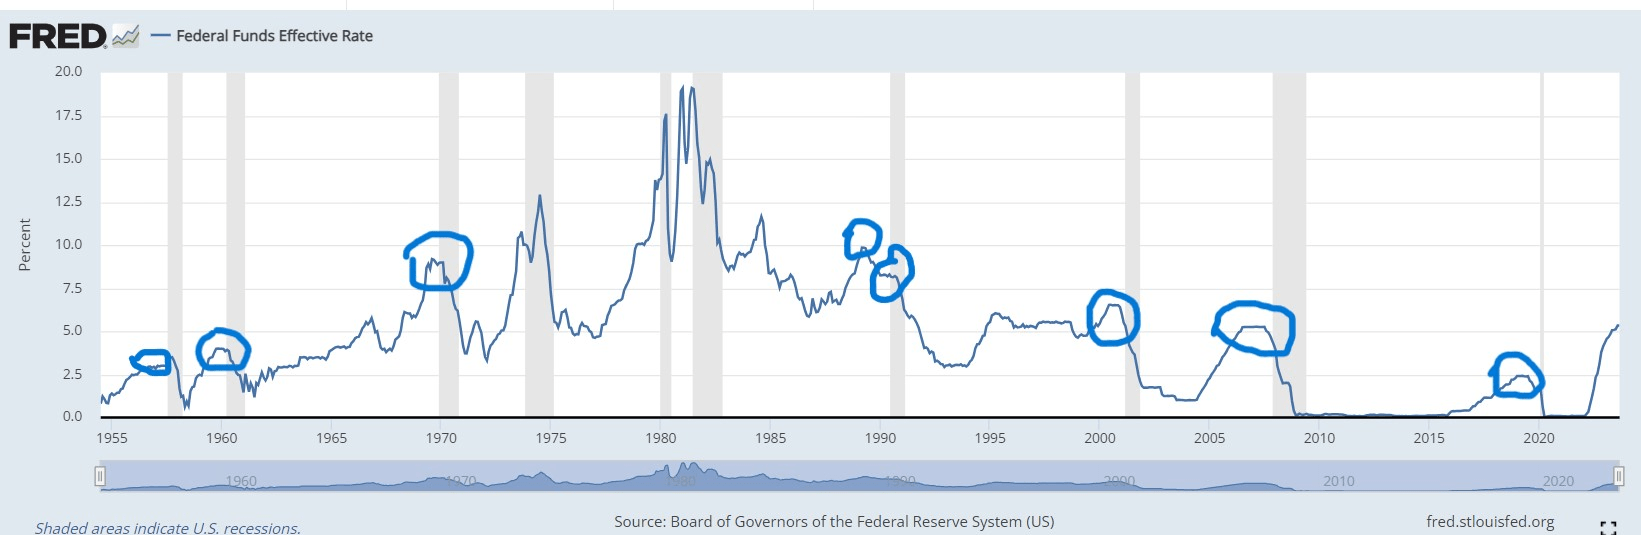
Now let's look at the Fed Funds Rate history since 1955 in the chart below, and how the Fed lowers in the face of a faltering economy:
Here we see the stairs up, elevator down. Also notable about this chart are the plateaus (circled). Notice what follows the short flat top periods: Recessions (vertical shaded areas) and a rapid drop in rates. We are at the end of this tightening cycle and a new plateau is forming. These short periods average 6 or 7 months but can last up to a year (as in 06/07).
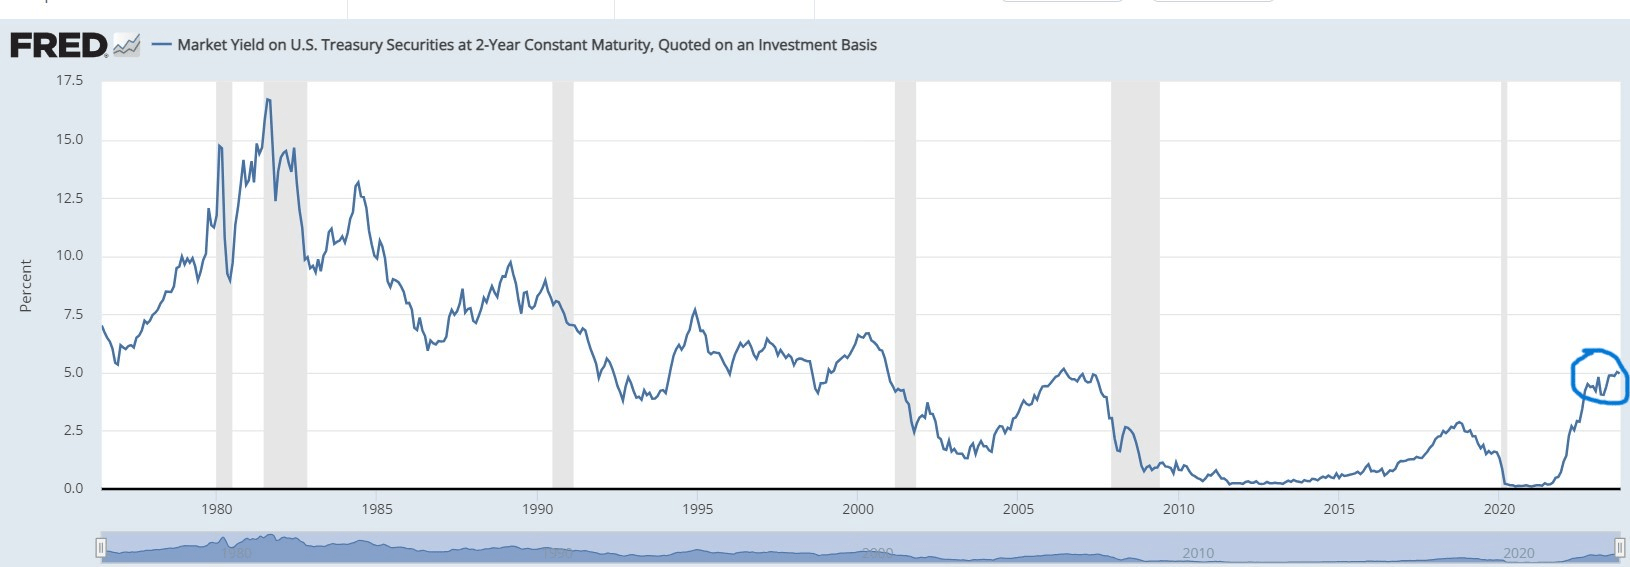
Compare that with the following 2-Year Treasury Yield Chart (from 1975):
2-Year Treasury Yield Chart (from 1975) (Federal Reserve FRED)
Circled area: is the yield starting to top out? Looks like it.
Following is the 5-year Treasury Bond yield chart (from 1955):
5-year Treasury Bond Yield 5-year Treasury Bond yield chart (from 1955)hart (from 1955) (Federal Reserve FRED)
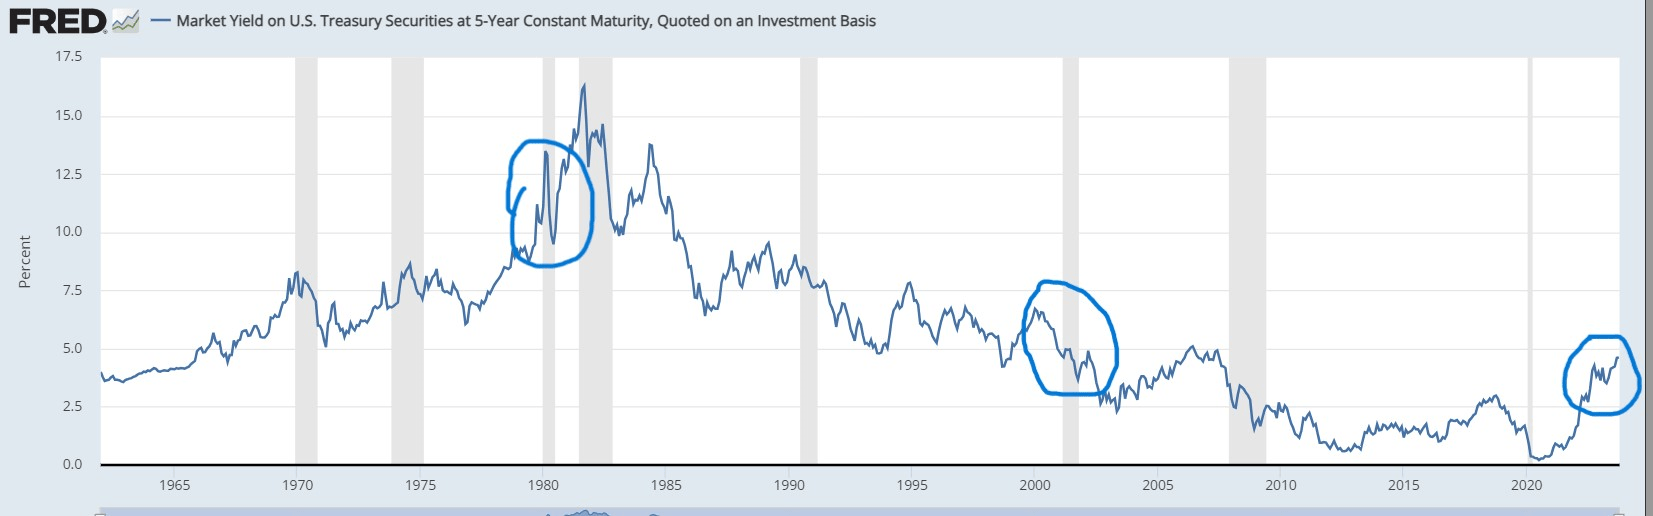
It's easy to see the rates dropping at a smaller percentage than the Fed Funds rate in the circled areas of 1980 and 2000, but nevertheless, they do drop as investors seek high-quality shelter (buy treasuries). Circled area to the right, rates have obviously moved above trend for all rate horizons.
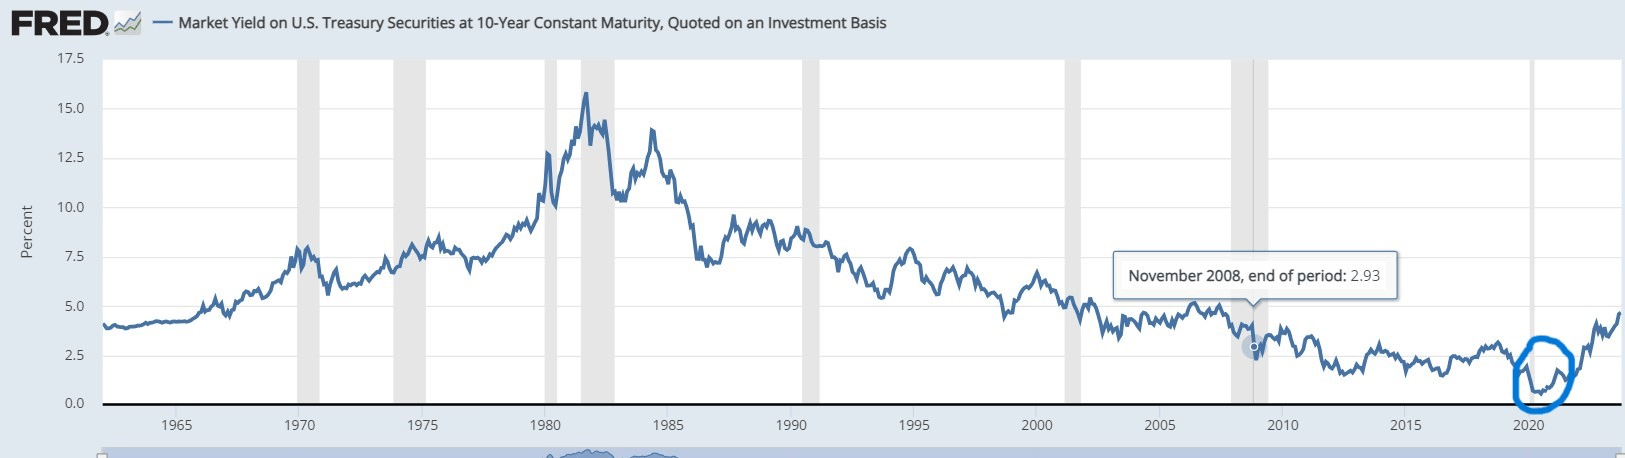
10-Year bond yield chart (from 1955):
The circled area, yield on the 10-year bottomed out at .55% July 2020. Note the smoother slope on the long bond chart. Long rates decline with short rates but less severe.
Conclusion - This is What Always Happens
This leads us back to the title of the update. As exhibited by the charts above, Fed Funds rate declines have always caused concurrent declines in the other parts of the yield curve (i.e. longer dated treasuries). The Fed Funds rate normally declines at a faster rate than it rises due to unexpected economic shocks. Recessions are typically deflationary, decreasing rate pressure. The Fed always lowers the Fed Funds rate in the face of a recession, or at least it always has. Even Paul Volker, the Fed chair best known for stamping out the inflation of the 70's, lowered rates from 18% in April, 1980 to 9.5% over the next 3 months in the face of a short recession that year.
Adding mid-term duration seems prudent at this point. This can be accomplished by purchasing certain types of income/dividend-oriented equities or high quality corporate or government bonds. Lightening equities most dependent on economic growth also appears a good idea if the economy is in the late part of the cycle. What will 6-month to 1-year Treasuries, which currently yield 5.4%, yield in a year? Less, most likely. Perhaps much less.
We'll leave you with a final thought from famed professor and investment guru Benjamin Graham regarding prioritizing quality over income: "It is an axiom of investment that securities should be purchased because the buyer believes in their soundness, and not because he or she needs a certain income."
For further details see:
Short-Rates Will Decline And Long-Term Rates Will Follow