QVML - Short Stocks Buy Bonds: TINA Effect Goes In Reverse
Summary
- Equity markets have been powered higher by the TINA effect as yields have been unattractively low for years.
- Nominal and real yields have risen to potentially attractive levels due to the remarkable surge in inflation.
- The top priority for the Federal Reserve is to do what it takes to get inflation under control, even if it means pain for the economy.
- Pain for the economy will mean pain for equities as earnings are set to decline.
- Disinflation and recession will put the TINA effect into reverse, favoring bonds over equities.
The concept of TINA (There-is-no-alternative) is a strong driving force behind equity markets which has propelled the market higher in recent years. Yields on bond instruments have been low for the better part of the post-GFC era. The result is equity markets, represented by the SPY ETF, has performed over 3x greater than long duration bonds, represented by the TLT ETF over the last 20 years. During this time the average S&P 500 earnings yield has been more than 200 basis points greater than the average rate on the 10 year Treasury.
The recent surge in inflation has caused both bonds and equities to become unstable. As new data continues to indicate a slowing in inflation equity markets have responded with enthusiasm. What they fail to recognize is that inflation is declining because economic growth is declining .
Without monetary easing I believe the economic data suggests that a trend of disinflation and recession will continue. Now that the real yield on the 10-year Treasury is at positive 0.4% this combination of lower inflation and lower growth has the potential to turn TINA on its head .
At Jackson Hole, Federal Reserve Chairman Jerome Powell solidly quashed the probability of a pivot coming soon. Here is what he said:
While higher interest rates, slower growth, and softer labor market conditions will bring down inflation, they will also bring some pain to households and businesses.
We are moving our policy stance purposefully to a level that will be sufficiently restrictive to return inflation to 2%... restoring price stability will likely require maintaining a restrictive policy stance for some time. The historical record cautions strongly against prematurely loosening policy.
In similar color, the day before Jackson Hole St. Louis Federal Reserve President James Bullard said this:
A baseline would probably be that inflation will be more persistent than many on Wall Street expect, and that's going to be higher for longer and that's a risk that is underpriced in markets today.
A few days before that Minneapolis Federal Reserve Bank President Neel Kashkari had this to say about inflation:
When inflation is 8% or 9%, we run the risk of un-anchoring inflation expectations. We definitely want to avoid allowing that situation to develop. So with inflation this high for me, I'm in the mode of wanting to err on making sure we're getting inflation down and only relax when we see compelling evidence that inflation is well on its way back down to 2%.
Then, on Monday, Kashkari said this regarding the market's volatile reaction to the Jackson Hole speech:
I was actually happy to see how Chair Powell's Jackson Hole speech was received. People now understand the seriousness of our commitment to getting inflation back down to 2%.
Additionally, the United States is approaching midterm elections in November and the Fed is usually keen not to make significant policy changes ahead of elections which can be interpreted as favoring the incumbent party.
Policy makers are prophesying a future of slower growth and lower inflation. If true, bonds may be set to outperform equities in a significant way . It's time to examine the data and discuss how I am preparing my portfolio for this potential setup.
Economic Activity and Growth
ISM Manufacturing Index
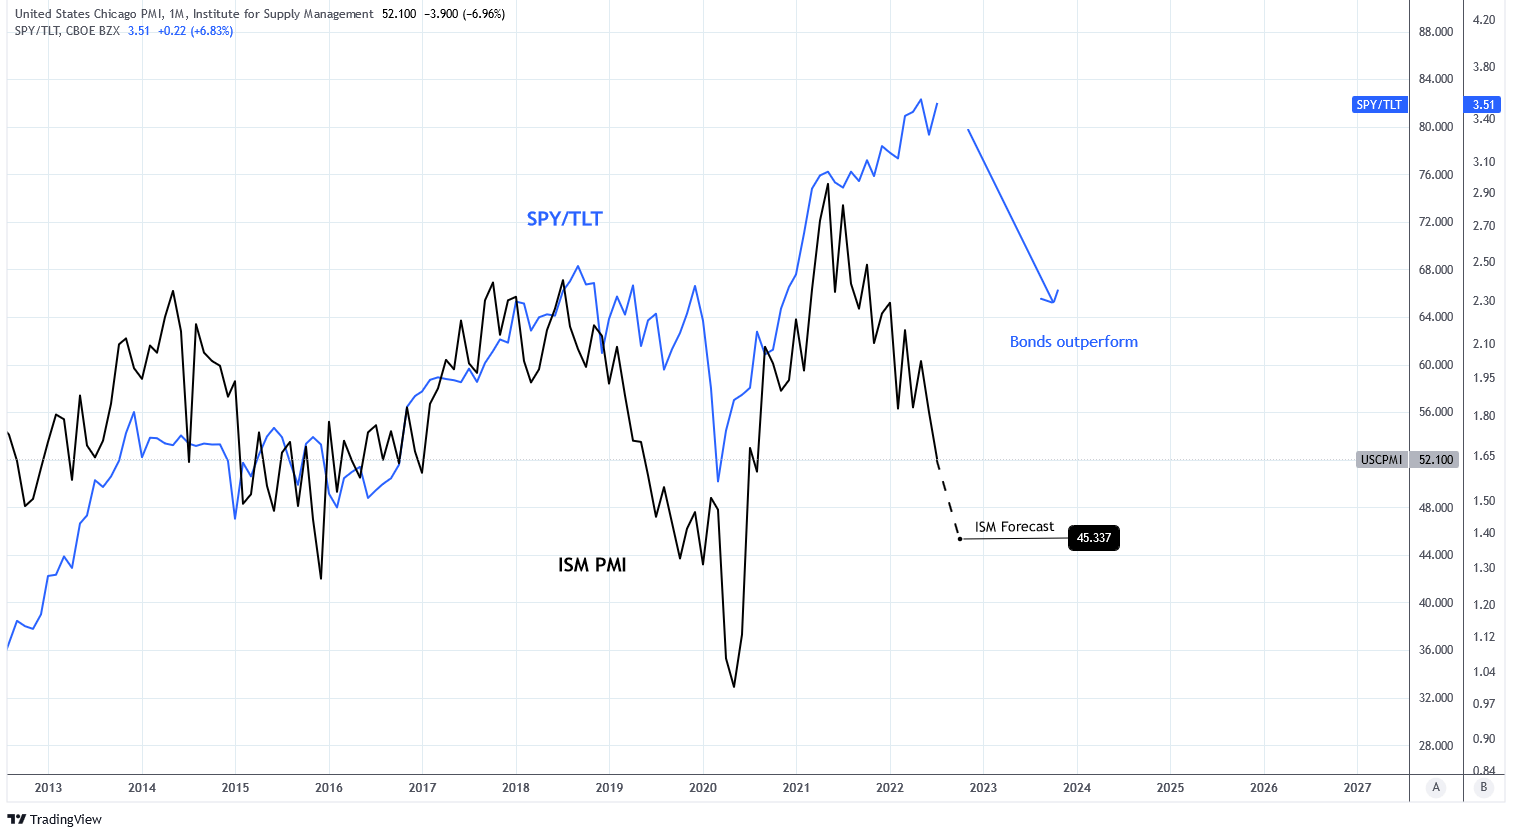
The Institute of Supply Management (ISM) Manufacturing Purchasing Managers Index (PMI) Report is an indicator of economic activity. It aims to measure changes in industrial productivity with a number above 50 indicating economic expansion while a number below 50 indicates contraction.
Today, the PMI stands at 52.2 but the intermediate trend is down and suggesting contraction is approaching. The difference between ISM New Orders and ISM Inventories is a leading indicator of the PMI. That metric stands at -9.3 which suggests a future PMI of about 45. The ISM Regional Fed Surveys are forecasting a future PMI of 41-42.
The PMI is correlated with the performance of equities over bonds, as represented by SPY divided by TLT as shown in the chart below. Equities outperform as PMI rises and bonds outperform as PMI falls. Since 2021 PMI has been falling but equities have continued to outperform. This suggests that a restoration of this relationship favors bonds over equities unless the PMI trends higher. The latter is unlikely with continued monetary tightening.
Charts by TradingView (adapted by author)
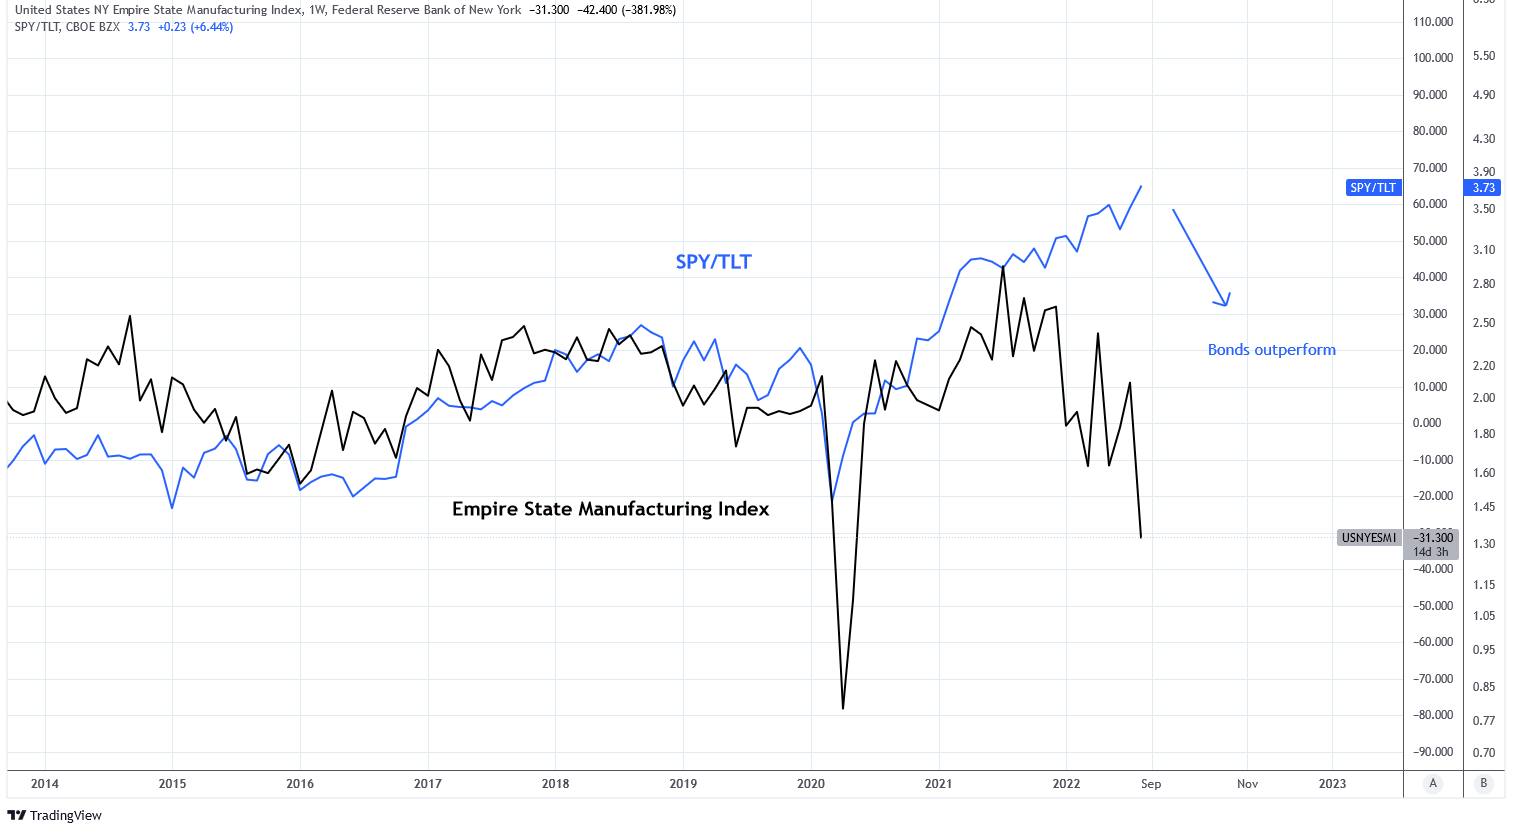
Empire State Manufacturing Index
The Empire State Manufacturing Index is another reliable proxy of economic growth which surveys manufacturers in New York State. Again, a higher index number corresponds with equities outperforming bonds and vice versa. The index has fallen sharply to -31.3 and yet bonds have not outperformed.
Charts by TradingView (adapted by author)
ESM new orders minus ESM inventories has fallen to -36.0, the second lowest since 2002. This metric is forecasting the Index will fall below -45.0.
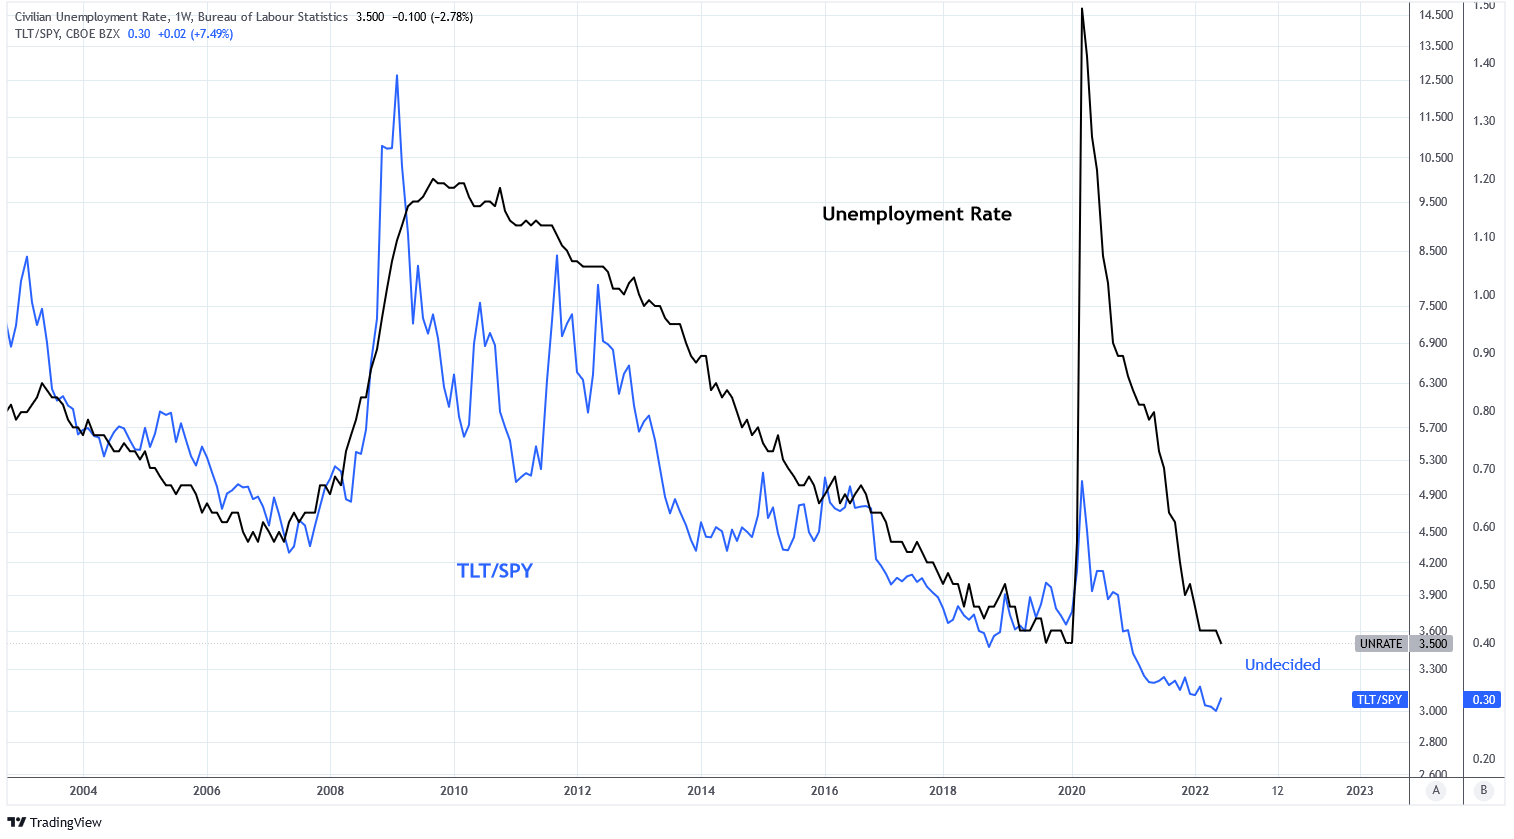
Employment
A strong job market is a sign of economic growth. However, employment lags behind the economy. The U.S. unemployment rate is very low at 3.5% which supports equity performance.
Charts by TradingView (adapted by author)
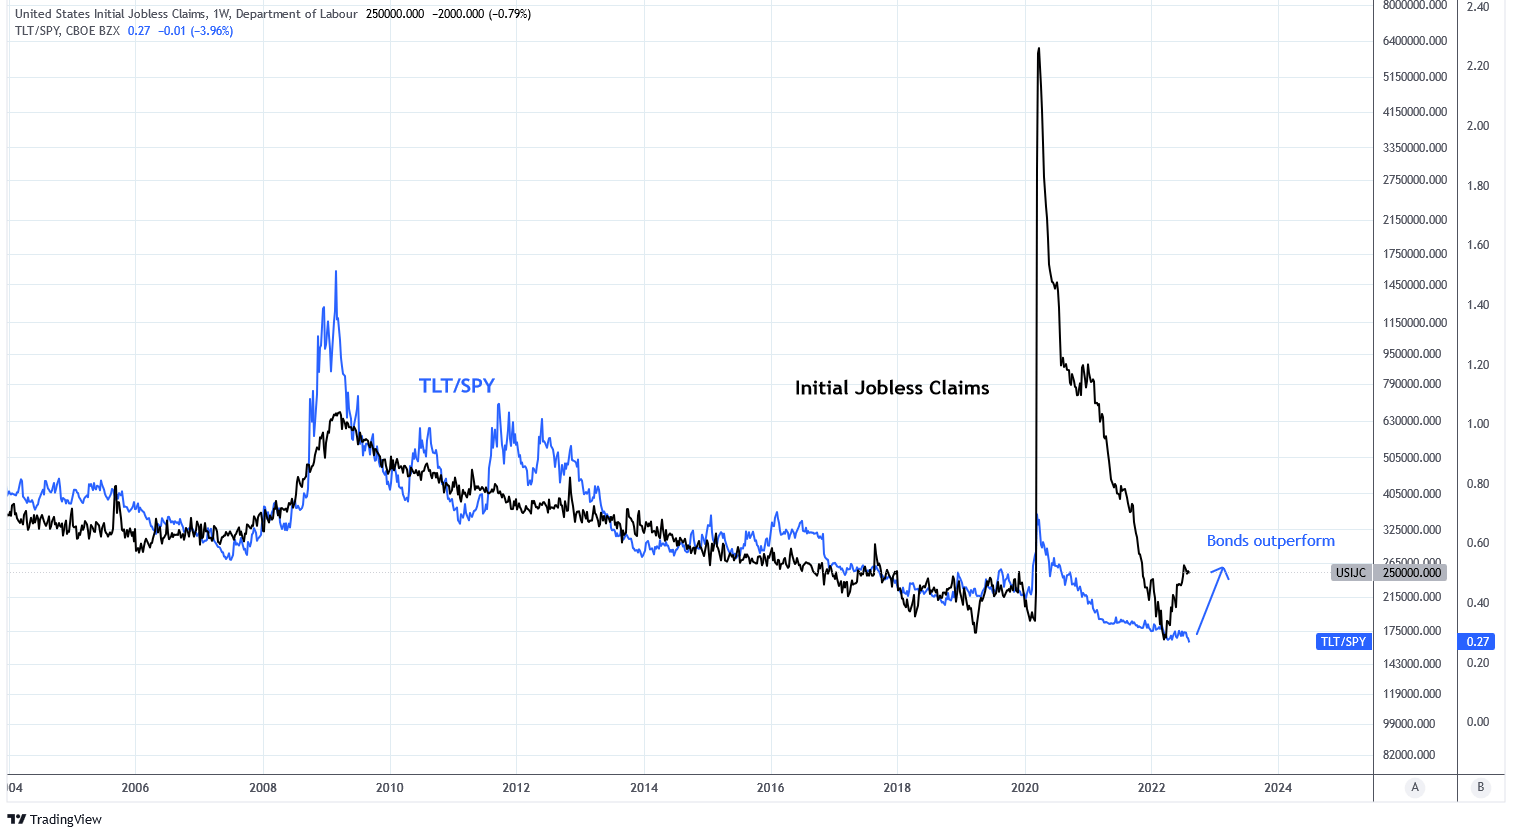
But a closer look shows that initial jobless claims is hinting at the start of economic weakness and is forecasting that bonds may begin to outperform equities.
Charts by TradingView (adapted by author)
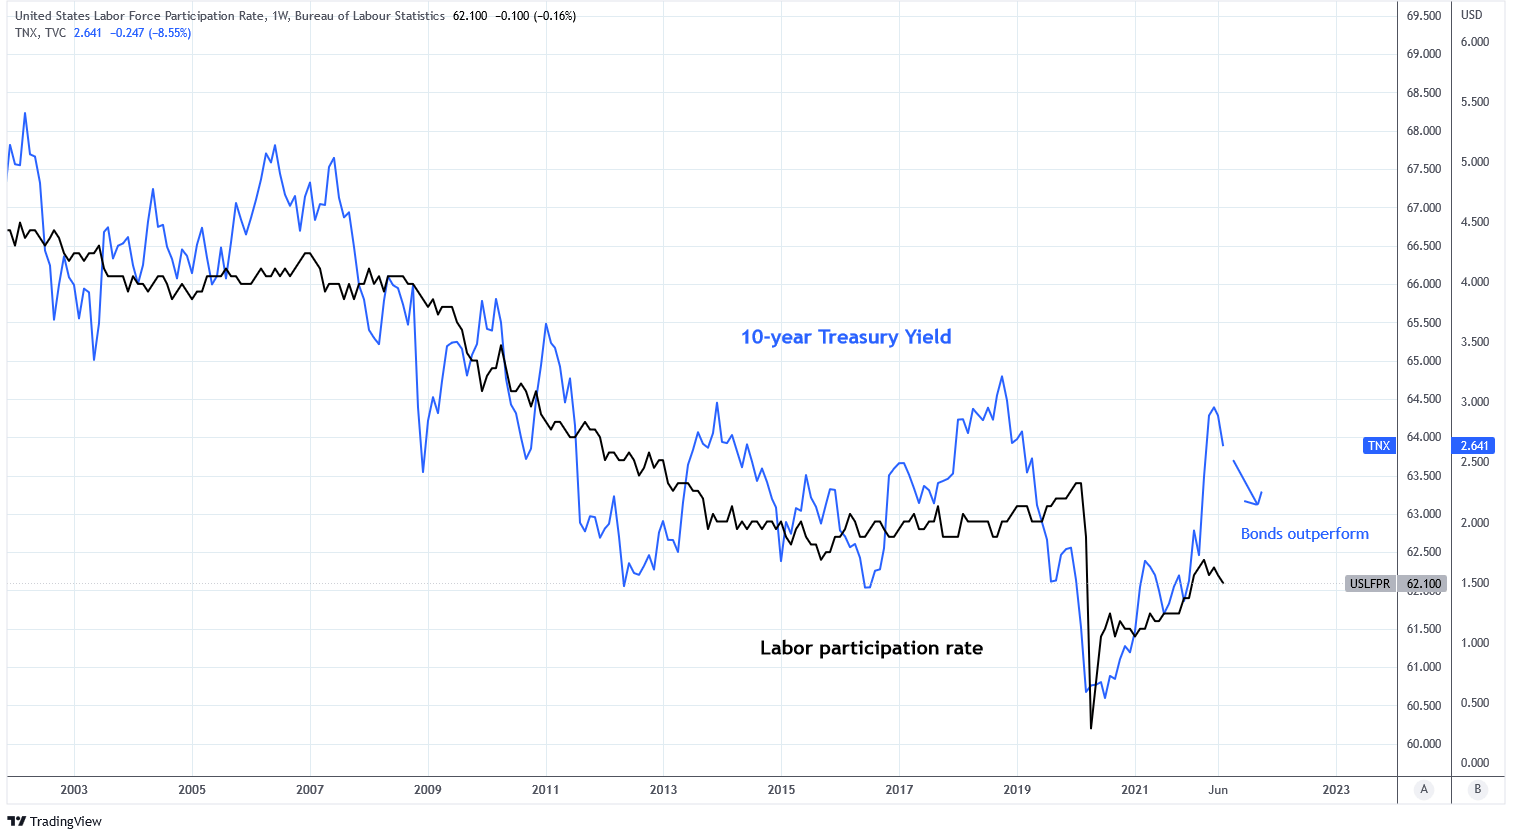
Another way to view employment is in the context of the labor force participation rate. The United States is like many other developed nations in that its population is aging. As a result, the labor participation rate has been descending over time. This trend compels interest rates to move lower to maintain financial stability. Today, the rate on the 10-year Treasury is 3.1% which is in excess of its relationship with the LFP rate. Restoration of this relationship implies lower rates (and higher bond prices) or higher labor force participation rates.
Charts by TradingView (adapted by author)
Higher LFP rates will be difficult to achieve when businesses are planning on widespread job cuts. This Bloomberg survey found that more than half of businesses are planning job freezes or cuts. Still, there are jobs to spare as the ratio of non-farm job openings to unemployed persons stands at 1.98, the highest in 20 years. This is one of the reasons I think the Fed will be hesitant to pivot too early.
NAHB Housing Market Index
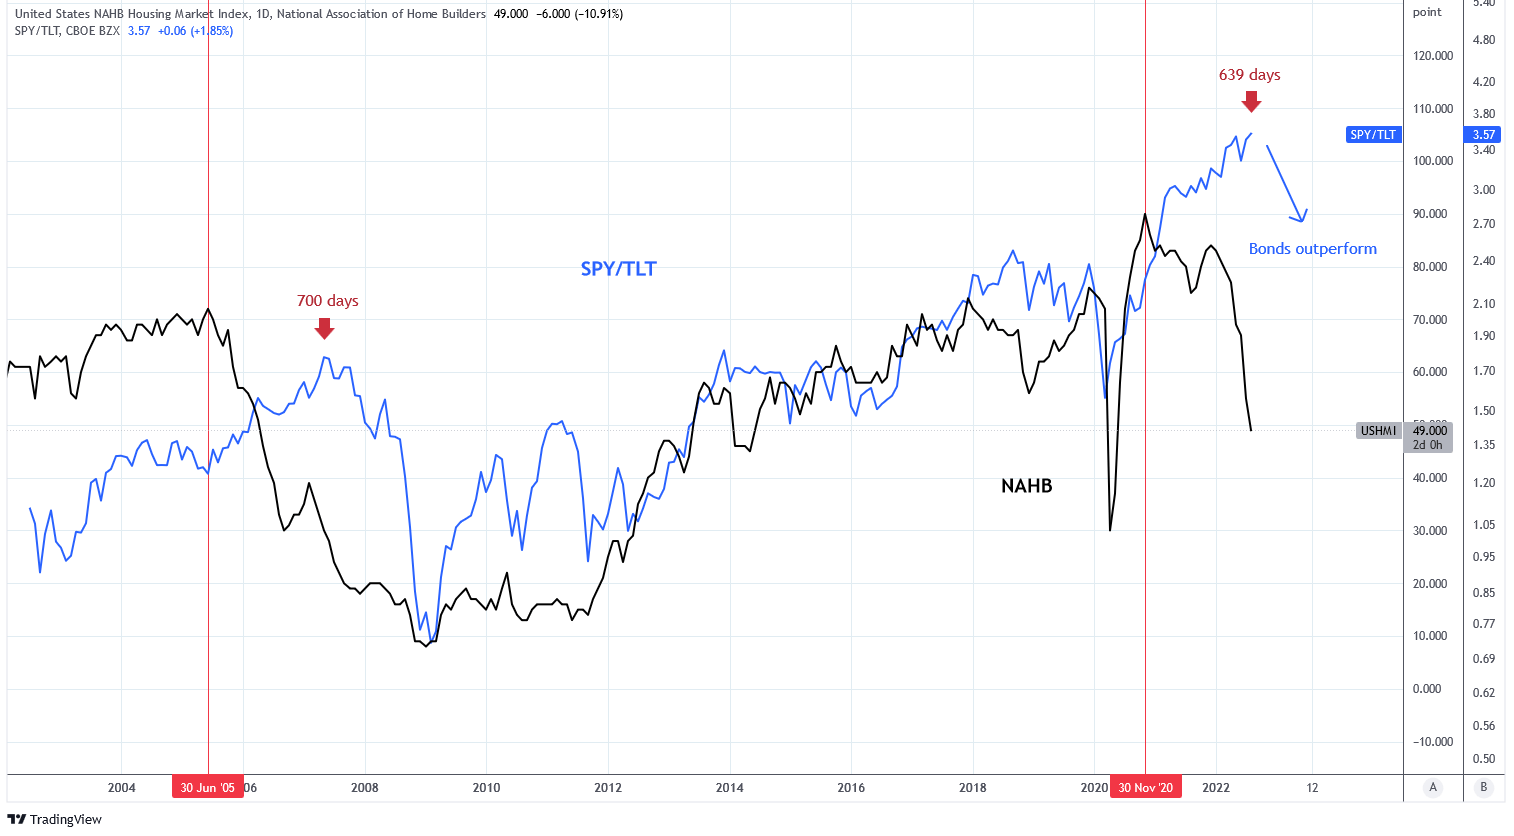
Housing is a crucial component of the U.S. economy. This is why the National Association of Home Builders Housing Market Index is correlated with the performance of equities over bonds.
There is now a wide divergence between the index and SPY/TLT. Notice in the chart below that in 2005 the NAHB peaked 700 days ahead of the SPY/TLT. Then, over the following two years the relationship between NAHB and SPY/TLT was restored. Similarly, today these metrics have been diverged for 639 days and the NAHB has already dropped. One cause of the delayed divergence in 2006-07 is similar to a cause today: commodities .
Charts by TradingView (adapted by author)
DXY
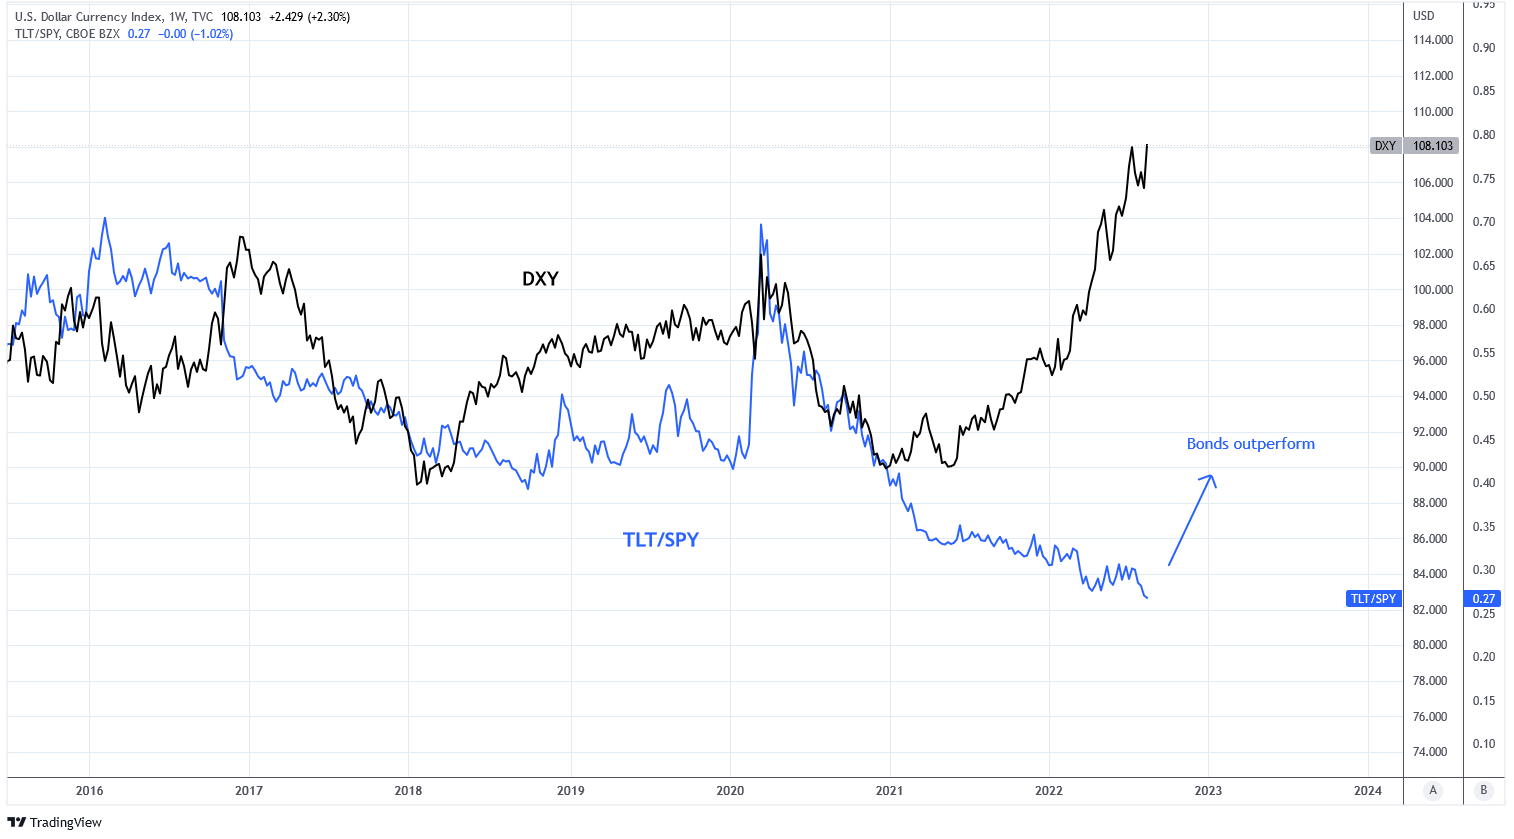
A rising U.S. Dollar Index is not a sign of healthy economic activity. First, the dollar is a safe haven during periods of economic turbulence and uncertainty, thus stronger demand for dollars is indicative of market sentiment. Secondly, a strong dollar is a headwind for global growth .
As a result, the DXY has a loose correlation with the TLT/SPY. The DXY has been exponentially rising since 2021 while bonds continue to underperform equities creating a large divergence. This relationship implies that either the DXY will decline significantly or bonds will outperform equities.
Charts by TradingView (adapted by author)
Copper-Gold Ratio
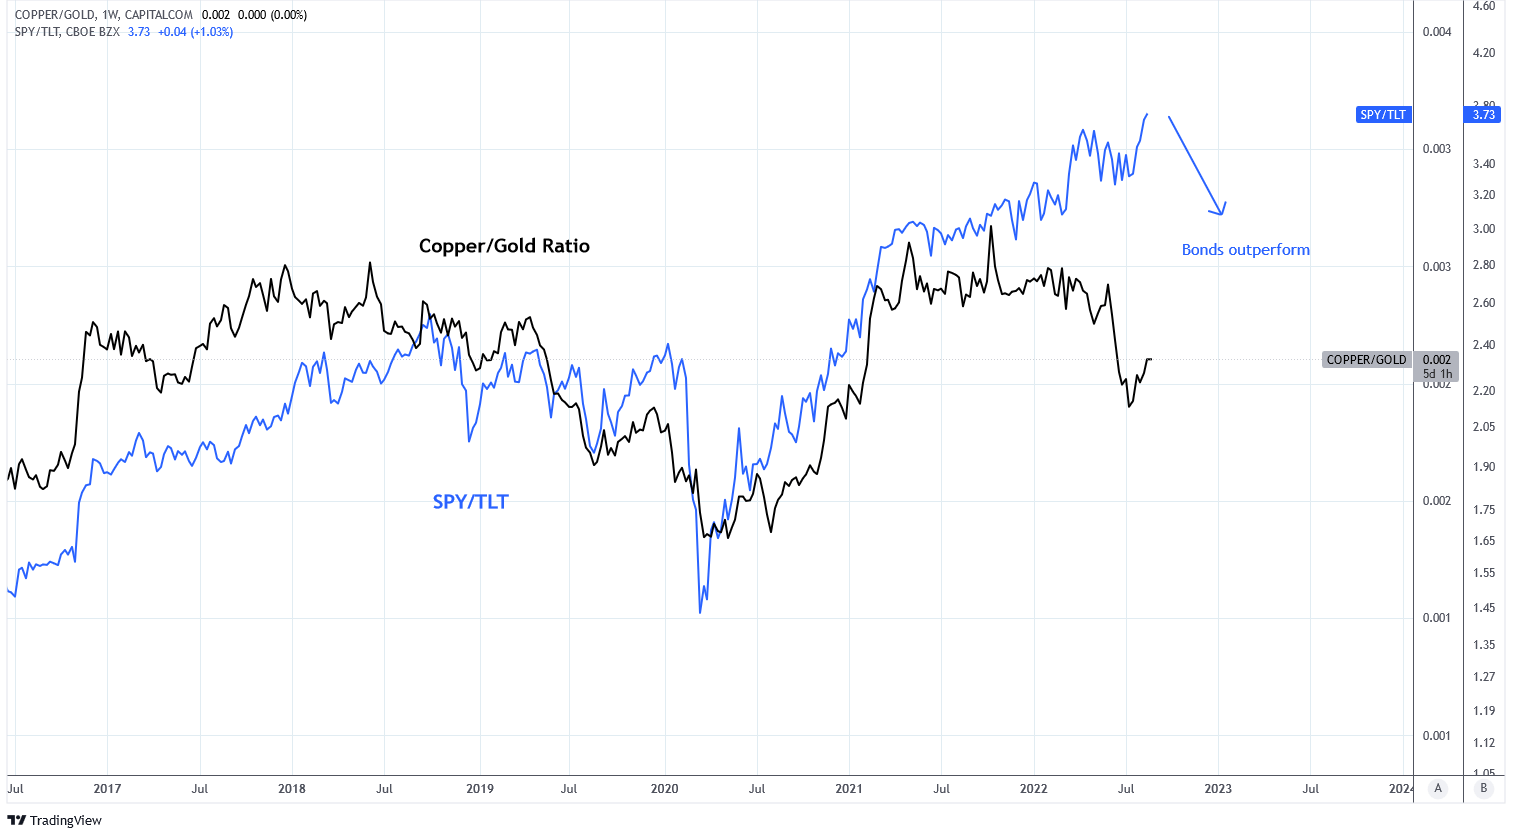
The ratio of the price of copper to the price of gold has a reliable history of indicating periods of economic strength or weakness. Copper is an industrial metal which increases in price when industrial demand rises. Gold is a monetary metal insignificantly subject to industrial demand and is demanded during risk-off periods in markets.
Due to these properties, the direction of the copper-gold ratio often forecasts the direction of interest rates. As a result, the ratio is moderately correlated with the SPY/TLT. Beginning in June this year the ratio declined while equities continued to outperform bonds. Restoration of this relationship implies bond outperformance, higher copper prices, or lower gold prices.
Charts by TradingView (adapted by author)
Global Shipping
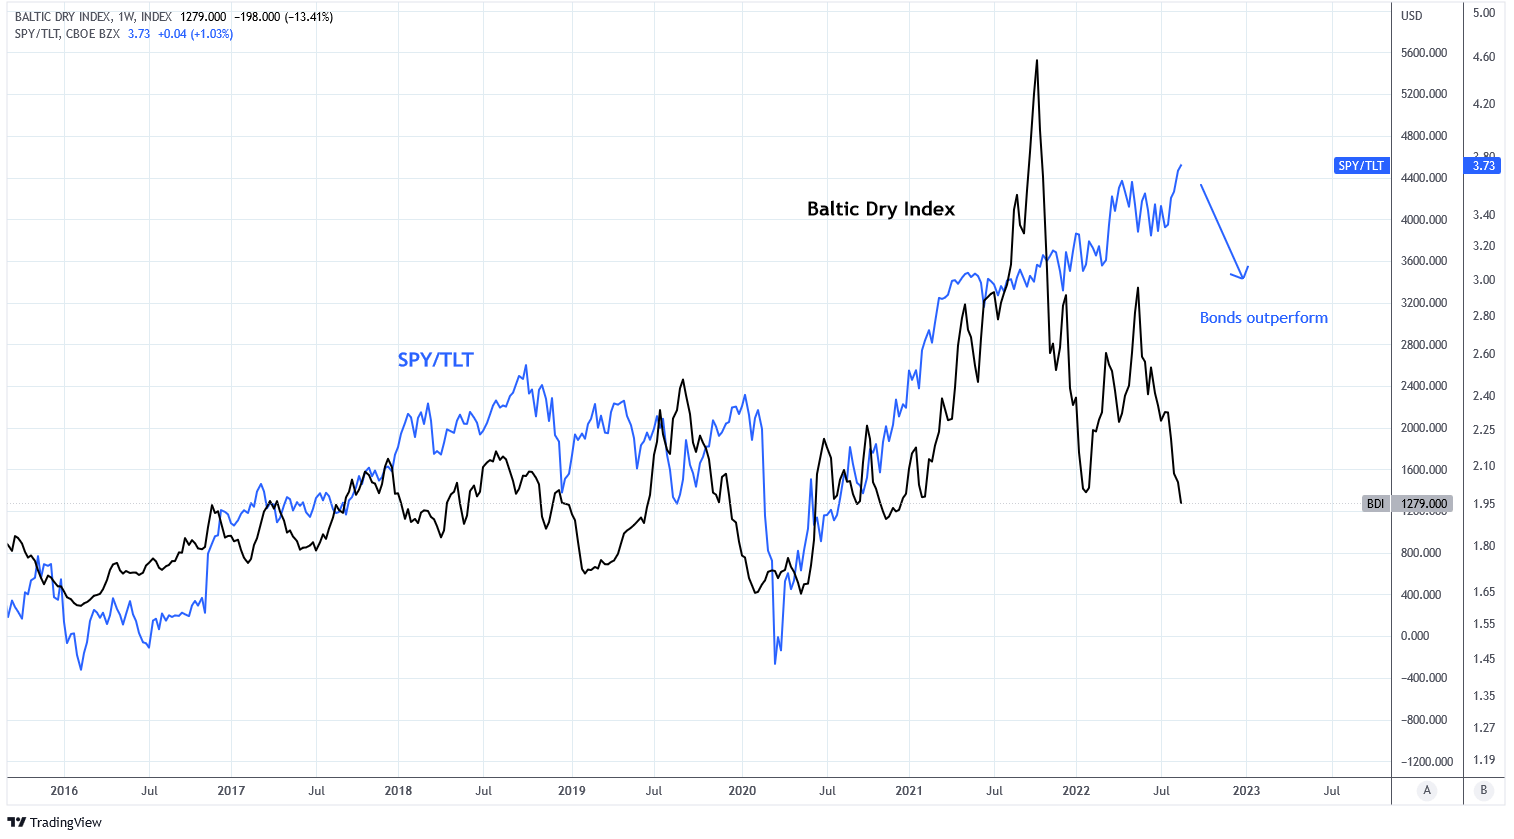
Global shipping conditions are of unique significance to the relationship between bonds and equities. This is because shipping rates reflect both inflation and economic activity . Shipping rates are influenced by input costs, primarily energy, and also constitute a substantial cost component of goods that ship around the world. As a result, few goods are unaffected by shipping.
Declines in shipping rates result in lower inflation and are indicative of slower economic growth. The Baltic Dry Index is a freight-cost index used as a proxy for dry bulk shipping costs. The index is a good indicator of overall shipping cost. It makes sense, then, that the BDI is correlated with the SPY/TLT. The BDI has declined from a peak of 5,600 in October 2021 to 1,082 in August 2022. This trend implies that the BDI returns to 2021 levels or bonds outperform equities.
Charts by TradingView (adapted by author)
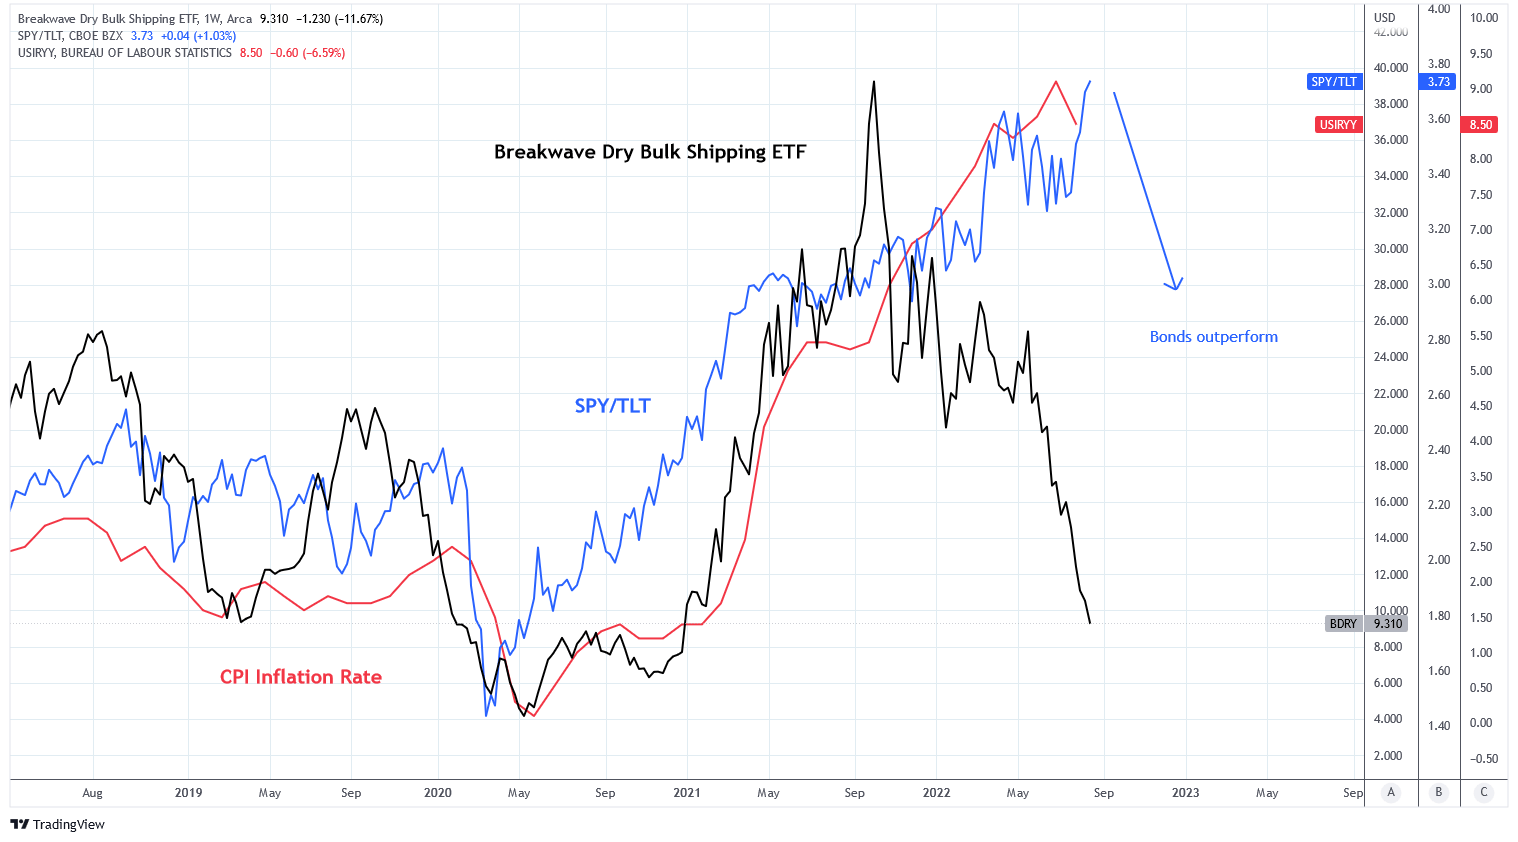
Similar to the BDI the Breakwave Dry Bulk Shipping ETF maintains a portfolio of shipping futures on dry bulk freight. The fund tends to correlate with both inflation and the SPY/TLT. The fund has declined from a peak of $41 in October 2021 to $7.86 in August 2022. This trend implies that shipping costs return to 2021 prices or inflation declines and bonds outperform.
Charts by TradingView (adapted by author)
Financial Stability and Risk Behavior
Financial Conditions Index
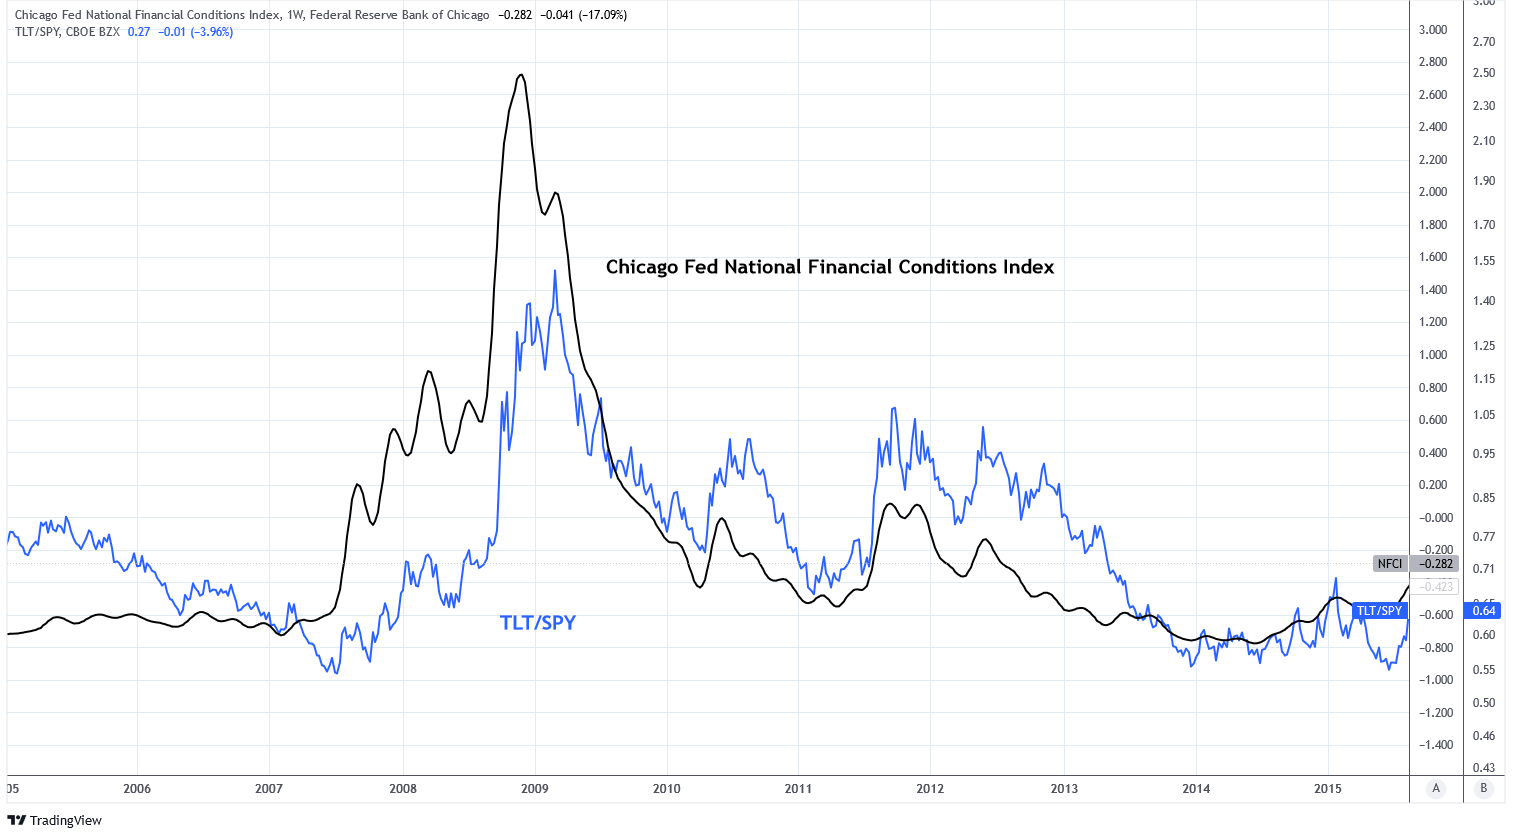
The Chicago Fed's National Financial Conditions Index tracks financial conditions in the U.S. with positive values indicating tighter than usual financial conditions. We can examine that from 2006-2015 the index has been loosely correlated with the performance of bonds over equities. This is because risk-off behavior typically accompanies tighter financial conditions which suggests slower growth.
Charts by TradingView (adapted by author)
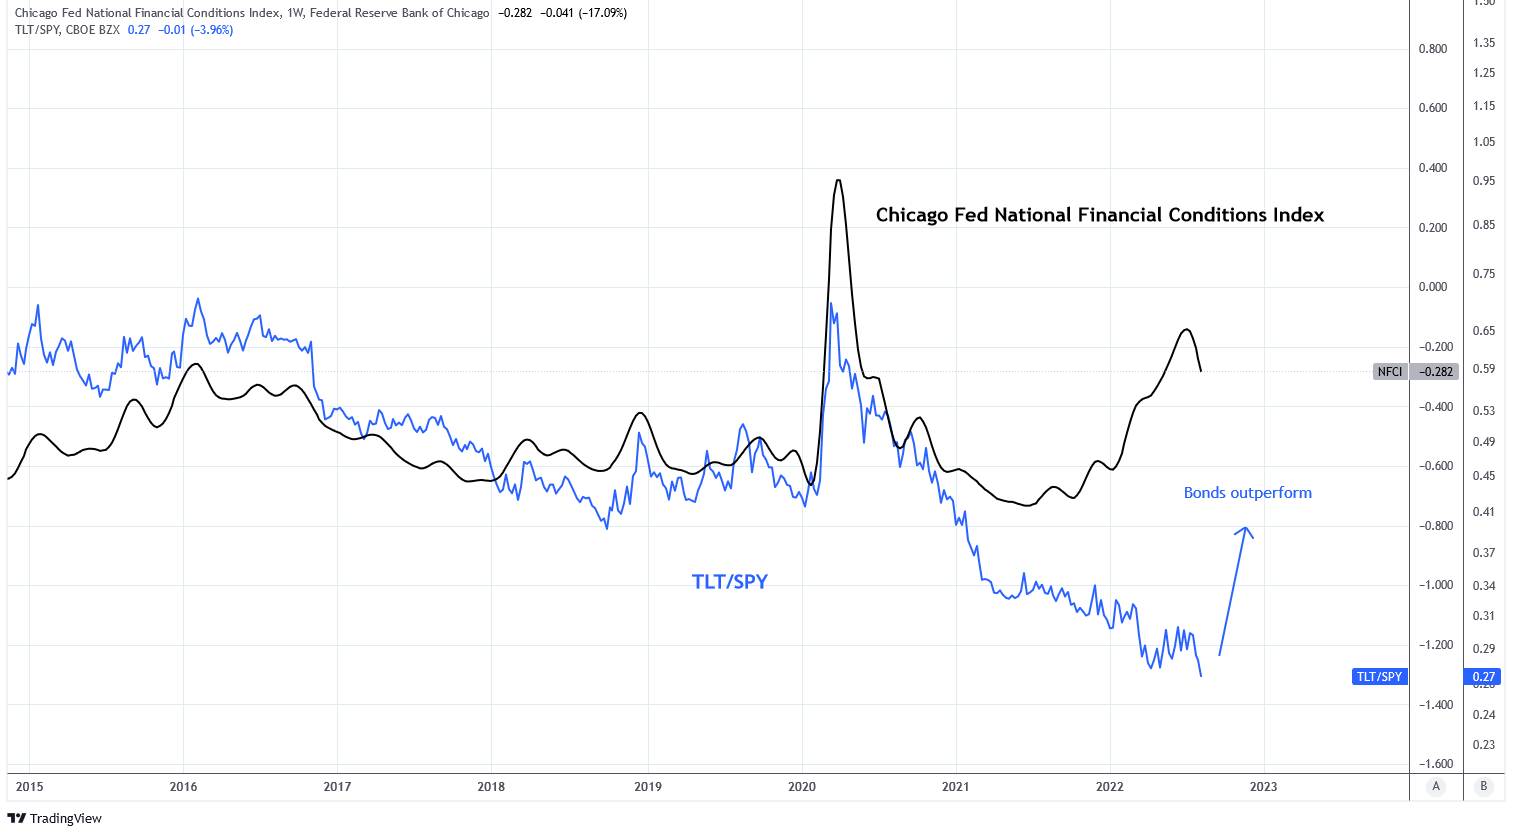
Since the start of the year financial conditions have become increasingly tighter, the tightest since 2020, and yet bonds have not outperformed equities. A restoration of this relationship suggests that bonds outperform equities unless conditions loosen. The latter is unlikely with continued monetary tightening.
Charts by TradingView (adapted by author)
MOVE Index
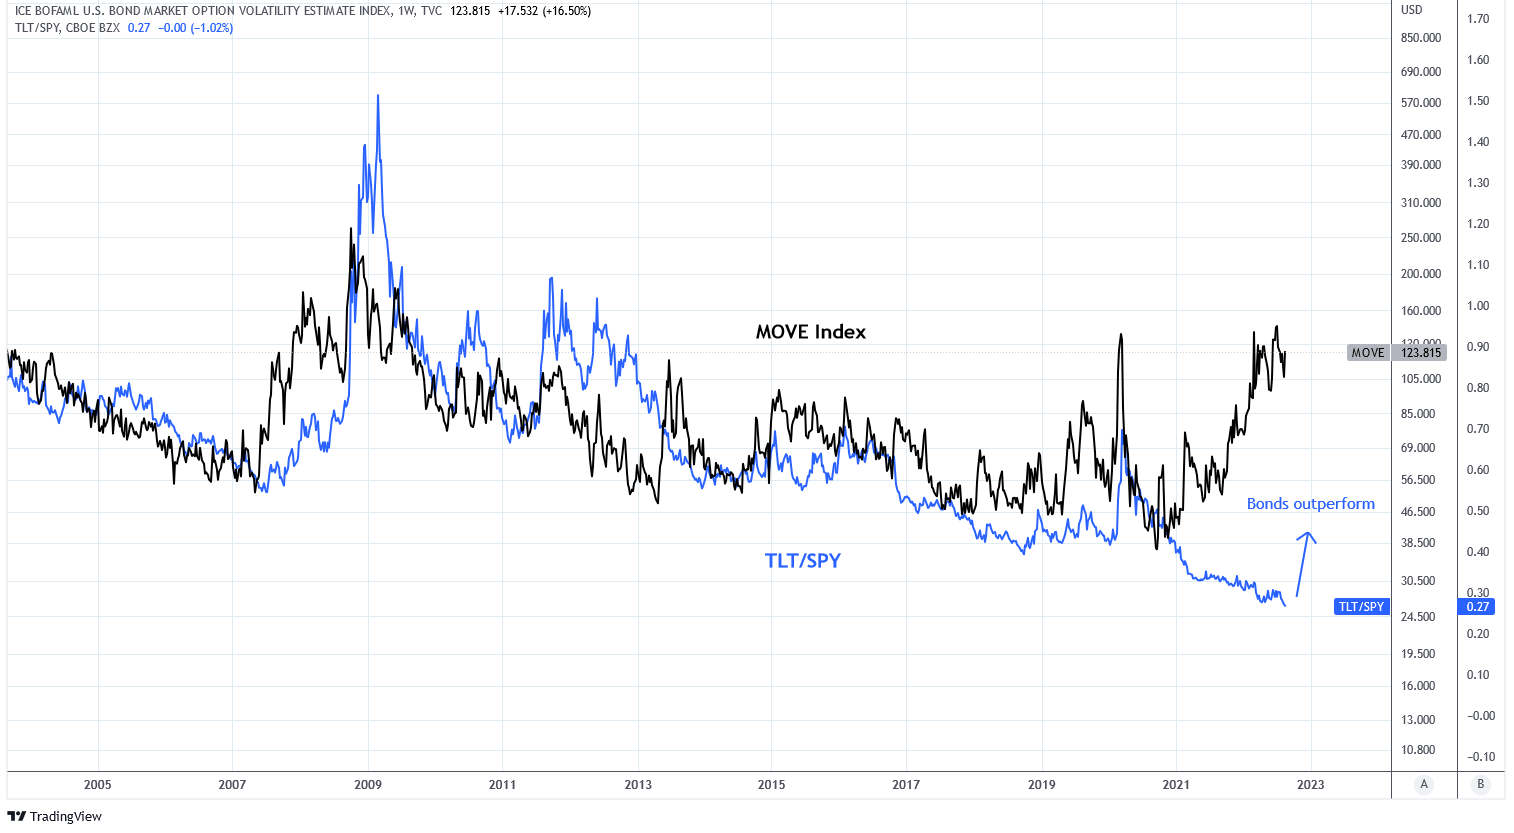
The Merrill Lynch Option Volatility Estimate, or MOVE Index, is similar to the VIX but measures short dated volatility in bonds, not equities. This index is typically coincidental but it is correlated with the TLT/SPY. A surprisingly wide divergence has emerged in this relationship. The last time the MOVE rose this much more than TLT/SPY was in 2007. The divergence implies that the MOVE will decline or bonds will outperform.
Charts by TradingView (adapted by author)
Federal Reserve Assets
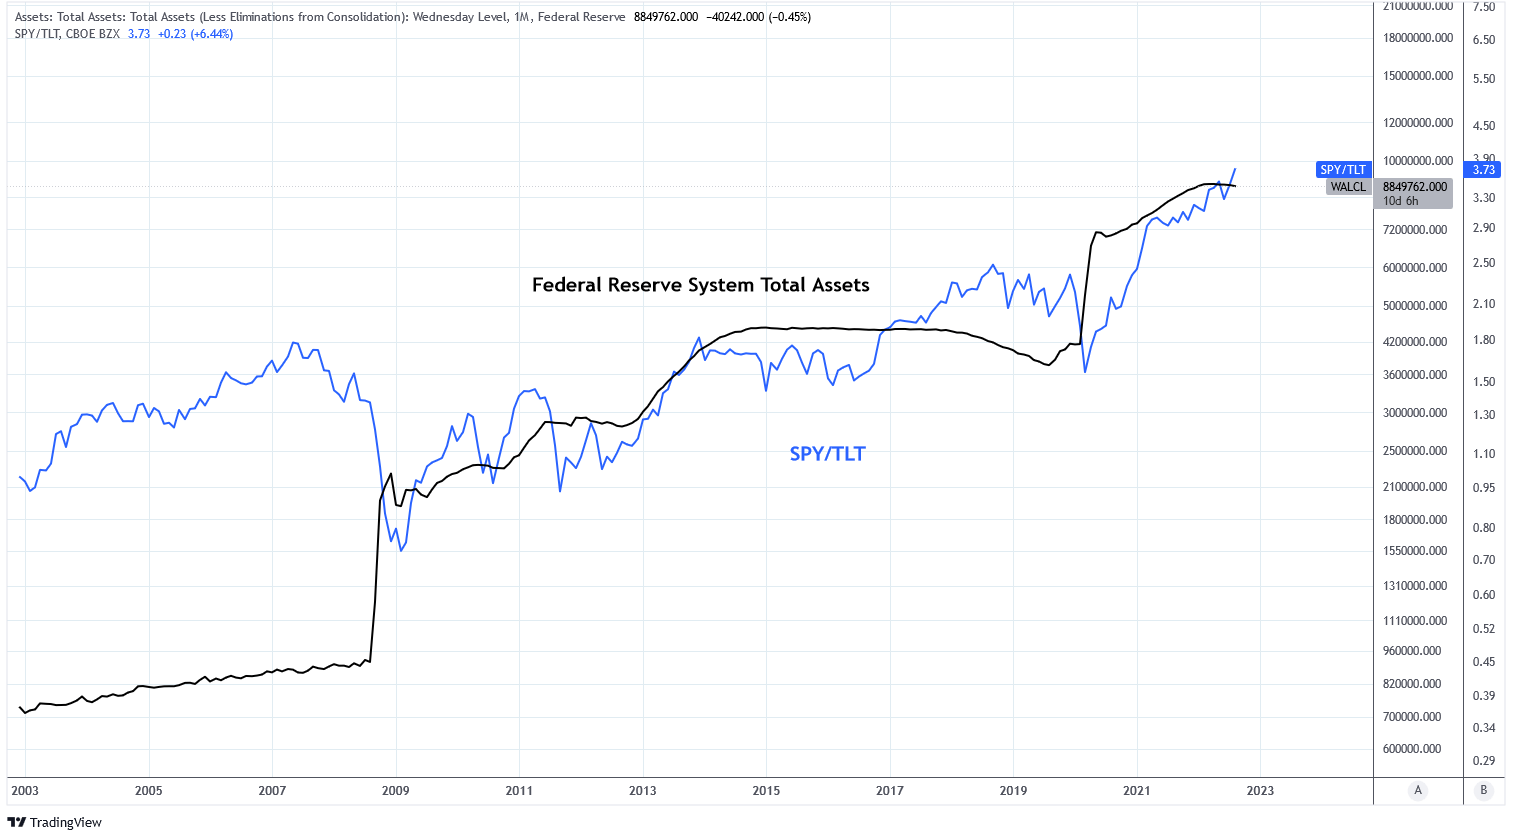
Since the Great Financial Crisis of 2008 the balance sheet of the Federal Reserve System has been in flux between periods of quantitative easing which raises the balance sheet and quantitative tightening which lowers the balance sheet. Since June the Fed has been reducing the balance sheet.
Notice how FRS total assets correlates with SPY/TLT since the GFC. Significant divergences between the two have consistently been followed by a return to trend. Typically, a lower balance sheet has favored bonds.
Charts by TradingView (adapted by author)
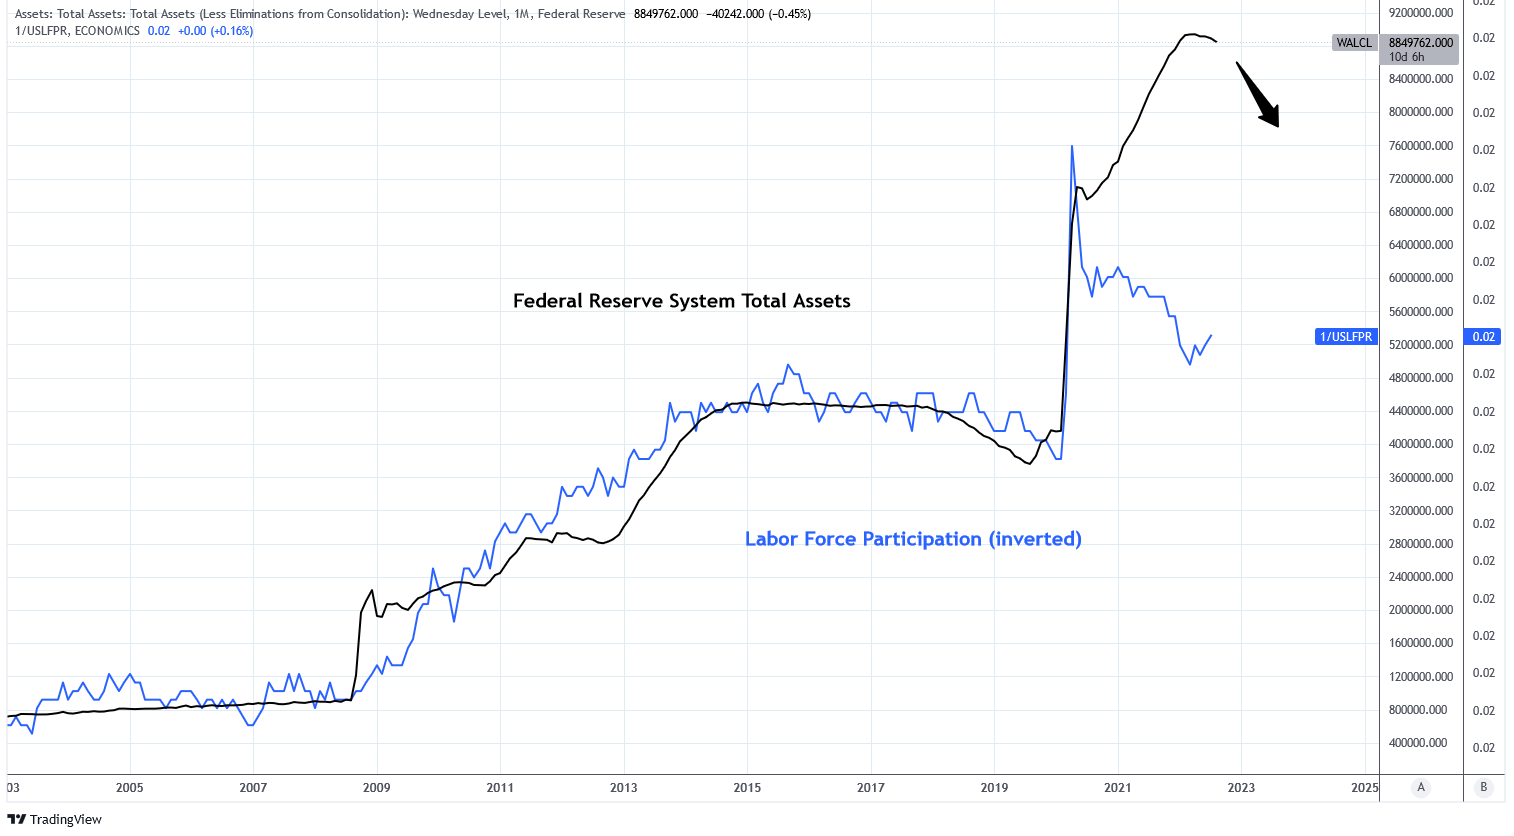
The balance sheet is negatively correlated to labor force participation rate. The demographic issues caused by an aging population is being offset by an increase in liquidity to keep the financial system in balance. While the long term trend continues to be lower labor force participation, and thus a higher balance sheet, the current balance sheet has outpaced labor force participation and is overdue for this reduction. This is another reason that I think the Fed will hesitate to pivot too early.
Charts by TradingView (adapted by author)
Inflation and Interest Rates
Commodities
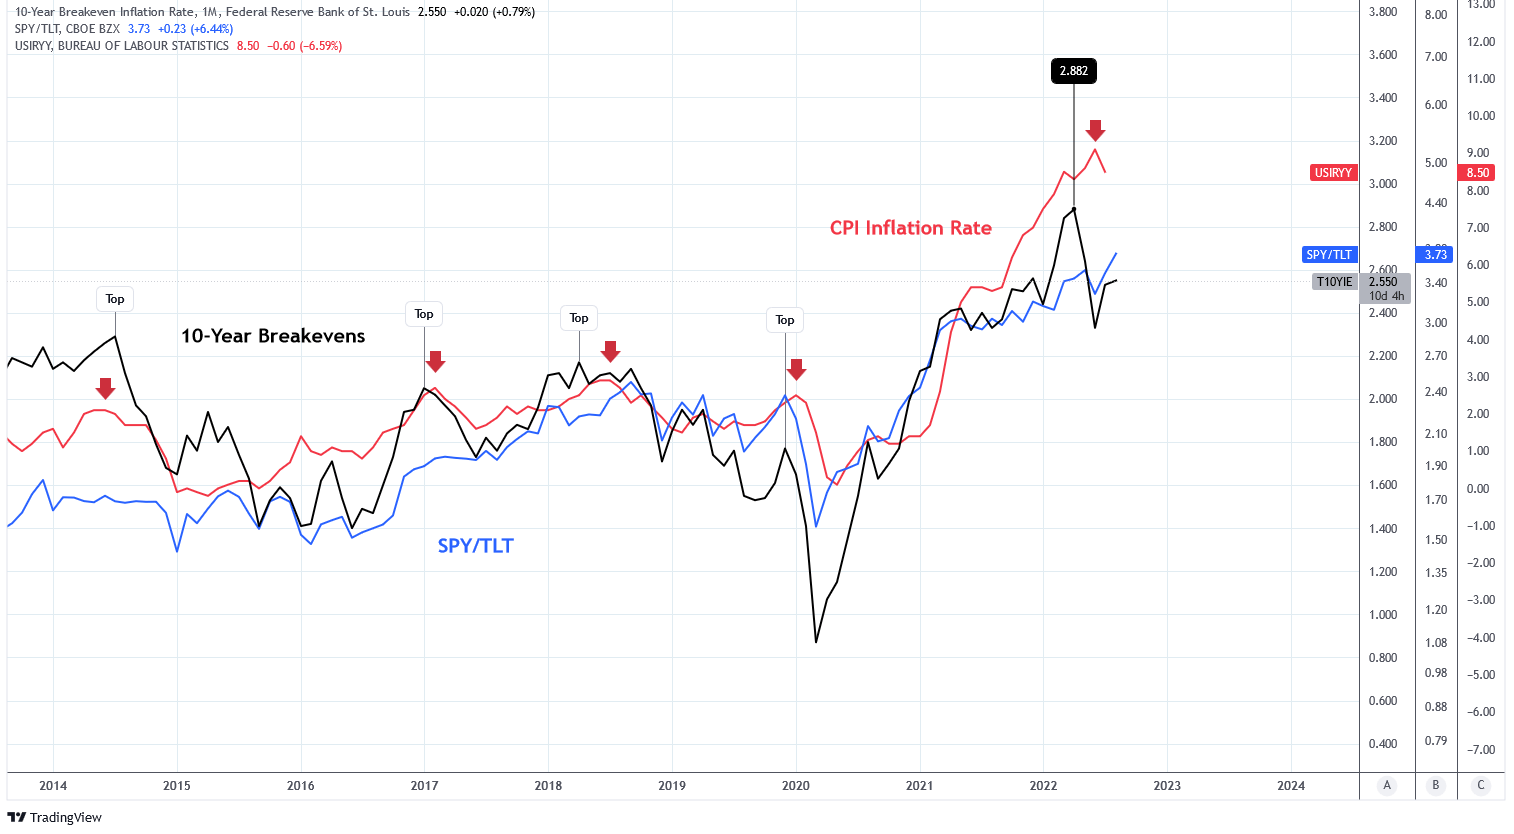
While a potential Fed pivot is one reason that equities are outperforming bonds in the face of these growth concerns, another reason is the probability of increased inflation. Higher inflation favors equities over bonds. Notice how the 10 year treasury breakeven rate (the market's expectation for future inflation) and CPI (a measure of past inflation) correlate to the SPY/TLT. Often, the breakeven rate peaks prior to a peak in CPI inflation. The 10 year treasury breakeven peaked at 3% in April 2022.
Charts by TradingView (adapted by author)
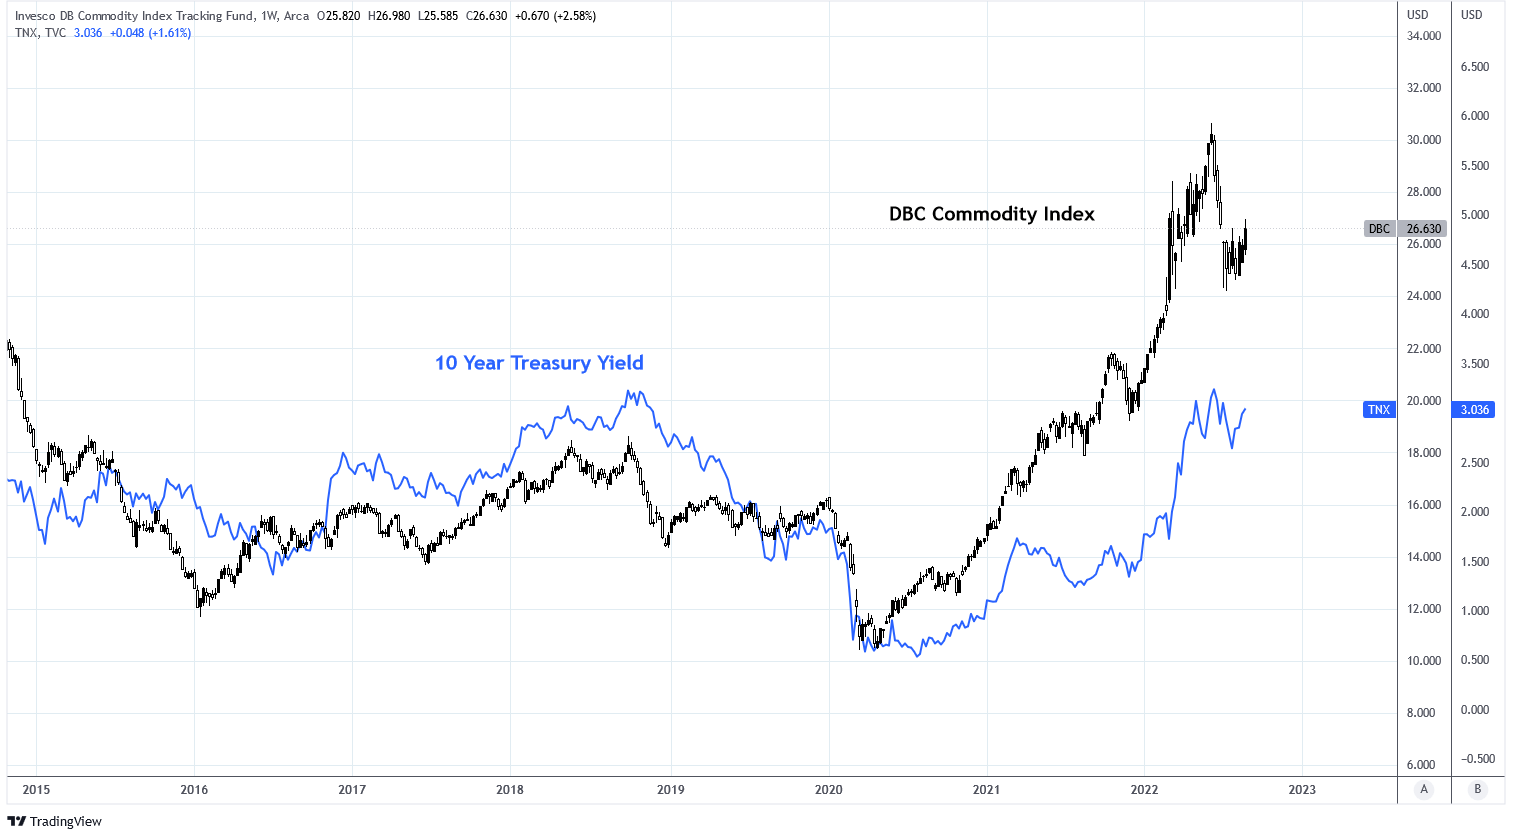
The issue for rates is that commodities continue to persist. The Invesco DB Commodity Index ( DBC ) has consolidated from a recent high in June but is beginning to climb higher again on rising energy and agriculture commodities.
Charts by TradingView (adapted by author)
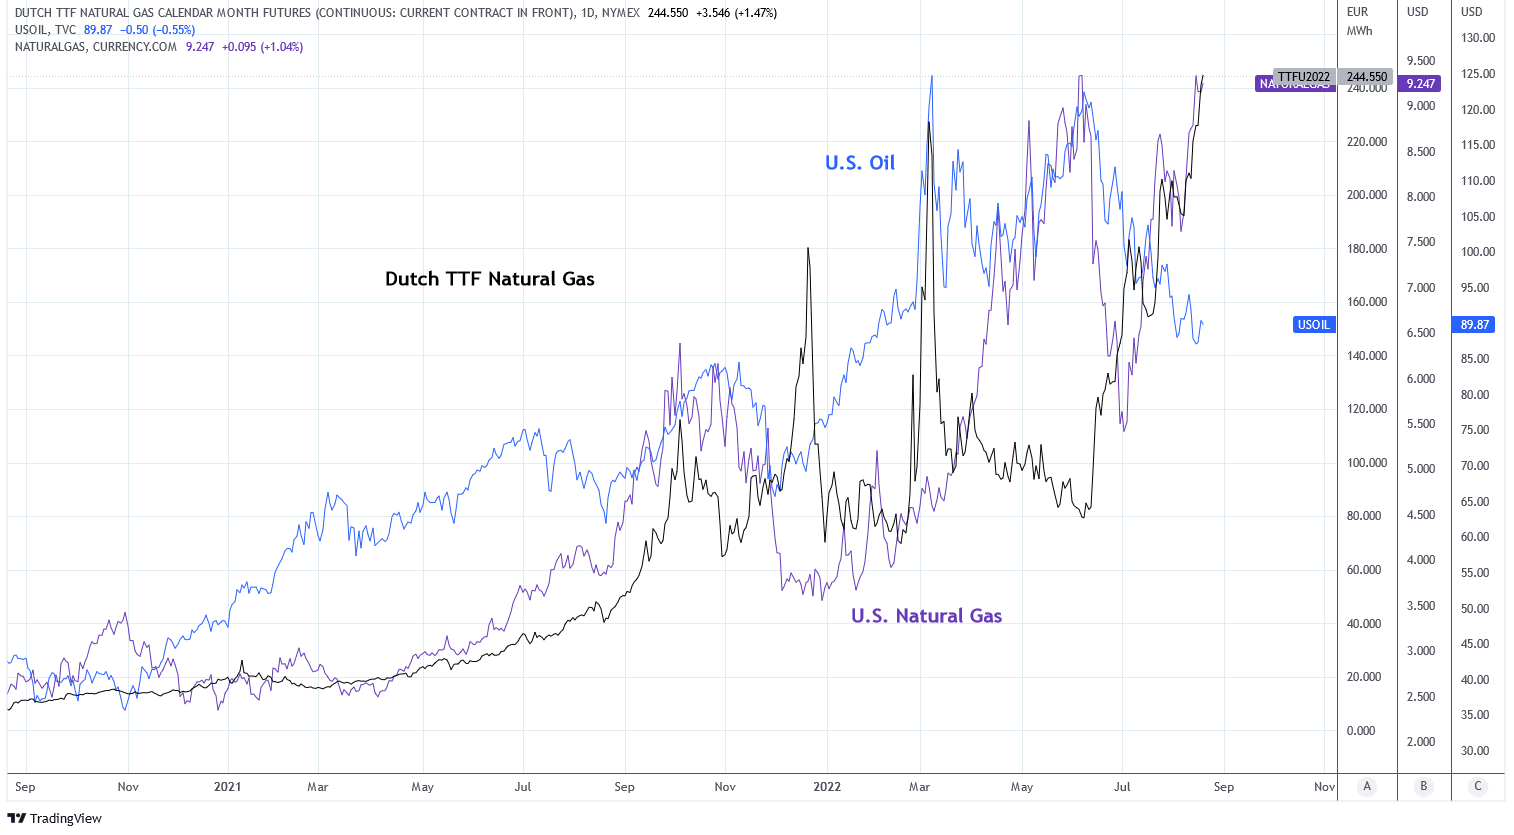
Of particular importance is natural gas which continues to skyrocket higher in the U.S. and Europe. For inflation expectations to materially decline, these energy commodities will need to exhibit weakness.
Charts by TradingView (adapted by author)
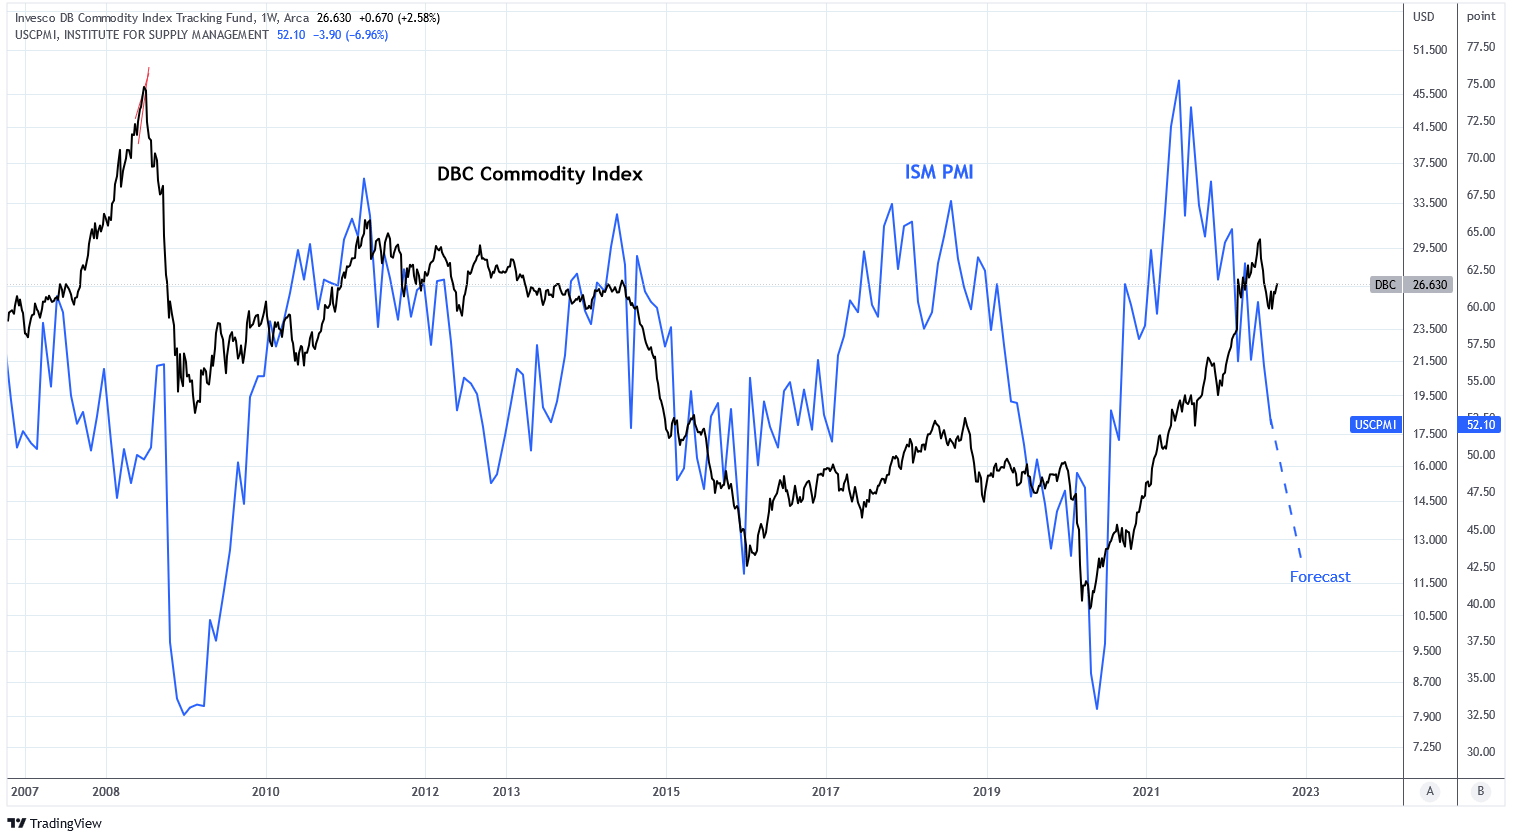
Today, a phenomenon similar to that of 2008 is underway. Despite declining economic indicators, as represented by the ISM PMI, commodity prices continue to move higher. Rising commodity prices in 2008 were the result of an oil market shock driven by accelerating demand from India and China. Today, its driven by a natural gas market shock due to the Ukraine war and an oil market shock due to damage to supply and demand fundamentals from COVID lockdowns. It's possible that energy prices continue to make new highs for several more months. However, in 2008 the Baltic Dry Index peaked 1-2 months ahead of the oil price. The BDI peaked in October 2021 and oil has not reached its high in March 2022 which reacted to the Russian invasion of Ukraine. Without that geopolitical event its possible oil would have topped sooner.
Charts by TradingView (adapted by author)
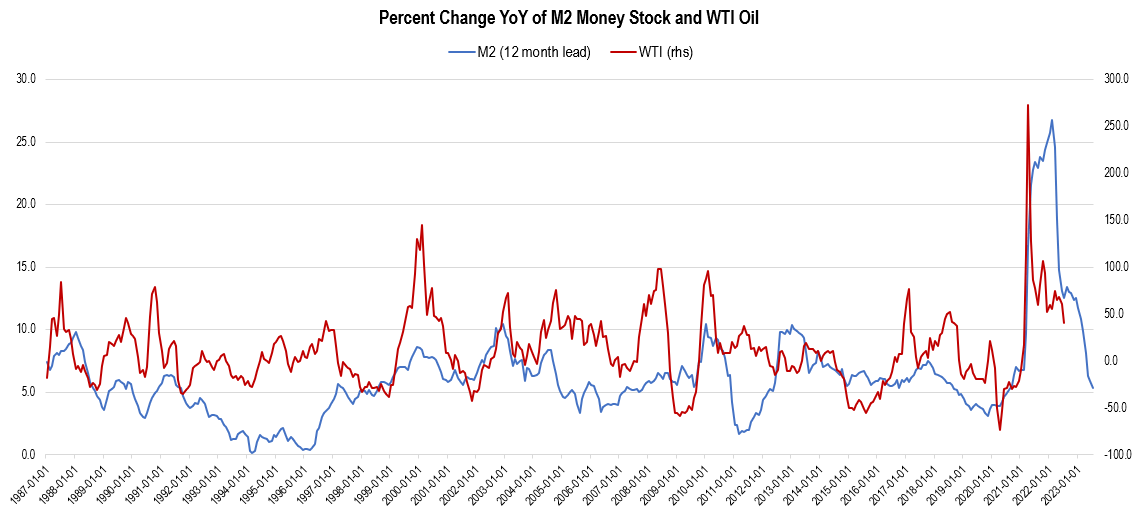
However, spikes in oil price often accompany surges in money stock. Changes in the M2 money stock measure tend to lead these changes in oil price by about 12 months. Today the M2 money stock growth is falling rapidly and the growth in oil price is tracking along. The relationship suggests, baring other macro events, that oil price growth will continue to fall into 2023 and may even turn negative on a YoY basis.
Chart by author (data from Federal Reserve Economic Data | FRED | St. Louis Fed)
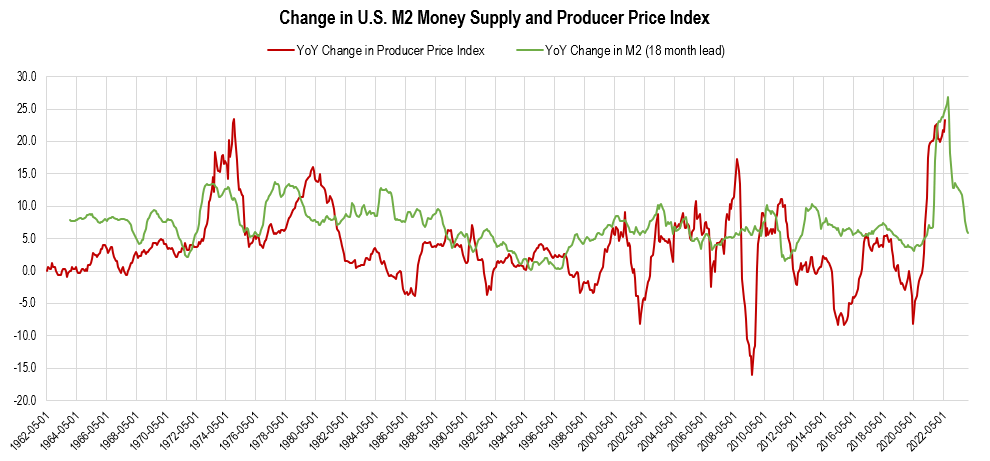
Inflation
Some of the price inflation experienced today is a result of supply chain disruptions that followed COVID lockdowns. But inflation is naturally a result of increased money supply. The M2 money supply spiked in 2021 above 25% YoY. Changes in price inflation, as measured by the Producer Price Index, tends to lag changes in money supply by about 18 months. The PPI is approaching the expected peak in terms of time and magnitude. In fact, M2 is now down since March 2022.
Chart by author (data from Federal Reserve Economic Data)
Lower prices are occurring in ISM and ESM prices paid indices. If these trends continue the consumer price index will follow.
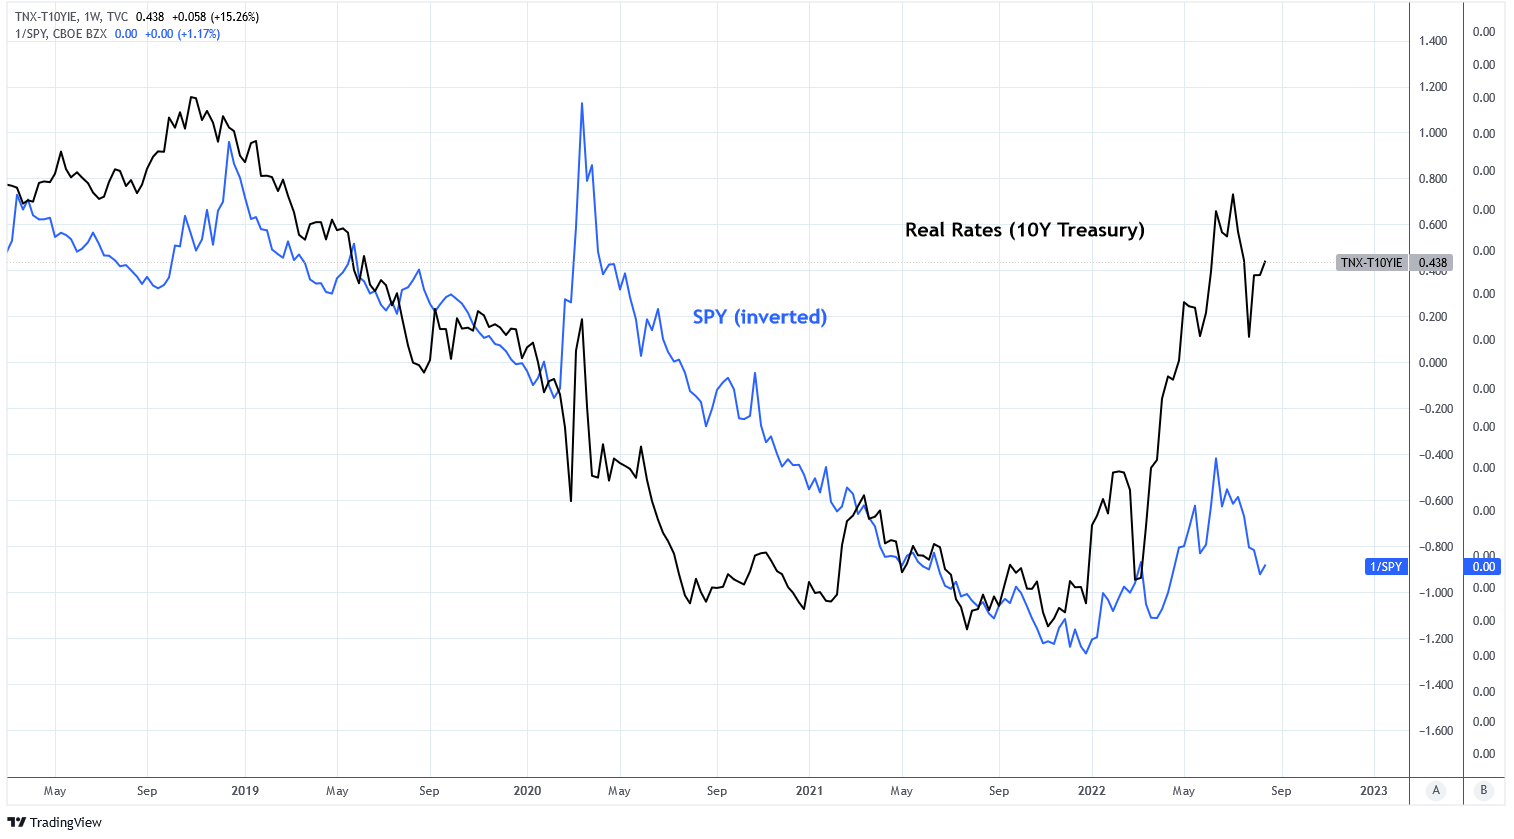
Real Rates
The real yield on the 10 year treasury, measured by the difference between the yield on the 10 year treasury and the 10 year breakeven rate, is at the highest level since 2019 at 0.529%. The last time the real yield was this high the S&P 500 was below 3,000. Provided that earnings are higher than they were in 2019 this level may not be breached.
Charts by TradingView (adapted by author)
Earnings
Leading indicators are not supportive of sustained S&P 500 earnings. Pending US home sales have fallen quickly and are below 2019 levels. Earnings are moderately correlated with home sales.
Earnings are also correlated with ISM Manufacturing PMI which is already at 2019 levels. It is suggesting that quarterly S&P 500 earnings could fall to 16-32 per share which is in line with 2019 earnings.
The credit impulse from Alfonso Peccatiello at Macro Compass is also reflecting this recession in earnings. His model suggests that earnings could contract by 10-20% in 2023. And the decline has already begun. Second quarter earnings growth for the S&P 500 ex-energy was -3.7%. Year over year, S&P 500 earnings are down approximately 9%. Given the macro data and leading indicators I would expect the S&P 500 earnings yield to fall below 3% at current prices.
Equity markets tend to anticipate economic contraction and resulting declines to earnings. This is why the 9 month total return of the S&P 500 is correlated to the ISM PMI and ESM General Business Conditions Index. The decline in the S&P 500 has already priced in the current declines of these indices . A bottom in the equity market here requires a bottom in growth indicators.
Portfolio Strategy
For the time being, I believe what the Fed is saying which means that the bottom is not in for equity markets. It will be a pivotal sign if TLT does begin to outperform SPY; it will mean that more volatility is ahead.
I am preparing my portfolio for this occurrence. The table below highlights the four scenarios that I think are most likely to occur. The scenario that I deem most probable is where equities decline and long term bonds either rise or decline less than equities. For this reason I have added long call positions on TLT and long call positions on RWM to hedge my portfolio against this scenario.
| Equity Performance |
| Bond Performance |
| Probability |
| Portfolio Positioning |
| Positive |
| Outperform |
| Moderate |
| Long bonds |
| Positive |
| Underperform |
| Moderate |
| Long equities |
| Negative |
| Outperform |
| High |
| Short equities, long bonds |
| Negative |
| Underperform |
| Low |
| Short both |
The risk to this trade is a turnaround in growth which would result from a Fed pivot or a material improvement in economic activity. In that case, short equity would be a losing position. Therefore I am keeping the position size small and using calls to limit downside risk.
Before the pivot is the pause and we have not reached pause yet. I do not expect a pivot before material improvement in inflation and employment data. If MoM CPI printed 0% each month for the rest of the year the YoY CPI would still be above 6%.
Summary
Policy makers at the Federal Reserve cannot be more clear: their mission is to suppress inflation immediately . And they are willing to endure a measure of pain to do so.
Markets are interpreting lower inflation as the "all clear" signal that monetary tightening can cease and growth can return. I do not agree. The data supports the view that inflation is beginning to ease. But in this case lower inflation is not independent of economic contraction; it is a product of it . I view this macro trend continuing through the end of the year.
As a result, earnings will contract with growth at a time when the risk-free rate is attractive relative to inflation expectations which will decline as inflation falls. This will essentially put the TINA effect into reverse as risk-free rates or equity prices head lower. Or, possibly, both.
For further details see:
Short Stocks, Buy Bonds: TINA Effect Goes In Reverse