IVZ - Should You Buy T. Rowe Price For Its 4.5% Dividend Yield?
2023-12-28 16:12:50 ET
Summary
- T. Rowe Price Group's fundamentals are not compelling, and its shares are trading at a premium valuation that is hard to justify.
- The company has experienced negative net flows and weak investment performance, leading to a bearish business outlook.
- Despite offering an interesting dividend yield, the yield is not high enough to justify buying T. Rowe Price shares.
T. Rowe Price Group ( TROW ) offers an interesting dividend yield, but its fundamentals are not compelling, and its shares are trading at a premium valuation that is hard to justify.
Company Overview
T. Rowe Price is an asset management company, which was founded in 1937 and is based in Baltimore. It operates globally, providing a diversified offering of mutual funds, sub-advisory services, and discretionary management services to individual and institutional investors, retirement plans and financial advisors.
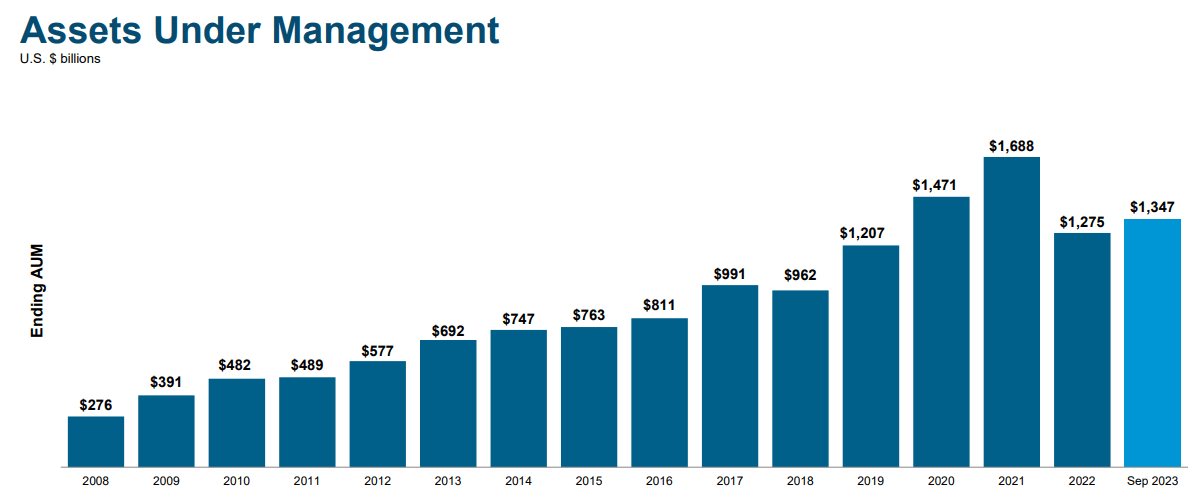
The company has been listed since 1986 and nowadays has a market cap of about $24 billion. At the end of last September , its assets under management (AuM) amounted to $1.23 trillion, which is quite considerable even though it's not among the largest asset managers globally. Indeed, BlackRock ( BLK ) is the world’s largest asset manager with more than $9 trillion of AuM, while TROW on this metric has a similar size to Franklin Resources ( BEN ) or Invesco ( IVZ ).
TROW has a very good AuM growth history until 2021, when its AuM reached a peak of more than $1.6 trillion, but its business is obviously cyclical and highly related to capital markets, thus its AuM declined considerably during 2022 and has only recovered modestly over the past few quarters as shown in the next graph.
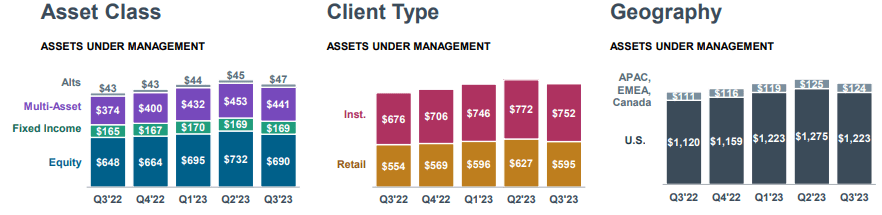
This track record is justified by TROW’s relatively high exposure to equities, which represent close to half of its AuM, explaining its strong decline in 2022. Multi-asset is the second-largest asset class, while its exposure to fixed income is relatively small. By type of client, it has a balanced mix between retail and institutional clients, but geographically is highly exposed to its domestic market, while AuMs in international markets only represent 9.2% of total AuM.
This profile has not changed much over the past few years and is not expected to change dramatically in the near future, making TROW quite exposed to some structural issues in the asset management industry.
Given that TROW is an asset manager that relies on active investing, it’s quite exposed to investors switching to passive investment vehicles, namely ETFs. This is a trend that is more visible in the U.S. and regarding equities exposure, being exactly the core business of TROW, which makes it a significant headwind for its growth prospects ahead.
When I first covered TROW back in the beginning of 2017 the company had a good investment performance track record, this has changed in recent years and nowadays, a good part of its funds are not beating investment benchmarks.
Indeed, the asset management industry offers to a large extent a commodity product, with companies creating some competitive advantages through customer service or above-average historical investment performance. Generally speaking, most traditional asset managers are not able to beat benchmarks over the long term after fees, which has been a major catalyst for the rise of passive investing over the last two decades.
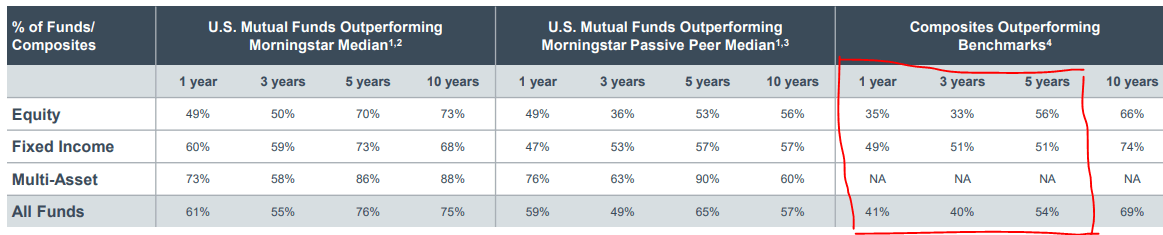
While TROW historically had an above-average investment performance, its most recent track record is not particularly impressive, given that most of its funds are not beating benchmarks over the past five years. As shown in the next graph, TROW has been able to outperform other industry competitors and passive alternatives, but compared to benchmarks its historical performance both in equities and fixed income is not impressive. For instance, over the past three years, only 33% of its funds are beating the benchmark, which is not positive to grow its AuM.
Given this backdrop, it’s not surprising that TROW has reported negative net flows over the past few quarters, being another reason why overall AuM has been soft over the past couple of years. Indeed, over the past five quarters, TROW has reported negative net flows between $16-$20 billion per quarter, which represents about 1.5% of total AuM leaving the company on a quarterly basis.
This is naturally negative for the company’s top and bottom-line growth, as asset managers’ fees are highly dependent on AuM, while usually performance fees have a much lower weight on overall revenues and profits.
TROW is no different than most of its peers, with investment advisory fees representing some 90% of overall net revenue, which means its business relies heavily on AuM growth to increase revenue and earnings over the long term.
However, given that TROW’s investment performance in recent years has not been fantastic and has reported net outflows on a consistent basis in recent quarters, its business outlook is bearish right now and this trend is not easy to turn around, both due to specific issues and the industry trend of switching to passive investing.
Financial Overview
Regarding its financial performance , TROW has a mixed performance given that it has delivered strong growth until 2021, supported by rising AuM, but this has changed dramatically last year.
Indeed, in 2022, its revenues amounted to nearly $6.5 billion, a decline of 15.4% YoY, due to lower fees justified by lower AuM due to weak performance in the capital markets and more than $60 billion of outflows during the year. On the other hand, the inflationary environment led to an increase in operating expenses of 3.9% YoY to $4.1 billion, which had a negative effect on the company’s efficiency. Its net income was close to $1.6 billion, a decline of 49% YoY, impacted both by weaker operating results and a non-recurring loss of $425 million. On an adjusted basis, its net income was $1.86 billion, a decline of 37% YoY, still a very weak outcome during a tough period for the company.
During the first nine months of 2023, TROW’s operating performance has improved somewhat, even though it has consistently reported net outflows, as I’ve discussed before. Its net revenue has improved over the past couple of quarters, reaching some $1.67 billion in Q3, an increase of 5.2% YoY. Its expenses increased at 3.2% YoY, leading to improved operating margins compared to its bottom in Q4 2022.
As shown in the next graph, better performance in capital markets during 2023 have led to increasing AuM, which is supportive for advisory and performance fees, and good cost control has resulted in improved operating margins in recent quarters even though it is still way below its peak margin reached in Q3 2021 at 51%.
Operating margin (T. Rowe Price)
Supported by higher operating income, the company’s bottom-line has also improved in recent quarters, to nearly $500 million in Q3 (vs. $430 million in Q3 2022) and its adjusted EPS was $2.17 (vs. $1.86 one year ago).
Despite this improved operating performance in recent quarters, TROW’s growth prospects are relatively muted as the company continues to report net outflows and investment performance has been weak in recent years. This means that TROW is likely to struggle to maintain current AuM, which is an important headwind for revenue and earnings growth over the next few years.
The street seems to agree with this view given that, according to analysts’ estimates , TROW is not expected to grow its revenues and earnings much in the medium term. Indeed, TROW is expected to report revenues of $6.41 billion in 2023, and to grow only to $6.7 billion by 2026, while its net income is expected to be flat at around $1.7 billion during this period. This isn’t particularly impressive and shows that TROW’s business is facing several issues due to its positioning in the asset management industry, something that is not easy to change meaningfully in the near future.
Regarding its balance sheet, TROW has a very strong financial profile given that it usually has a net cash position because asset management is a capital-light business and there is not much need to raise debt, unless companies enter into M&A activity. Therefore, TROW has a very strong financial position with net cash of about $3 billion at the end of last September, allowing it to provide an attractive shareholder remuneration policy.
Given this background, it’s not surprising to see that TROW is a dividend aristocrat , having raised its dividend for over 35 years in a row. Its current quarterly dividend is $1.22 per share, or $4.88 per share annually, which represents a small annual increase of 1.7%. Beyond dividends, the company also has repurchased its own shares in recent years and sometimes distribute special cash, enhancing its capital returns to shareholders.
However, due to lower earnings, the company has reduced share repurchases in recent quarters, making its dividend the bulk of its capital return policy.
Capital returns (T. Rowe Price)
At its current share price, TROW offers a dividend yield of about 4.5%, which is quite interesting for income investors. Moreover, its dividend seems to be sustainable given that its payout ratio is around 65%, which is an acceptable level for a company that has a strong financial position and does not need to retain much earnings in the near future.
According to analysts' estimates , this payout ratio is expected to be between 65-67% over the next few years, remaining in my opinion at an acceptable level over the next three years. This happens because EPS growth is quite muted during this period, but its dividend is expected to grow to $5.24 per share by 2026.
Conclusion
T. Rowe Price is currently facing several issues and its financial performance is not impressive, due to weak investment returns that are leading to net outflows. This situation is not easy to reverse, leading to a rather negative business outlook in the near future.
Despite this, its shares are currently trading at 16x forward earnings, at a premium to its own historical valuation over the past five years (14.5x) and its peer group that currently trades at around 12x forward earnings. While TROW offers an interesting dividend yield, I don’t think its yield is high enough to justify buying its shares, thus I rate TROW as a ‘Hold’ for the time being.
For further details see:
Should You Buy T. Rowe Price For Its 4.5% Dividend Yield?