SIBN - SI-BONE: Another Record Quarter Reinvesting For Future Growth Reiterate Buy
2023-08-31 16:28:34 ET
Summary
- SI-BONE, Inc. presents compelling long-term value with robust growth in unit economics, high gross profits, and attractive valuation upside.
- Q2 FY'23 showed record-breaking sales of $33.3 million, with 31% growth in the U.S. market and 5th consecutive quarter of record revenues.
- The company's capital allocation and recycling strategies, along with positive sentiment and valuation, support a buy rating.
- Net-net, reiterate buy.
Investment update
SI-BONE, Inc. ( SIBN ) continues to present with compelling long-term value in my opinion, backed by 1) robust growth in unit economics, 2) high gross profits as a percentage of assets deployed into the business, and 3) attractive valuation upside.
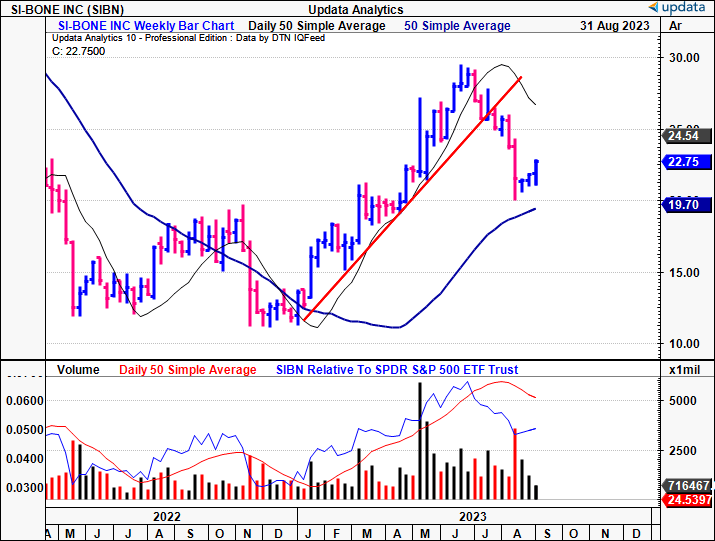
This report will unpack the latest investment updates for SIBN and link these back to the broader buy thesis. I'd encourage you to read the last publication as well to get a feel of the company's progression, but I'll continuously remind you of this here today as well. The central themes remain the same, albeit with additional upside factors. Critically, the company's latest numbers indicate top-line momentum into H2 FY'23, as it brings on more active surgeons, and increases average selling prices. Net-net, I am looking to a market value of $1.04Bn for SIBN, and am not concerned with the recent selloff since July shown in Figure 1. For one, it correlates with the broad selloff in healthcare over the same time, and secondly, it gives the opportunity to size up money-weighted returns in the long account for SIBN. Net-net, reiterate buy.
Figure 1 .
Key risks to the investment thesis
It is imperative for investors to understand the following set of potential risks that could nullify the buy thesis:
- Healthcare equities have sold off rolling into July/August and the bulk of names within our coverage universe haven't been immune to the selling pressure. I would state that, in the short-term this is considered price risk (the main risk for long-term investors-short-term players face more of a reinvestment risk); nevertheless, high-beta names within healthcare could struggle to catch a bid, SIBN included.
- SIBN needs to continuously attract new active surgeons to drive revenues higher. Competitors could steal market share and this might hinder its ability to do so.
- We shouldn't ignore the broader set of macro risks that can hurt global equity markets (systematic risk).
- There is execution risk with the company's impending product launches that could result in an unsuccessful launch or slow market uptake.
I'd urge investors to pay close attention to these risks before proceeding further, as they are essential to know in full before making any investment decisions.
Critical updates to investment thesis
Q2 FY'23 insights
SIBN continued to deliver solid financials in Q2 . The company put up a record $33.3mm in sales, up 30% YoY. The standout performer was its U.S. market, which booked $31.2mm in turnover, a growth of ~31% from Q2 last year. Critically, this isn't a one-off for SIBN-rather the 5th consecutive quarter of record revenues across all its markets. It pulled this to gross of 81%, tremendously high off its current revenue base in my opinion. On the back of Q2, management dialled up full-year 2023 guidance and now calls for $132mm-$134mm at the top line. This would be 24%-26% YoY growth, up from the earlier 20%-23% range. It still eyes 80% gross on this for the year as well.
The top-line momentum is, therefore, abundantly clear for the company heading into H2 in my view. And the numbers don't lie-it's not just pricing that's driving the revenue clip. Procedural demand is rising, jumping ~30% YoY as well.
Underscoring the growth in Q2 were the key KPI's I've been benchmarking SIBN against since the original buy rating in December '22:
- Revenue per U.S. territory perched at ~$1.4mm for the TTM, a 32% growth on Q2 last year.
- Active surgeon numbers-climbing too, also up ~30% over Q2 FY'22. This marks its 10th consecutive quarter of double-digit YoY growth in active surgeons. Growth in revenue/active surgeon is a key driver of SIBN's unit economics. The equation is simple: Higher selling price + more active surgeons = more revenues. In the last publication, I noted it hit 950 active surgeons. Management said it hit >950 active surgeons early into Q3. Revenue per surgeon was therefore at least $35,052 for the quarter on a 950 base, up from $34,421 last quarter, and ~$33,000 the year prior.
- As a reminder, the company aims to hit 7,500 active surgeons across its core market. Based on previous estimates made in June, I estimate the company has ~13% of this market as of Q2 (it had ~12.5% last quarter). At the current revenue/active surgeon, you get to $131.45mm in quarterly turnover at 50% penetration, and $262.9mm at 100% ($525mm and $1.05Bn annualized, respectively). Last quarter, I had it at $129mm and $258mm in quarterly sales based on the same calculus, albeit with fewer active surgeons and a smaller revenue clip. In my eyes, this is clear evidence of SIBN's propensity to grow sales over the coming 2-3 years.
Finally, I'd also point out the company's headline act - the iFuse Bedrock Granite system . It's seen good uptake 12 months after launch. The company mentioned it has tapped into a market of 130,000 cases, and management now estimates its total addressable market to be >$3Bn.
As a tailwind, moving forward, it's worth nothing that c.40% of Granite procedures are shorter multilevel surgeries. These require less spinal involvement and ultimately result in a more 'conservative' procedure. That is, less spinal arthrology is involved, potentially fewer complications, fewer revisions, and faster rehabilitation times. These points were supported by findings from Ledesma et al. (2023) who provided that "[s]hort-construct fusions in appropriately selected patients may provide satisfactory improvements in patient-reported outcome measures...and mitigate hospital length of stay, revision surgery rates, and nonhome discharge."
The company is set to launch a new Granite product by FY'24, so I'd be watching this space very closely going forward. The early success of the Granite business offers potentially interesting economics should it continue at this pace.
Capital allocation and capital recycling
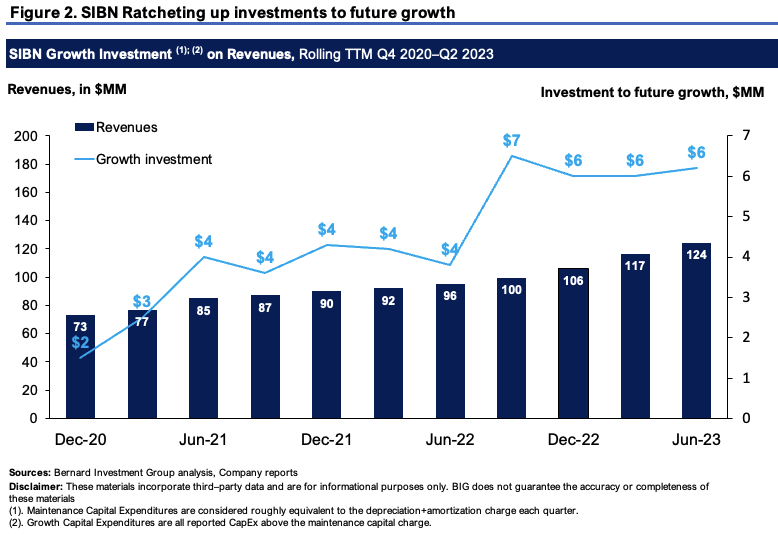
As to how the company is recycling capital into investments for future growth, two charts immediately stand out.
Figure 2 outlines the company's 'growth investment' relative to its revenue print on a rolling TTM basis since 2020. Growth investment-i.e., growth CapEx-is considered all capital spend over the maintenance capital charge. The maintenance CapEx is considered roughly equivalent to the rolling depreciation charge, and estimates how much reinvestment is required to maintain the current pace of business. Only that CapEx above the maintenance charge is considered to be growth investment.
What shows in Figure 2 is the company is committed to recycling surplus capital (including cash on hand) into driving future growth of the company. What's critical is that inventory purchases are excluded from this calculus, indicating that cash flows are being put directly to work in the business outside of working capital. For reference, inventories at book value have increased from $5.6mm in 2020 to $20.4mm in Q2 FY'23.
This is telling. It implies that 1) the firm has plenty of opportunities to deploy the cash in scaling up production, and 2) it is seeing persistent all-time highs in revenues alongside this. To me this is a bullish point for the remainder of FY'23.
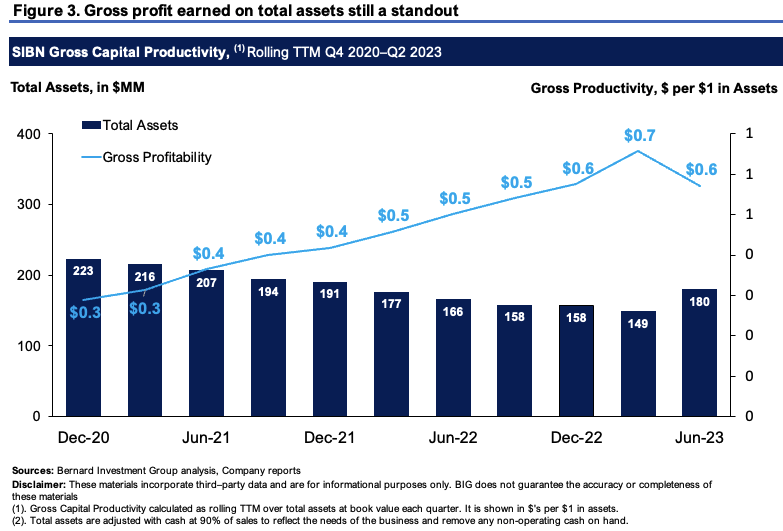
The second chart, Figure 3, depicts the strengths in SIBN's gross margin as a percentage of total asset growth. I outlined this chart in the last publication as well, but it has been updated and now includes the gross profit and asset growth of Q2 FY'23. Assets employed are adjusted with cash at 90% of sales to represent the operating needs of the company.
Critically, what shows is the company is producing more gross profit off a relatively stable asset base-key evidence of the economic leverage on assets deployed. That it can generate more gross off relatively thinner asset numbers is a major growth lever in my opinion.
Capital-intensive businesses don't enjoy this kind of leverage. But the data shown squares off with the economics of SIBN's business. It relies on obtaining active surgeons to grow sales, and the cost to bring new surgeons online is low. It doesn't require an enormous investment to do this. The investment instead goes into scaling up productivity, finishing more inventory, and the R&D and investment into launching new product lines. This supports a reiterated buy in my view.
Sentiment and valuation
Sentiment
There is positive sentiment in SIBN's stock and we see this in three ways.
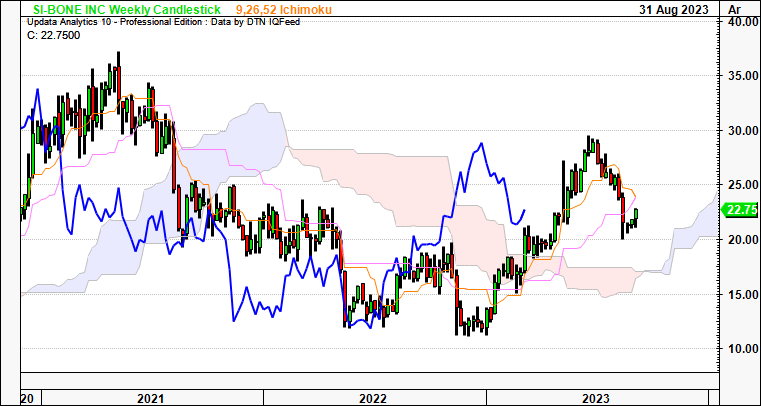
One, the stock still trades above cloud support on the weekly chart. The recent price structure is noted [Figure 4] given the selloff in H2 that corresponds to the selloff in broad healthcare. Critically, the stock still remains on the longer-term trend, and with recent price action, where it's curled up off lows, could sell higher from here. That it trades above the cloud and has caught a bid at current levels is a bullish point in my view.
Figure 4.
Two, there has been 8 revisions higher to SIBN's revenue estimates from Wall Street analysts in the last 3 months. Consensus now calls for $133mm in revenues for FY'23, and looks to $158mm the year after. The bullish positioning on The Street is telling and suggests the sell-side (and potentially, many of their clients) has constructive view on SIBN going forward.
Three, options-generated data illustrates that investors have heavy demand for contracts at a $25-$30 strike depth for contracts expiring in October. Unlike the analysts views, this is actual capital at risk, showing the positioning of these agents within the market structure. As such, there is bullish positioning actually in the stock as well.
Valuation
The stock sells at 6.6x forward sales, and this is a premium of 67% to the sector. This suggests to me investors are expecting above-sector growth from the company going forward, and I'd concur, given what's been discussed here today. The company has also created $4.90 in market value for every $1 tied up in net asset value, (trading at 4.9x book value) a testament to the data shown in Figure 3 earlier.
At 6.6x forward, you get to $1.04Bn in market value for SIBN using FY'24 estimates of $158mm, well above the current market cap, and an 18% value gap. This is my next objective, and I would opine there is scope to rate this higher with still 2 quarters to go in FY'23. This also supports a buy rating in my opinion.
In short
Net-net, there are multiple inflection points to SIBN's growth story that remain under-reflected in its current market price in my view. Another period of record growth, tremendously high gross margins both as a percentage of revenues and the resources it has employed into the business, and commitment to investing for future growth. Combined with improvements in its core unit economics, this supports a buy rating. I am looking to a market value of $1.04Bn as the next objective, around 18% upside from the current levels. Reiterate buy.
For further details see:
SI-BONE: Another Record Quarter, Reinvesting For Future Growth, Reiterate Buy