IMPUF - Sibanye Stillwater: A Difficult Year For The Company
2023-04-17 10:30:56 ET
Summary
- Sibanye Stillwater Limited revenues for the six months ending December 31, 2022, were down to $3,878 million compared to $5,461 million at the end of December 2021.
- U.S. PGM operations slowly recovering from a one-in-200-years flood event.
- The Sibanye Stillwater board of directors has declared and approved a cash dividend of 122 SA cents per ordinary share (US 0.0674 cent per share or US 0.2698 cents per ADR).
- I recommend buying Sibanye Stillwater Limited stock between $8.35 and $8.15, with potential lower support at $7.75.
Introduction
Johannesburg-based company Sibanye Stillwater Limited ( SBSW ) released its six-month earnings results ending December 31, 2022, on February 28, 2023.
Important note: This article is an update of my article published on August 28, 2022. I have been following SBSW on Seeking Alpha since Feb. 2014.
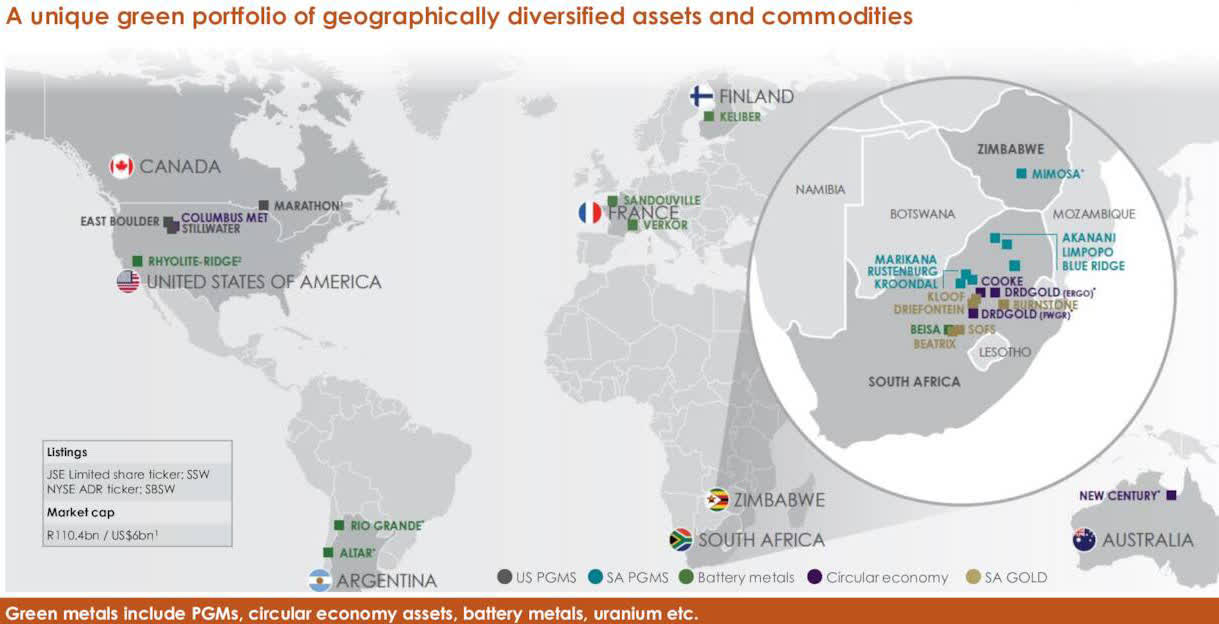
The company owns assets worldwide.
SBSW Map Presentation (SBSW Presentation)
1 - H2 2022 Results Snapshot
As I said in my previous article, Sibanye's balance sheet is particularly complex and requires focus and attention to understand the business model properly.
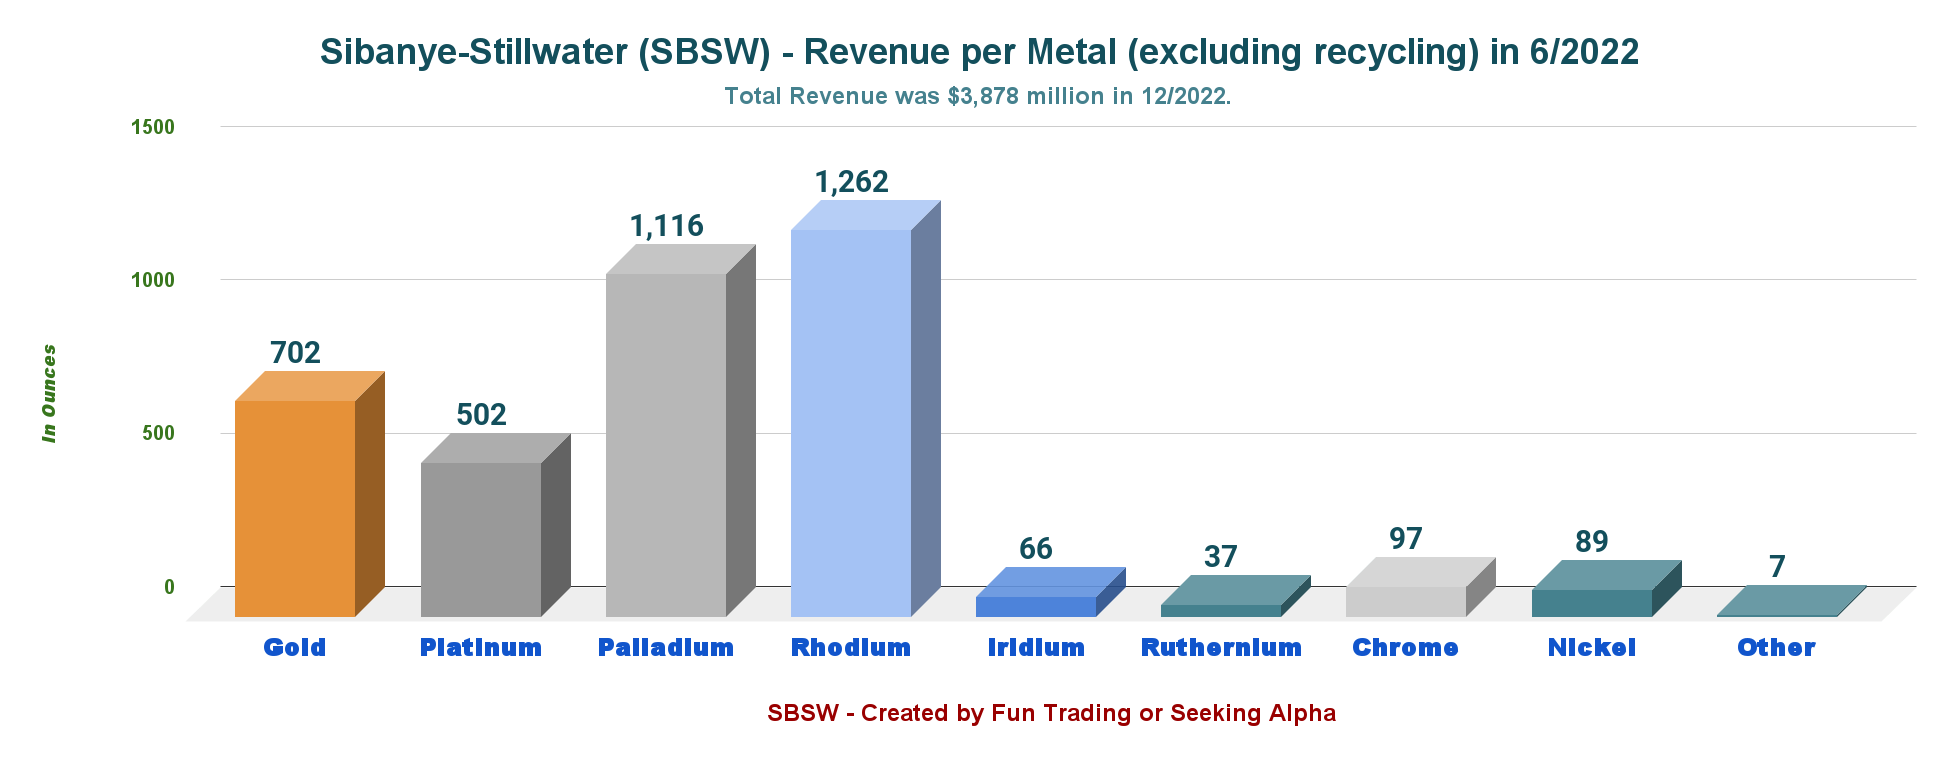
The company produces Palladium, platinum, and Rhodium in the USA (with a bit of gold and other metals) from direct mining and recycling (which generates a much lower profit margin). It also produces Iridium, Ruthenium, Chrome, Nickel, and others.
Note: Nickel is a recent addition after the company acquires the Sandouville Nickel refinery in France.
However, the lion's share of the revenue for Sibanye Stillwater comes from South Africa and its production of Rhodium.
Sibanye reported profits for H2 2022 attributed to SBSW shareholders of $344 million and revenue of $3,878 million. The company's total profits decreased by 34.7% from H2 2021.
The company ended H2 2022 with net cash of $1,509 million.
2 - Investment Thesis
I have been following Sibanye Stillwater Limited for many years, and I believe the company is an excellent candidate for a long-term investment, especially considering the discounted stock price.
I got involved with Sibanye Stillwater after acquiring the U.S. palladium and platinum miner Stillwater.
2022 was a challenging year for the company, with catastrophic flooding in the Stillwater mine and numerous issues with its gold mines in South Africa. 2023 will undoubtedly be better with higher production in the U.S. and a better gold price above $2,000 per ounce.
However, while SBSW is an excellent long-term PGM (platinum group metals) miner, trading 30%-40% short-term LIFO of your long position is imperative to take advantage of the intense volatility and reduce the risk. Trading LIFO allows you to keep a core long-term position until the stock reaches your final target while taking advantage of the short-term volatility.
This dual strategy has been the strategy in my marketplace, "The Gold and Oil Corner," and I believe it is the best way to maximize your gain over a long period.
3 - Stock Performance
Below is shown the one-year chart comparison between the VanEck Vectors Gold Miners ETF ( GDX ), the Aberdeen Standard Physical Palladium Shares ETF ( PALL ), the Aberdeen Standard Physical Platinum Shares ETF ( PPLT ), Sibanye Stillwater, and Impala Platinum ( OTCQX: IMPUY ).
We can see that SBSW has significantly underperformed in the sector and is now down 48% on a one-year basis. The drop has accelerated since the peak in January 2023. The outperformance is related to the company's technical problems over the past few months. However, the recent gold rally has not helped SBSW, which is still depressed even if the company produces gold.
Sibanye Stillwater ADR - H2 2022 - Balance Sheet History And Trend - The Raw Numbers
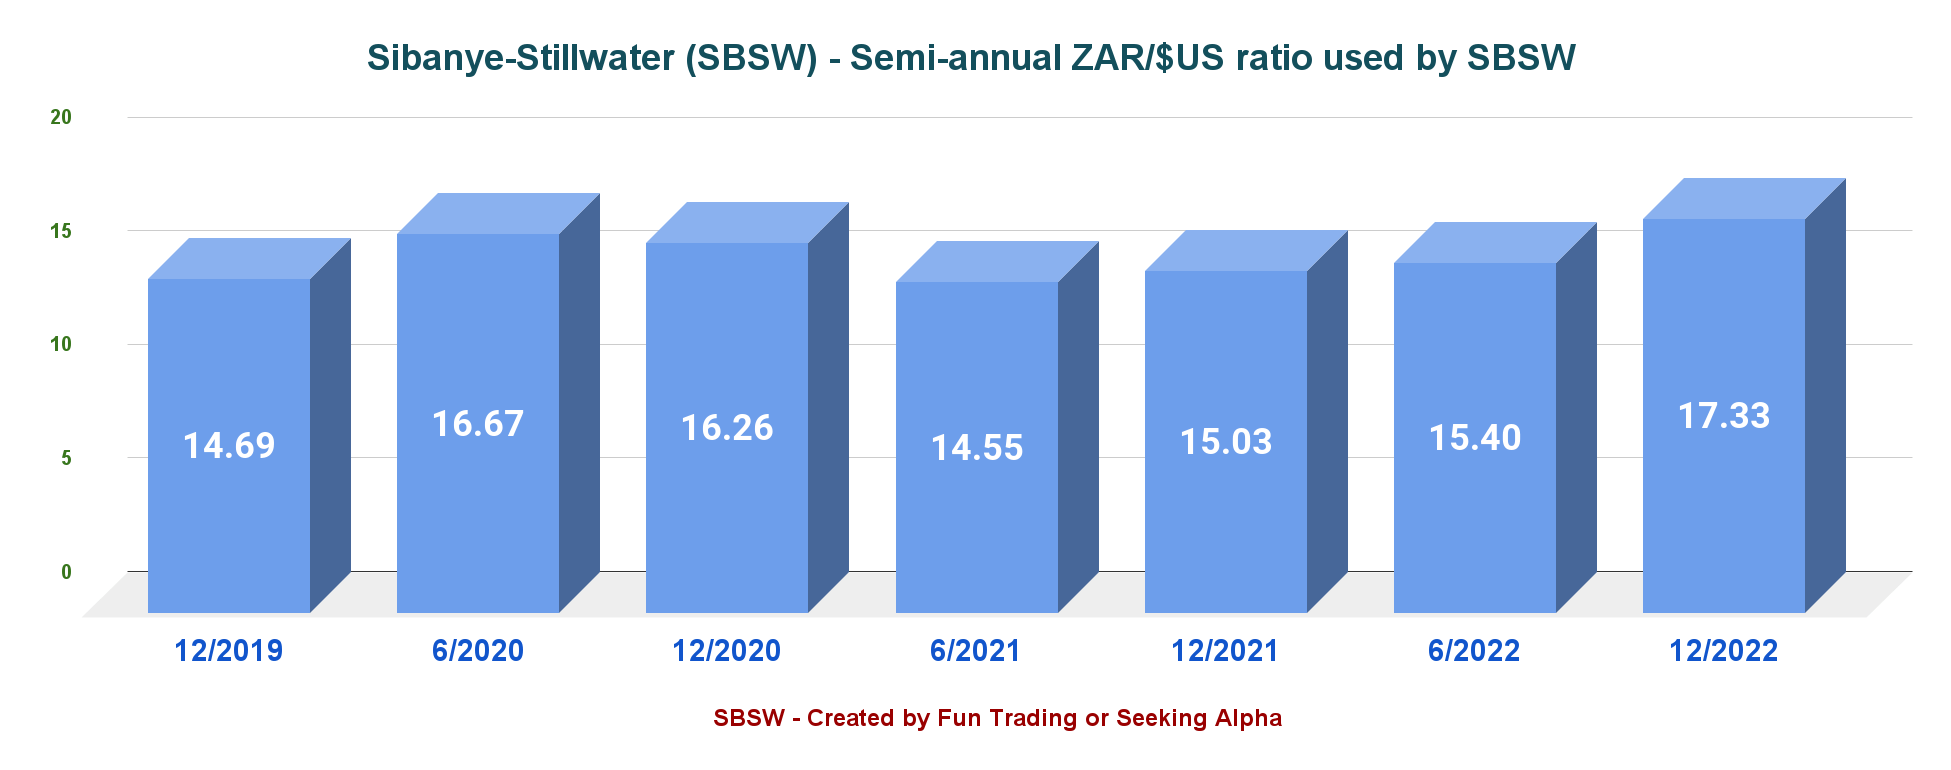
Note: The numbers below are indicated in US$ and can vary depending on the ratio ZAR/. You should expect some minor fluctuations.
Important: Each Sibanye Stillwater ADS represents four (4) Sibanye Stillwater Ltd. Shares. The Sibanye Stillwater ADRs trade on the New York Stock Exchange under SBSW. According to Investopedia :
American depositary receipts (ADRs) allow foreign equities to be traded on U.S. stock exchanges. In fact, this is how the stock of most foreign companies trades in U.S. stock markets. Meanwhile, an American depositary share ((ADS)) is the actual U.S. dollar-denominated equity share of a foreign-based company available for purchase on an American stock exchange.
| Sibanye Stillwater ADR |
| 6/2021 |
| 12/2021 |
| 6/2022 |
| 12/2022 |
| vs. ZAR |
| 14.55 |
| 15.03 |
| 15.40 |
| 17.33 |
| Total Revenues in $ Million |
| 6,182 |
| 5,461 |
| 4,570 |
| 3,878 |
| Basic Net Income attributable to SBSW in $ Million |
| 1,707 |
| 577 |
| 782 |
| 344 |
| Adjusted EBITDA $ million |
| 2,787 |
| 1,852 |
| 1,465 |
| 635 |
| EPS in $/share/ per ADR (4x) |
| 0.58/2.32 |
| 0.76/3.04 |
| 0.28/1.12 |
| 0.13/0.52 |
| Operating Cash Flow in $ Million |
| 913 |
| 1,267 |
| 285 |
| 645 |
| Capital Expenditure in $ Million |
| 256 |
| 477 |
| 399 |
| 564 |
| Free Cash Flow in $ Million |
| 657 |
| 790 |
| -111 |
| 81 |
| Cash and cash equivalent $ Million |
| 1,829 |
| 1,900 |
| 1,673 |
| 1,509 |
| Borrowings, including current in $ Million |
| 1,204 |
| 1,273 |
| 1,282 |
| 1,315 |
| Net debt in $ million |
| 0 |
| 0 |
| 0 |
| 0 |
| Dividend per ADR in $/share |
| 0.63 |
| 0.49 |
| 0.33 |
| 0.27 |
| Shares outstanding (diluted) in Million |
| 744.7 |
| 719.22 |
| 707.73 |
| 707.70 |
| Production Au Oz |
| 6/2021 |
| 12/2021 |
| 6/2022 |
| 12/2022 |
| US 2E PGM Production |
| 298,301 |
| 272,099 |
| 230,039 |
| 191,094 |
| US recycling Oz |
| 402,872 |
| 352,276 |
| 361,333 |
| 237,441 |
| US AISC 2E/Oz Stillwater |
| 973 |
| 1,039 |
| 1,366 |
| 1,840 |
| SA 4E PGM |
| 894,165 |
| 941,973 |
| 823,806 |
| 843,658 |
| SA AISC 4E/Oz |
| 1,163 |
| 1,134 |
| 1,179 |
| 1,179 |
| 4E PGM Price in $/Oz |
| 3,686 |
| 2,696 |
| 2,817 |
| 2,434 |
| Gold Production Au Oz |
| 518,848 |
| 554,086 |
| 191,683 |
| 428,859 |
| Average gold price $/oz |
| 1,792 |
| 1,780 |
| 1,864 |
| 1,720 |
| AISC Gold $/oz |
| 1,691 |
| 1,685 |
| 3,115 |
| 2,019 |
Source: Company release analysis.
Note: More historical data are available to subscribers only.
Below is the average historical ratio ZAR/:
SBSW 6-month ZAR US$ ratio (Fun Trading)
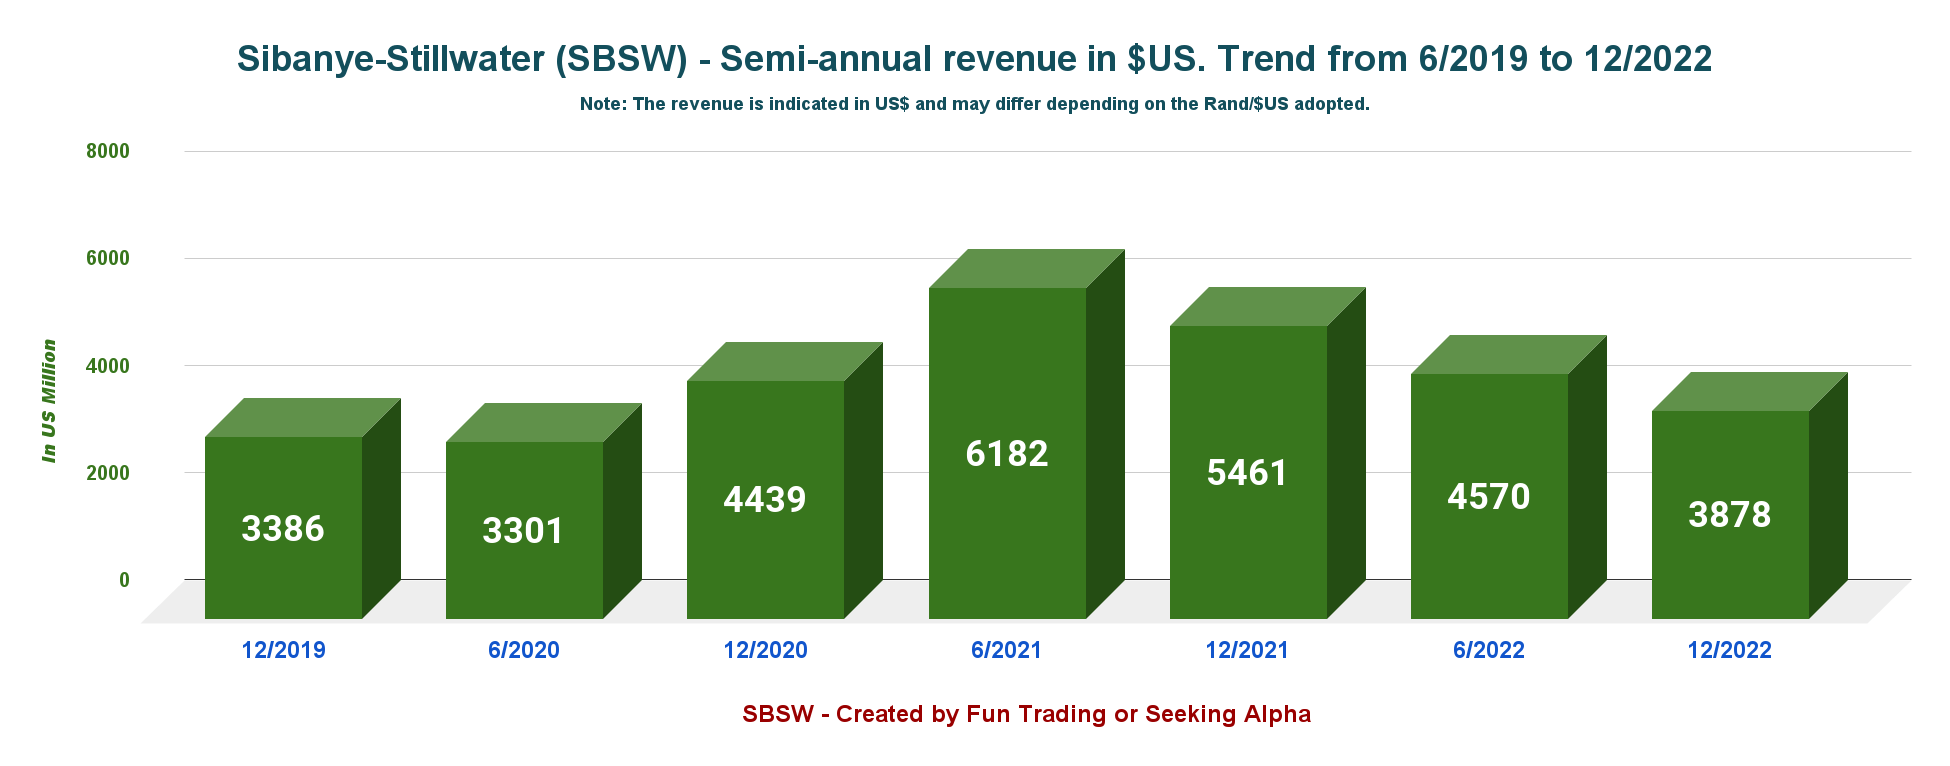
1 - Total Revenues were $3,878 million on December 31, 2022
Note: The revenues in US$ could vary significantly depending on the ratio used. The revenues indicated here are what has been shown by the company in the press release.
SBSW 6-month Revenues history (Fun Trading)
Revenues for the six months ending December 31, 2022, were down to $3,878 million compared to $5,461 million at the end of December 2021.
Also, Sibanye Stillwater's earnings per ADR share were $0.52 compared to $0.72 in H2 2021.
SBSW Quarterly revenue per metal (Fun Trading)
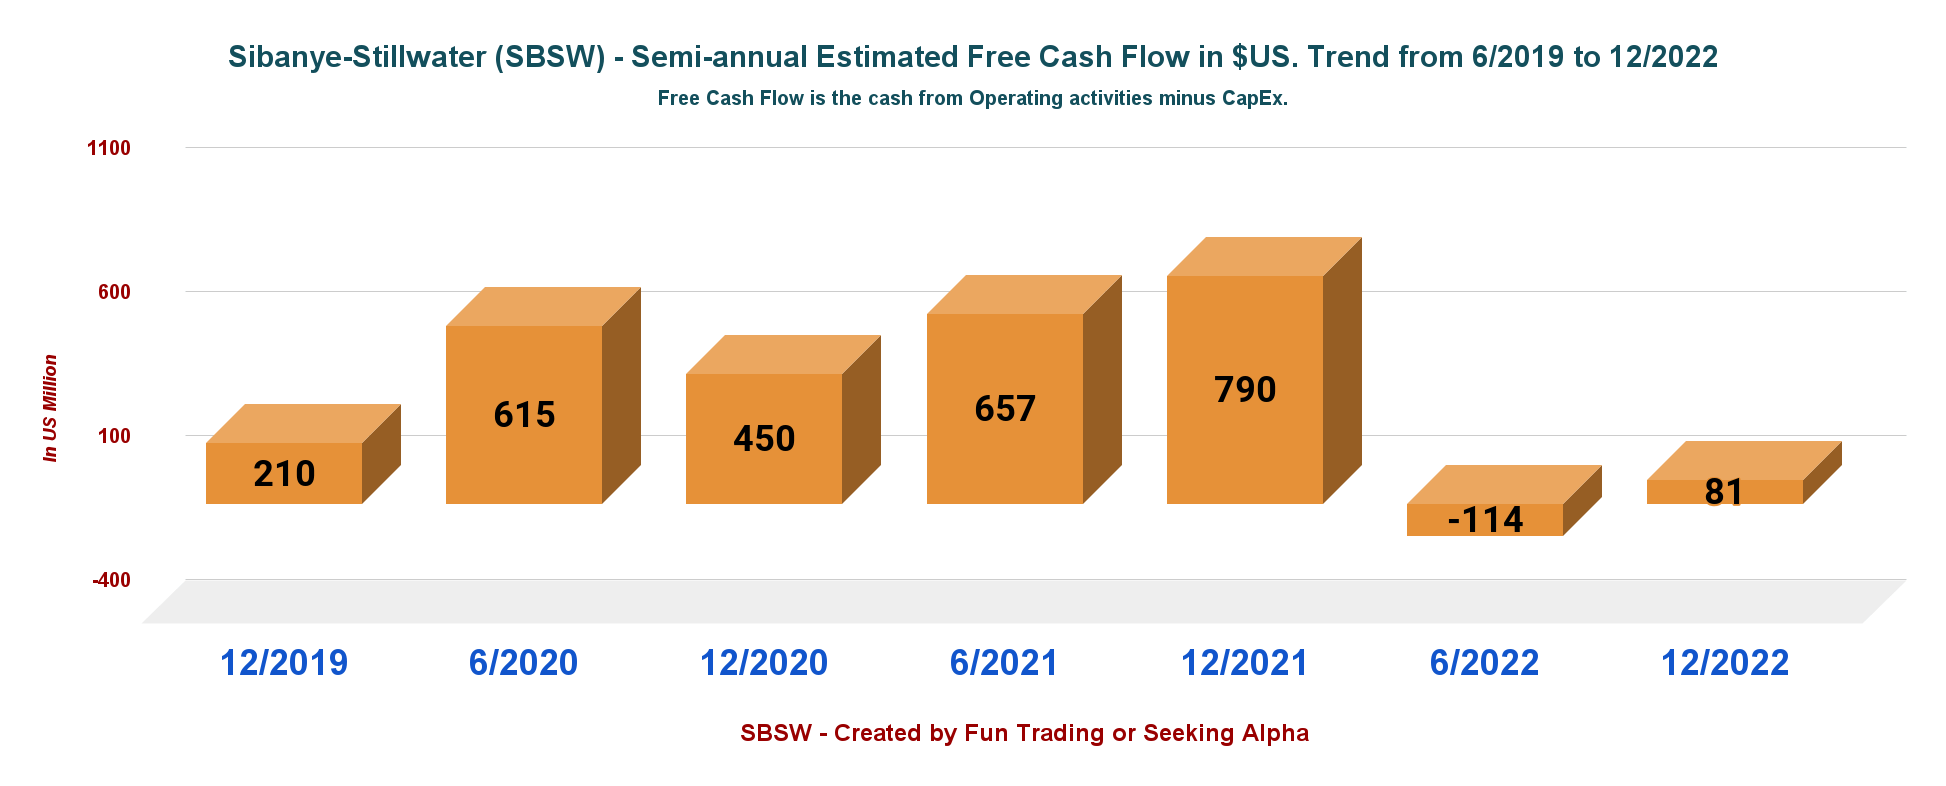
2 - Free Cash Flow was $81 million on December 31, 2022.
SBSW 6-month Free cash flow history (Fun Trading)
Note: Generic free cash flow is cash from operations minus CapEx.
The 12-month free cash flow is a loss of 30 million, with free cash flow in H2 2022 of $81 million.
The dividend for H2 2022 has been set to $0.27 per share, which is a yield of about 4.75% net. Do not forget South Africa deducts 25% at the source.
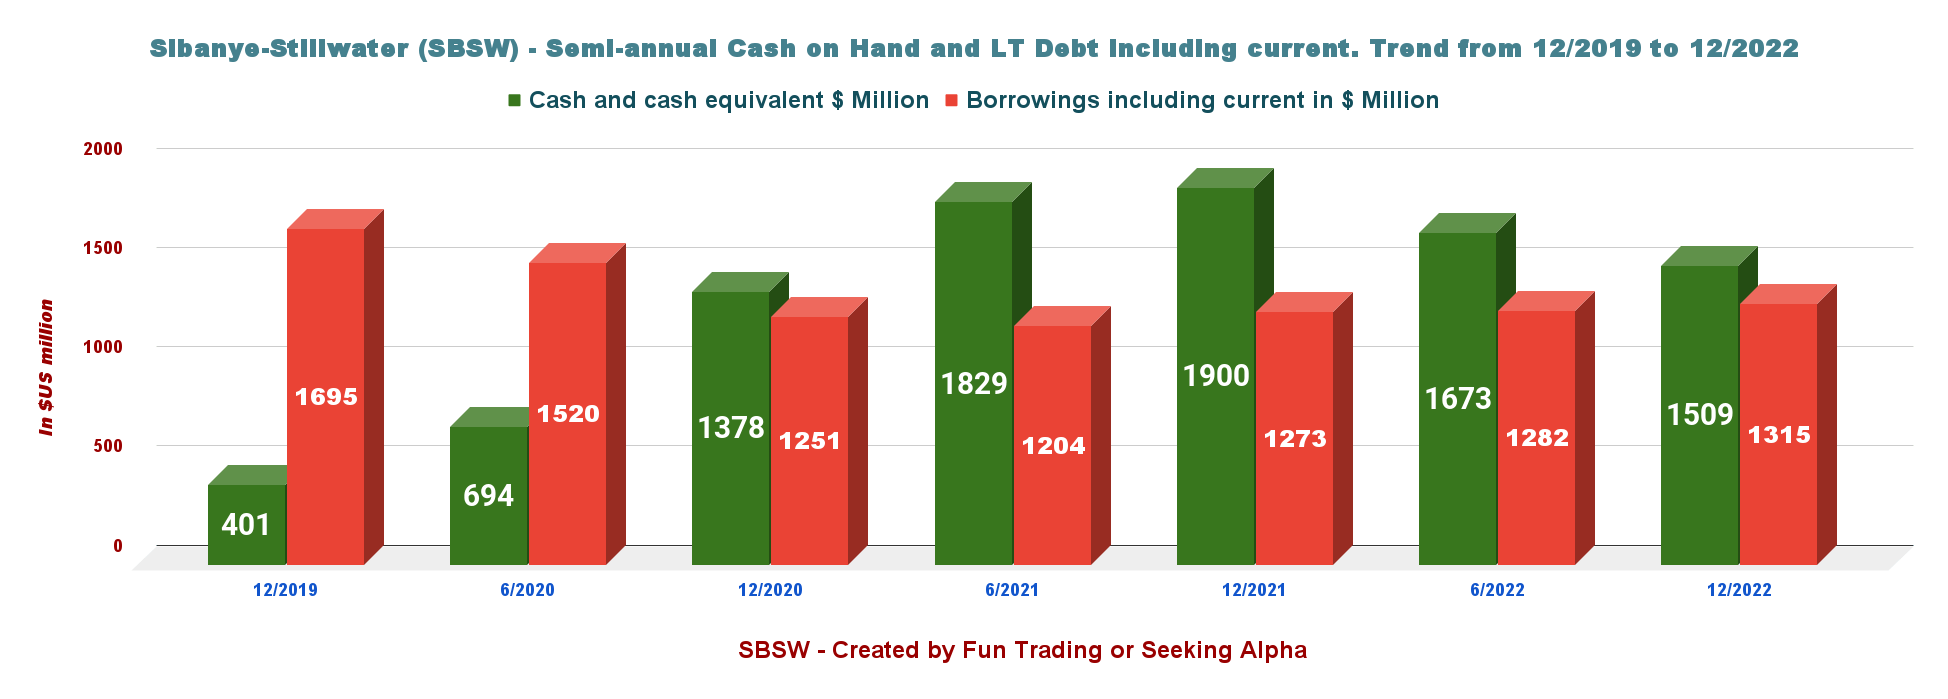
3 - Gross Debt was $1,315 Million at the end of December 2022. No net Debt.
SBSW 6-month Cash versus debt history (Fun Trading)
The Cash and Cash equivalents are now $1,509 million, and LT debt, including current (excluding non-recourse debt), is $1,315 million.
4 - H2 2022 Production Analysis
Sibanye Stillwater produces Gold and PGM in South Africa and the USA from Stillwater. I have tried to simplify it by showing charts.
Note: The company operates the US East Boulder and Stillwater mines, which produce platinum and Palladium. Also, the company is recycling platinum/palladium/rhodium.
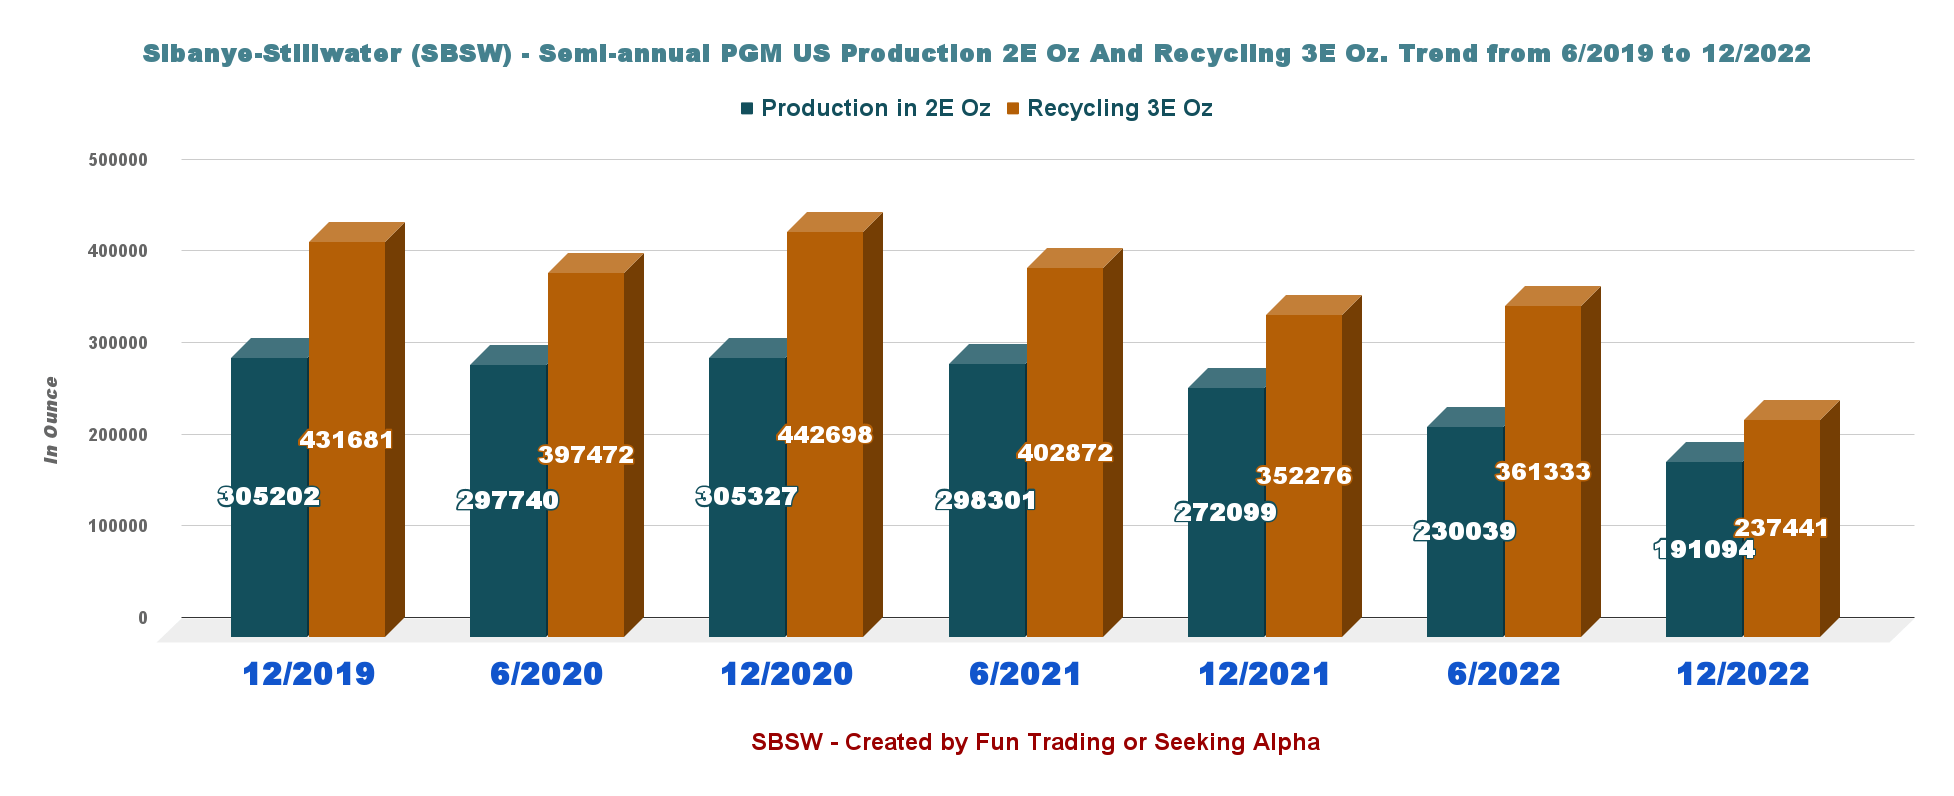
4.1 - US PGM Production 2E PGM Oz And Recycling 3E PGM Oz ("USA")
The chart indicates the quarterly production and six months of production as well.
SBSW semi-annual Production 2E and Recycling history (Fun Trading)
Production was relatively weak. U.S. Production 2E/PM was 191,094 2E Oz, down from 272,099 2E Oz last year, and Recycling delivered 237,441 3E Oz, down from 352,276 in 12/2021.
Total production in the U.S. was 428,535 3E Oz, down from 624,375 3E Oz in 12/2021.
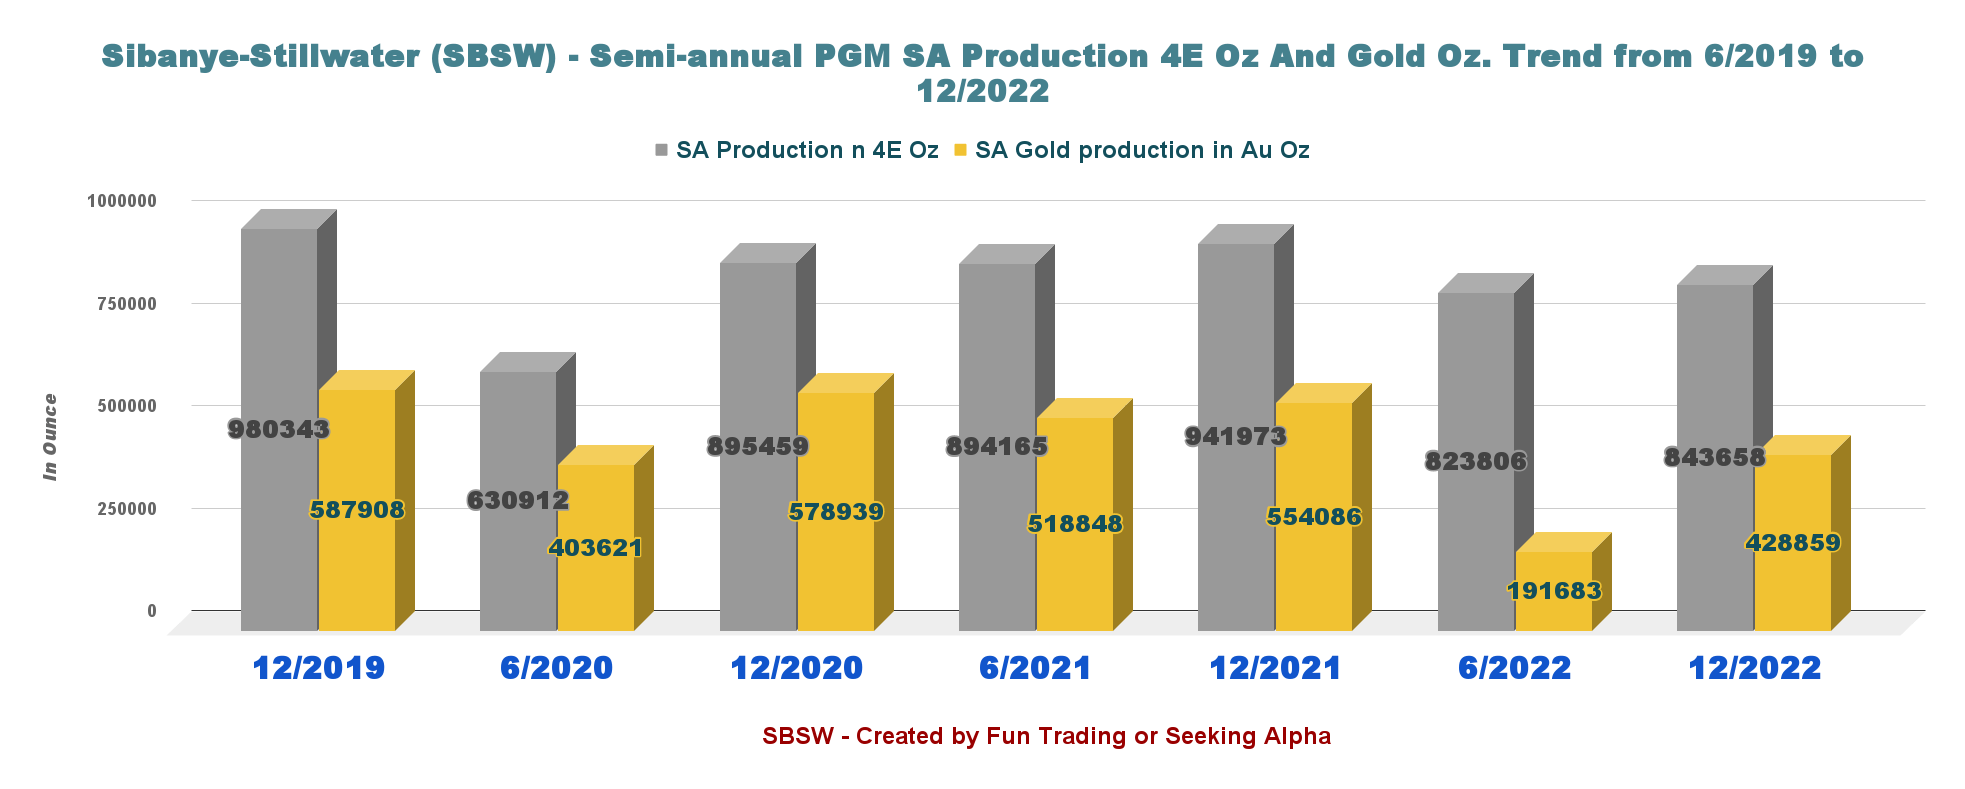
4.2 - South African PGM Production: 4E PGM Oz And Gold Production
SBSW semi-annual 4E Oz and Gold production history (Fun Trading)
The Gold production was 428,859 Au Oz, down significantly from 554,086 Au Oz in 12/2021, with an average price of $1,720 per Au Oz from $1,780 in 2021.
The 4E PGM production was 843,658 4E Oz, up from 941,973 4E Oz in 12/2021.
Also, the company indicated $2,434 per Oz for the 4E PGM Price basket, down significantly from $2,696 per 4E PGM in December 2021.
There are three different AISCs for Sibanye Stillwater. AISC for gold reached a record high due to the low production this semester.
| AISC type |
| 6/2021 |
| 6/2022 |
| 12/2022 |
| AISC 2E PGM |
| 973 |
| 1,366 |
| 1,840 |
| AISC 4E PGM |
| 1,163 |
| 1,179 |
| 1,179 |
| AISC Gold |
| 1,691 |
| 3,115 |
| 2,019 |
5 - Production Guidance 2023 per region.
SBSW 2023 Guidance (SBSW Presentation)
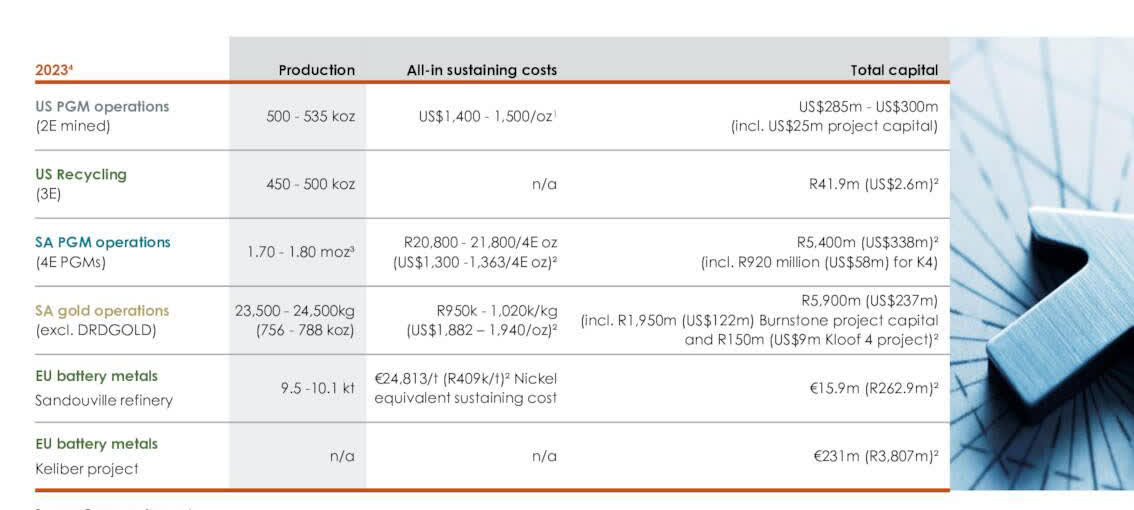
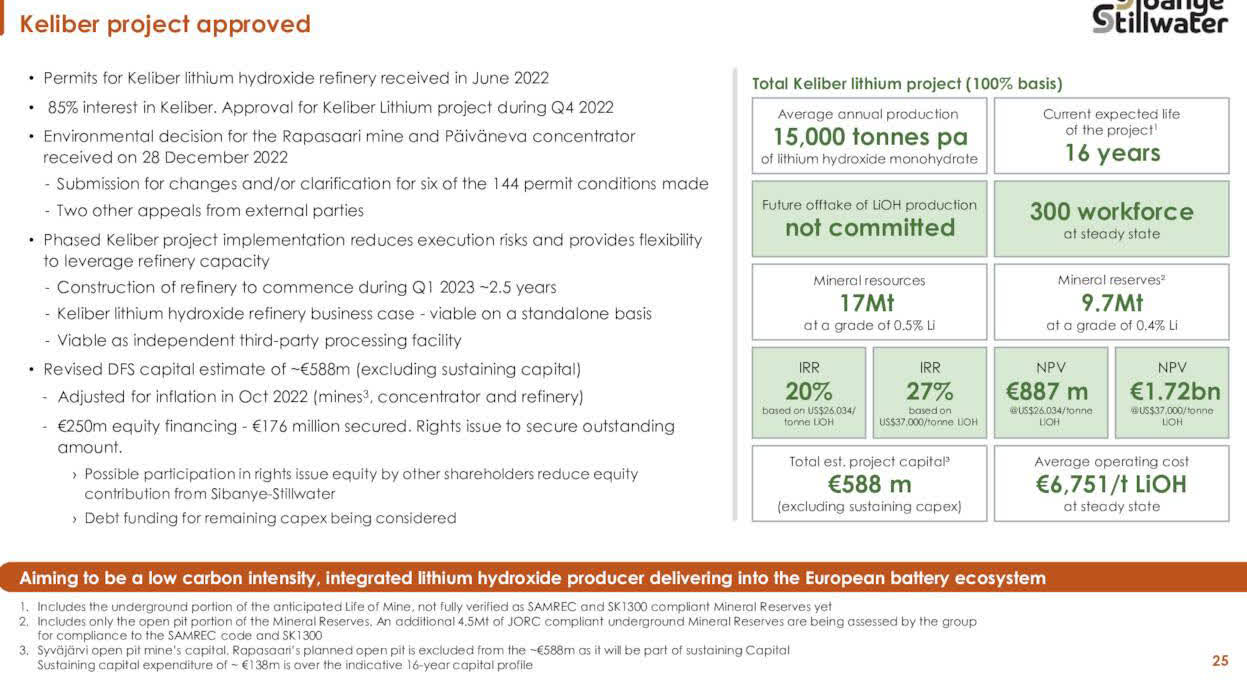
6 - The Keliber Lithium Project
It is an 85% own project which was approved in 4Q22. The company expects to produce 15K Tonnes of lithium annually with a LOM of 16 years. Construction commenced in the first quarter
SBSW Keliber Lithium Project Finland (SBSW Presentation)
Technical Analysis And Commentary
SBSW TA Chart short-term (Fun Trading StockCharts)
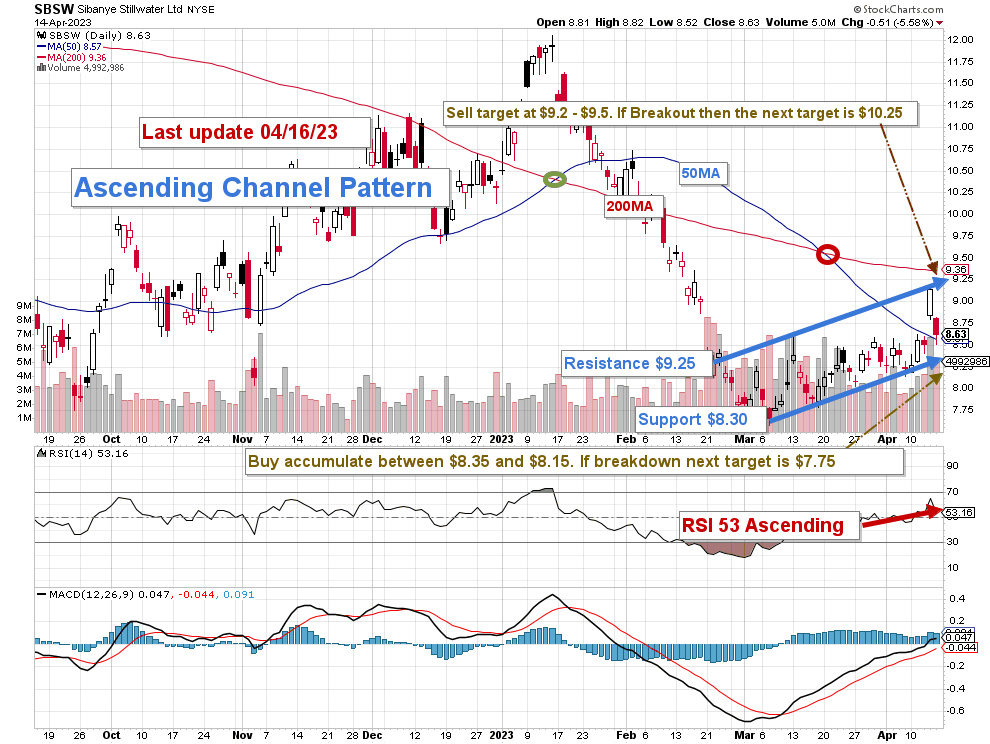
Note: The chart is adjusted from the dividend.
SBSW forms an ascending channel pattern with resistance at $9.25 and support at $8.30.
Ascending channel patterns or rising channels are short-term bullish in that a stock moves higher within an ascending channel, but these patterns often form within longer-term downtrends as continuation patterns. The ascending channel pattern is often followed by lower prices, but only after a downside penetration of the lower trend line. The stock will continue channeling upward until it is able to break either the upper or lower trend line.
I suggest trading LIFO and taking profits between $9.2 and $9.5 (about 30%) with possible higher resistance at $10.25 and accumulating between $8.35 and $8.15 with potential lower support at $7.75.
Warning: The TA chart must be updated frequently to be relevant. It is what I am doing in my stock tracker. The chart above has a possible validity of about a week. Remember, the TA chart is a tool only to help you adopt the right strategy. It is not a way to foresee the future. No one and nothing can.
For further details see:
Sibanye Stillwater: A Difficult Year For The Company