IMPUF - Sibanye Stillwater: Weakness Ahead Offers Opportunity
2023-10-19 13:10:31 ET
Summary
- Sibanye Stillwater Limited released its H2 2022 results, reporting profits of $344 million and revenue of $3,878 million.
- On October 4, 2023, CEO Neal John Froneman said that it is unlikely that the group will pay a final dividend in 2023.
- I recommend buying Sibanye Stillwater shares between $5.50 and $5.00 with potential lower support at $4.80.
Introduction
Johannesburg-based company Sibanye Stillwater Limited ( SBSW ) released its six-month earnings results ending June 30, 2023, on August 29, 2023. It is time to update my prior article and discuss the most recent developments.
Note: This article updates my April 17, 2023 article. I have been following SBSW on Seeking Alpha since Feb. 2014.
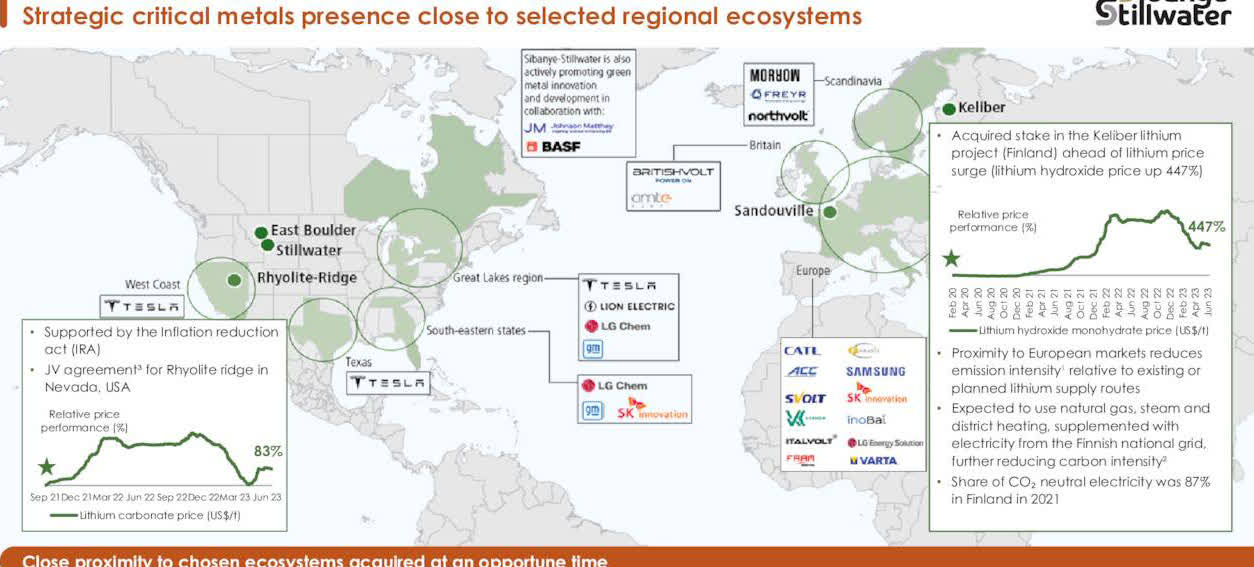
The company released its most recent Presentation on August 2023. The group is mining Platinum, Palladium, Rhodium, Gold, and, most recently, Lithium and Nickel.
SBSW Assets Map (SBSW Presentation August)
1 - H1 2023 Results Snapshot
As I said in my previous article, Sibanye's balance sheet is complex and demands time and patience to properly grasp the company's business model.
The group produces Palladium, platinum, and Rhodium in the USA through its Stillwater acquisition (with a bit of Gold and other metals) from direct mining and recycling (which generates a much lower profit margin).
It also produces Iridium, Ruthenium, Chrome, and even Nickel by acquiring Sandouville in Northern France. However, the most important metals for Sibanye Stillwater are Rhodium, Platinum, and Palladium, followed by Gold.
Sibanye reported profits for H1 2023 attributed to SBSW shareholders of $427 million and revenue of $3,326 million . The company's total profits decreased by 43.8% from H1 2022.
Sibanye Stillwater ended H1 2023 with net cash of $1,182 million.
2 - Investment Thesis
Despite some significant weaknesses recently, I believe Sibanye Stillwater Limited shares are an excellent long-term investment, especially considering the sharp drop in stock price. I find the SBSW stock price attractive for the long term.
Sibanye Stillwater has ventured into a structural transformation, leading the company to be one of the world's largest primary producers of Platinum Group Metals ("PGMs"). The group has expanded into the nickel and lithium segments, providing exposure to the attractive battery metals sector, which is expected to grow significantly.
However, I see the short-to-medium-term outlook for the PGMs as particularly uncertain and difficult, increasing further the downside risk towards the end of 2023 and early 2024, even if the recovering US PGM and South African Gold segments will probably mitigate a portion of the downside effect.
On October 4, 2023, the company warned (emphasis added):
CEO Neal Froneman acknowledged that at spot metal prices the group was unlikely to pay a final dividend in 2023 . He also said the company could be in net debt at the year-end, but added that "we are better positioned than most to ride it out". Froneman's comments come after RMB Morgan Stanley analysts downgraded the gold and platinum group metal company's prospects. At spot prices, it could post a net cash outflow of about R6bn, the bank said.
Overall, there is a strong possibility of materially lower earnings for the full year 2023.
The CEO Neil Froneman said in the conference call:
This has been another period of our results being impacted negatively by one-off events, some of them self-inflicted and some such as the extreme weather events in Australia, an Act of God, or for those of you who believe in climate change also self-inflicted by humanity.
The economy and hence the running of mining operations is in a particularly tough place globally at the moment. And there could well be a downturn as we see it for some time. Remember, we refer to these more as pandemics, and this is where our anti-fragility culture or differentiator stands us in good stead.
While I consider SBSW an excellent long-term PGM miner (platinum group metals), I recommend trading 60% short-term LIFO of your long position.
Taking advantage of the constant volatility in the PGM sector is essential. Trading LIFO lets you keep a core long-term position untouched, earning dividends until the stock reaches your final target while taking advantage of the short-term volatility by accumulating short-term gain and reducing risks.
3 - Stock Performance
The one-year chart comparison shown below indicates the VanEck Vectors Gold Miners ETF ( GDX ), the Aberdeen Standard Physical Palladium Shares ETF ( PALL ), the Aberdeen Standard Physical Platinum Shares ETF ( PPLT ), Sibanye Stillwater, and Impala Platinum ( OTCQX: IMPUY ). I believe these stocks are a good representation of the PGM industry.
SBSW and IMPUY have significantly underperformed in the sector and are now down 40% and 54% on a one-year basis.
It has been a constant, painful slide since January 2022. The outperformance is due to technical problems over the past few months and weakness in the price of Palladium and Rhodium, slightly counterbalanced by the gold price.
Sibanye Stillwater ADR - H2 2022 - Balance Sheet History And Trend - The Raw Numbers
Note: The numbers below are indicated in US$ and can vary depending on the ratio ZAR/. You should expect some minor fluctuations. I choose to tell what the company shows in its recent results with a
An important reminder that I regularly insert in my 6-month report:
Each Sibanye Stillwater ADS represents four (4) Sibanye Stillwater Ltd. Shares. The Sibanye Stillwater ADRs trade on the New York Stock Exchange under SBSW. According to Investopedia :
American depositary receipts ((ADRS)) allow foreign equities to be traded on U.S. stock exchanges. In fact, this is how the stock of most foreign companies trades in U.S. stock markets. Meanwhile, an American depositary share (ADS) is the actual U.S. dollar-denominated equity share of a foreign-based company available for purchase on an American stock exchange.
| Sibanye Stillwater ADR |
| 12/2021 |
| 6/2022 |
| 12/2022 |
| 6/2023 |
| vs. ZAR |
| 15.03 |
| 15.40 |
| 17.33 |
| 18.94 |
| Total Revenues in $ Million |
| 5,461 |
| 4,570 |
| 3,878 |
| 3,326 |
| Basic Net Income attributable to SBSW in $ Million |
| 577 |
| 782 |
| 344 |
| 427 |
| Adjusted EBITDA $ million |
| 1,852 |
| 1,465 |
| 635 |
| 776 |
| EPS in $/share/ per ADR (4x) |
| 0.76/3.04 |
| 0.28/1.12 |
| 0.13/0.52 |
| 0.14/0.56 |
| Operating Cash Flow in $ Million |
| 1,267 |
| 285 |
| 645 |
| 264 |
| Capital Expenditure in $ Million |
| 477 |
| 399 |
| 564 |
| 579 |
| Free Cash Flow in $ Million |
| 790 |
| -111 |
| 81 |
| -315 |
| Cash and cash equivalent $ Million |
| 1,900 |
| 1,673 |
| 1,509 |
| 1,182 |
| Borrowings, including current in $ Million |
| 1,273 |
| 1,282 |
| 1,315 |
| 1,350 |
| Net debt in $ million |
| 0 |
| 0 |
| 0 |
| 0 |
| Dividend per ADR in $/share |
| 0.49 |
| 0.33 |
| 0.27 |
| 0.112 |
| Shares outstanding (diluted) in Million |
| 719.22 |
| 707.73 |
| 707.70 |
| 707.64 |
| Production Au Oz |
| 12/2021 |
| 6/2022 |
| 12/2022 |
| 6/2023 |
| US 2E PGM Production |
| 272,099 |
| 230,039 |
| 191,094 |
| 205,513 |
| US recycling Oz |
| 352,276 |
| 361,333 |
| 237,441 |
| 162,452 |
| US AISC 2E/Oz Stillwater |
| 1,039 |
| 1,366 |
| 1,840 |
| 1,737 |
| SA 4E PGM |
| 941,973 |
| 823,806 |
| 843,658 |
| 799,182 |
| SA AISC 4E/Oz |
| 1,134 |
| 1,179 |
| 1,179 |
| 1,083 |
| 4E PGM Price in $/Oz |
| 2,696 |
| 2,817 |
| 2,434 |
| 1,867 |
| Gold Production Au Oz |
| 554,086 |
| 191,683 |
| 428,859 |
| 416,738 |
| Average gold price $/oz |
| 1,780 |
| 1,864 |
| 1,720 |
| 1,921 |
| AISC Gold $/oz |
| 1,685 |
| 3,115 |
| 2,019 |
| 1,813 |
Source: Company release analysis.
The average historical ratio ZAR/ was 18.94 in H1 2023:
SBSW 6-month ratio US$/ZAR (Fun Trading)
1 - Total Revenues were $3,326 million on January 30, 2023
Note: The revenues in US$ could vary significantly depending on the ratio of /ZAR used. The revenues indicated here are what has been shown by the company.
SBSW 6-month Revenue History (Fun Trading)
Sibanye declared weak 6-month results impacted by lower PGM basket prices in South Africa and the U.S. Also, Sibanye suffered rising production costs and disruptions caused by weather and socio-economic events.
Revenues for the six months ending June 30, 2023, were down to $3,326 million compared to $6,465 million at the end of June 2022. Sibanye Stillwater's earnings per ADR share were $0.56 compared to $1.07 in H1 2022. Revenue declined by 14% , and EBITDA fell by 37%.
SBSW Salient Features H1 2023 (SBSW Presentation)
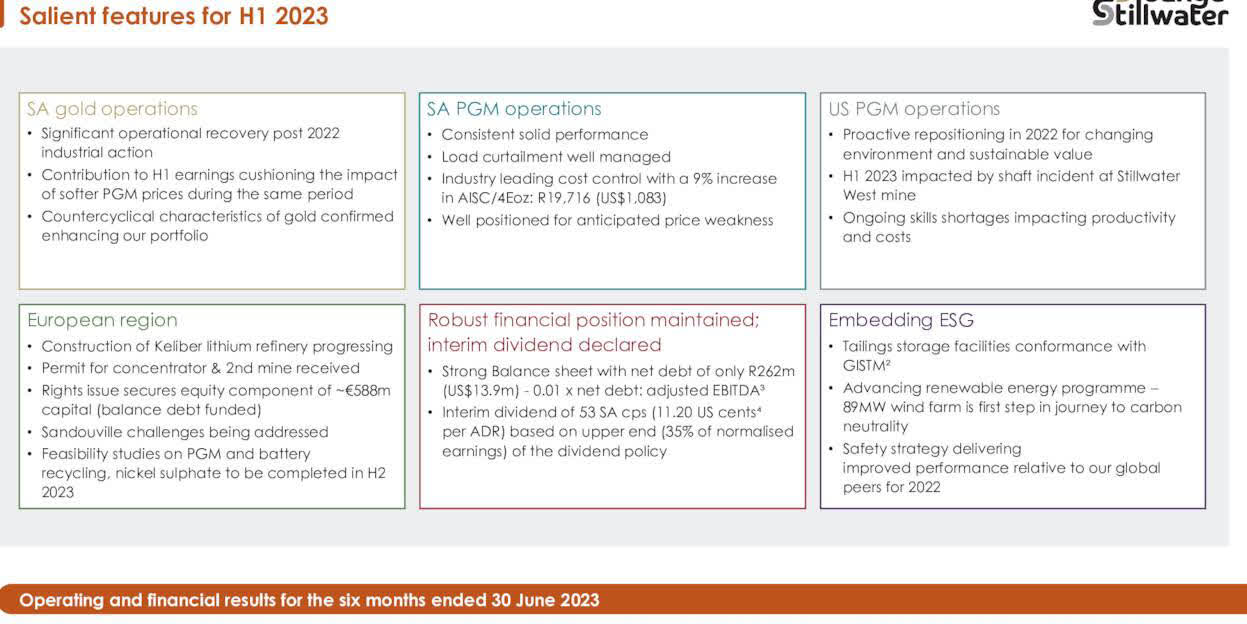
Despite the disappointing results, Sibanye's balance sheet is in good order, with a net debt of $14 million and cash of $1,182 million . Net debt to Adjusted EBITDA was 1x.
2 - Free Cash Flow was negative $315 million on June 30, 2023.
SBSW 6-month Free Cash Flow History (Fun Trading)
Note: Generic free cash flow is cash from operations minus CapEx.
The 12-month free cash flow is $397.55 million , with free cash flow in H1 2023 of negative $315.34 million. The Cash flow from operations was down significantly this semester with $263.7 million.
The dividend for H1 2023 has been set to $0.1119 per share , a yield of about 4% . However, South Africa deducts 25% at the source.
The company warned it may not pay a final dividend for FY2023.
3 - Gross Debt was $1,350 Million at the end of June 2023. No net Debt.
SBSW 6-month Cash versus Debt History (Fun Trading)
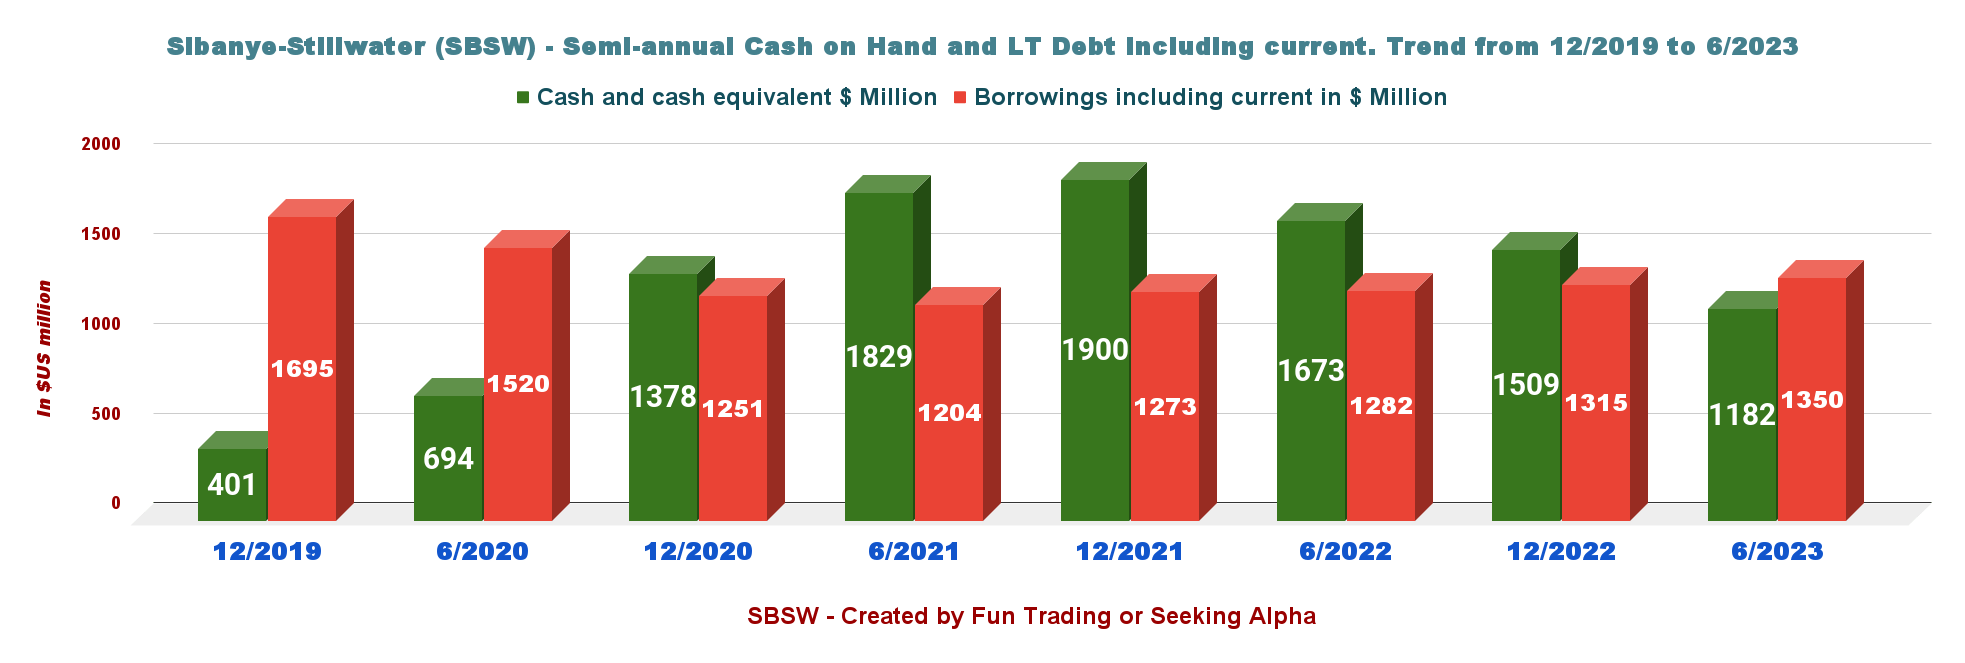
The Cash and Cash equivalents are now $1,182 million , and LT debt, including current (excluding non-recourse debt), is $1,350 million .
4 - H1 2023 Production Analysis
Sibanye Stillwater produces Gold and PGM in South Africa and the USA (Stillwater and Boulder mine) (see details below).
Also, SBSW is producing Nickel in its Sandouville nickel refinery. Production for H1 2023 was 3,493 Metric Tonnes, down from 4,565 Tonnes in H1 2022.
SBSW Sandouville France (SBSW Sandouville France)
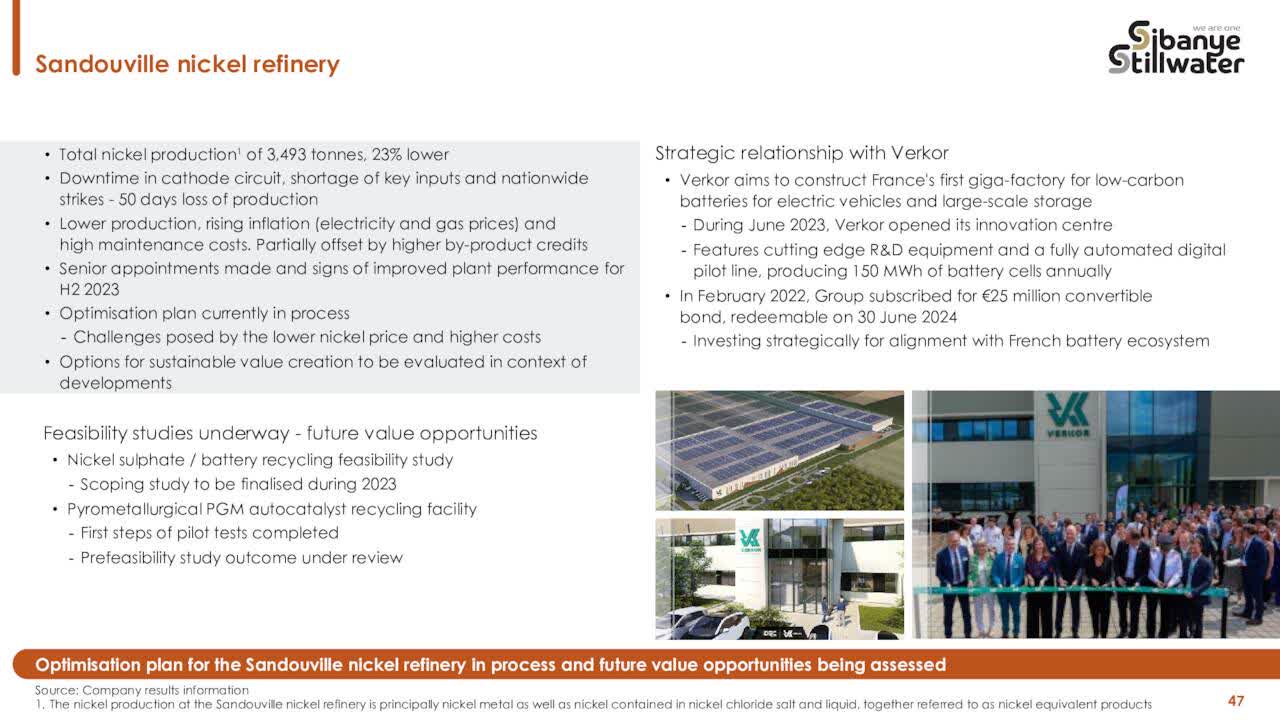
Finally, SBSW is producing Zinc in Australia after acquiring 100% of New Century Resources in March 2023. It indicated its first production of 24K Tonnes in H1 2023. It was a challenging 6-month due to regional flooding and lower Zinc prices.
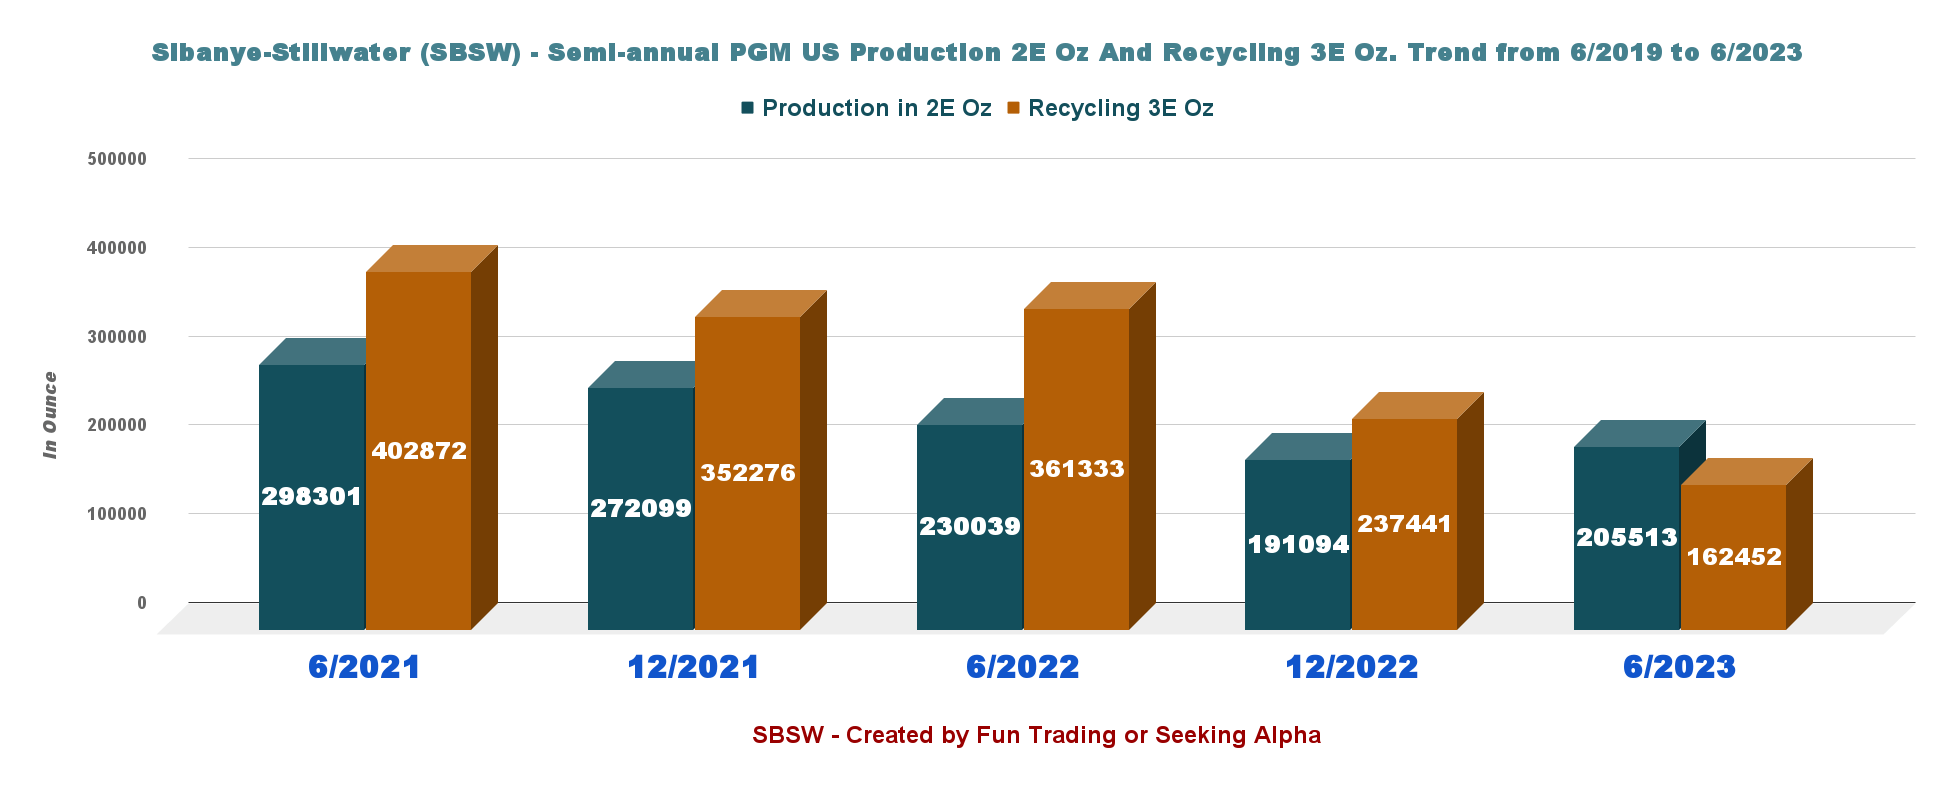
4.1 - US PGM Production 2E PGM Oz And Recycling 3E PGM Oz ("USA")
SBSW 6-month Production 2E PGM History (Fun Trading)
Production was weaker sequentially. U.S. Production 2E/PM was 205,513 2E Oz , down from 230,039 2E Oz last year, and Recycling delivered 162,452 3E Oz, down from 361,333 in 6/2021.
Total production in the U.S. was 367,965 3E Oz , down from 591,372 3E Oz in 6/2022.
The US PGM operations suffered a shaft incident at the Stillwater West mine, which led to weaker production and higher production costs.
Consequently, this issue forced the company to postpone implementing the operational optimization plans to right-size production and costs over three years.
4.2 - South African PGM Production: 4E PGM Oz And Gold Production
SBSW 6-month Production 4E oz and Gold History (Fun Trading)
The Gold production was 416,738 Au Oz , up significantly from 191,683 Au Oz in 6/2022, with an average price of $1,921 per Au Oz from $1,864 in 2022.
The Gold Operations (ex DRD Gold) returned to normal following significant disruptions over the same time last year. Production was up 233% (excl. DRD Gold), whereas production costs fell 47% due to higher production. Moreover, record gold prices were a major component this semester.
The 4E PGM production was 799,182 4E Oz , down from 823,806 4E Oz in 6/2022.
Also, the company indicated $1,867 per Oz for the 4E PGM Price basket, down significantly from $2,434 per 4E PGM in December 2022.
The company indicates three different AISCs. AISC for Gold reached a record high due to the low production this semester.
| AISC type |
| 6/2022 |
| 12/2022 |
| 6/2023 |
| AISC 2E PGM |
| 1,366 |
| 1,840 |
| 1,737 |
| AISC 4E PGM |
| 1,179 |
| 1,179 |
| 1,867 |
| AISC Gold |
| 3,115 |
| 2,019 |
| 1,813 |
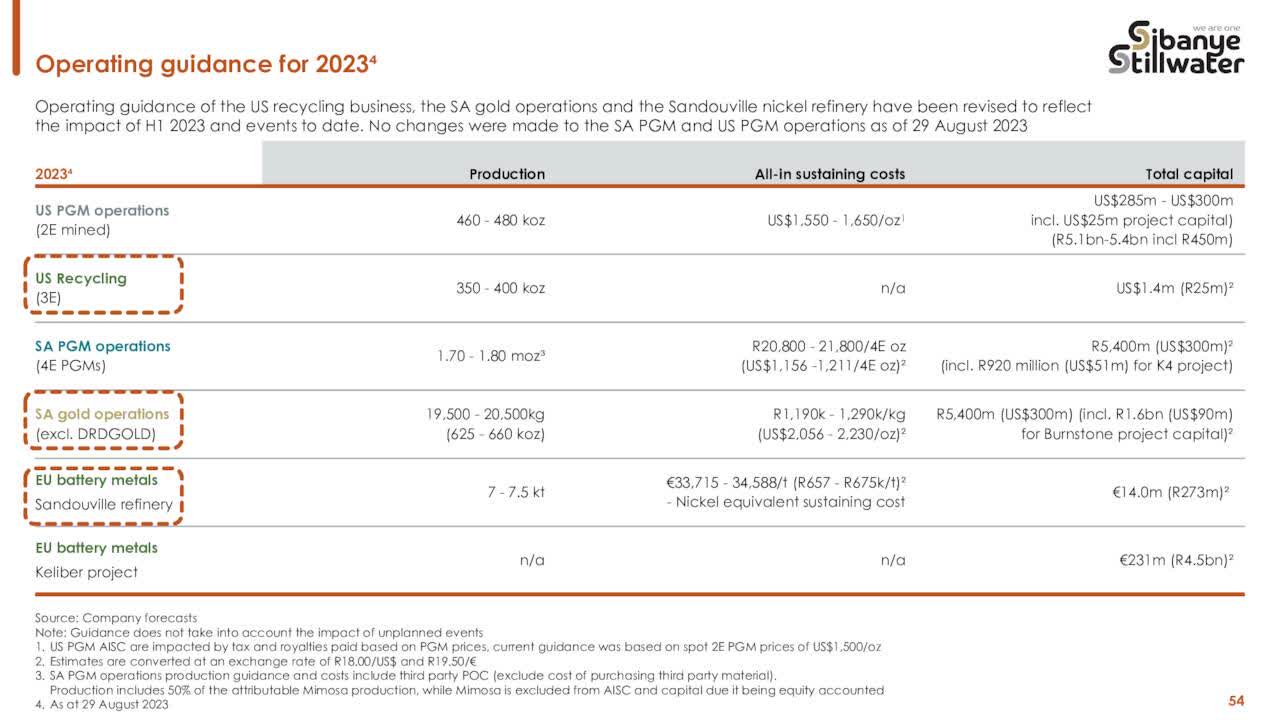
5 - Production Guidance 2023 per region
The U.S. recycling business, the SA Gold operations, and the Sandouville nickel refinery have been revised this semester to reflect the impact of H1 2023.
Production was guided lower across all operations except South Africa's PGMs.
Cost Guidance seems quite optimistic, with PGM and Gold costs revised higher after two incidents reported post-results. Conversely, SA PGM cost guidance was unchanged. Nickel production costs are expected to be nearly 40% higher.
SBSW Operating Guidance 2023 (SBSW Presentation)
6 - The Keliber Lithium Project
Sibanye Stillwater owns 85% of the project. The first phase was approved in November 2022. Furthermore, Sibanye Stillwater approved the second phase of its lithium Project on October 6, 2023. The construction of the lithium refinery commenced in October 2022 and will take about 2.5 years to be completed.
it has approved the commencement of the second phase of its Keliber lithium project which includes the construction of the concentrator and the development of the Syväjärvi open pit mine in Päiväneva in Finland. Delivery of ore from the Syväjärvi open pit mine will be timed to coincide with the commissioning of the concentrator.
The Keliber mine is expected to produce 15K Tonnes of lithium annually with a LOM of 16 years . The balance of the project CapEx will be financed through debt.
The company also owns 50% of the JV with Ioneer in the Rhyolite Ridge Lithium Project.
SBSW The Keliber Lithium Project (SBSW Presentation)
Technical Analysis And Commentary
SBSW TA Chart (Fun Trading StockCharts)
Note: The chart is adjusted from the dividend.
SBSW forms a descending channel pattern with resistance at $6.50 and support at $5.15.
Descending channel patterns are short-term bearish in that a stock moves lower within a descending channel, but they often form within longer-term uptrends as continuation patterns. Higher prices usually follow The descending channel pattern but only after an upside penetration of the upper trend line.
I suggest trading LIFO and taking profits between $6.15 and $6.65 (about 30%) with possible higher resistance at $7.70 and accumulating between $5.50 and $5.00 with potential lower support at $4.80.
Warning: The TA chart must be updated frequently to be relevant. It is what I am doing in my stock tracker. The chart above has a possible validity of about a week. Remember, the TA chart is a tool only to help you adopt the right strategy. It is not a way to foresee the future. No one and nothing can.
For further details see:
Sibanye Stillwater: Weakness Ahead Offers Opportunity