SLGN - Silgan: The Historical Growth Rate While Not Fantastic Is Even Not Sustainable
2023-09-29 04:41:52 ET
Summary
- Silgan revenue and earnings have grown primarily through acquisitions and price growth, rather than organic growth or volume growth.
- SLGN has a high debt-equity ratio and no signs of strong fundamentals as there were no uptrends in ROE and operating parameters.
- There is no margin of safety at the current high product selling prices. With an unsustainable Reinvestment rate, it is not an investment opportunity yet.
Investment Thesis
Silgan Holdings Inc. ( SLGN ) revenue and earnings grew by about 80% over the past 12 years. But this was driven more by acquisitions than organic growth. It was also due more to price growth rather than volume growth.
Acquisitions were carried out at an unsustainable Reinvestment rate. There were also no uptrends in the ROE and operating parameters. At the same time, it has a high debt-equity ratio. All these do not point to strong fundamentals.
There is only a margin of safety if you assume that the current high product prices can be sustained, as well as scaling down the Reinvestment rate to a sustainable level. There are no signs of these. This is not an investment opportunity yet.
Business Background
SLGN is a leading manufacturer of sustainable rigid packaging solutions for the world. Although SLGN has worldwide operations, the US accounted for about ¾ of the group's revenue over the past 12 years.
Its products are categorized into 3:
- Dispensing and specialty closures.
- Metal containers. This was the biggest revenue contributor over the past 12 years.
- Custom-designed plastic containers.
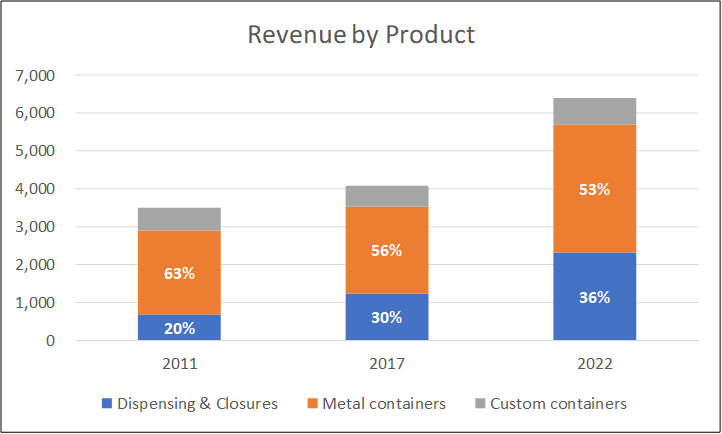
Over the past 12 years, the 3 segments achieved different growth rates. The dispensing and specialty closures segment revenue grew at a much higher rate compared to that of the metal containers segment.
The result was that by 2022, the % contribution by the metal containers segment reduced to 53 %. The dispensing and specialty closures segment increased from 20% in 2011 to 36 % in 2022. Refer to Chart 1.
SLGN's business strategy is to focus on the following key elements.
- Supply "best value" packaging products with high levels of quality, service, and technological support.
- Maintain a low-cost producer position.
- Maintain an optimal capital structure to support growth and increase shareholder value.
- Expand through acquisitions and organic (internal) growth.
- Enhance profitability through productivity improvements and cost reductions.
These strategic elements have been repeated in all its 2011 to 2022 Forms 10k. I would interpret this as the company having a consistent business strategy.
My analysis aims to assess how well the company has delivered on items 3 to 5 and build them into my valuation.
In its Mac 2023 presentation, the company presented sales and EBITDA trends from 2013. However, when I looked at its acquisition history, I found that the amount spent in 2011 and 2012 was about the same as that for 2013. As such I decided to analyse its performance from 2011 to 2022.
Operating trends
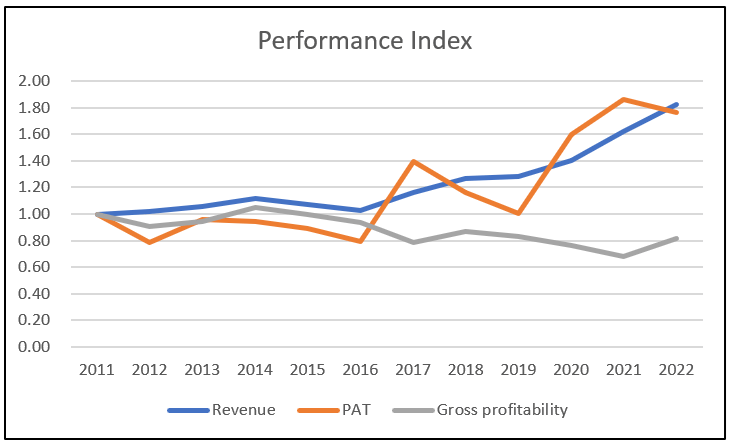
I looked at 3 metrics to get an overview of the overall performance - revenue, PAT, and gross profitability (gross profits / total assets). Refer to Chart 2.
You can see that both revenue and PAT in 2022 was about 80% higher than those in 2011. Revenue grew at 5.6 % CAGR while PAT grew at 5.3 % CAGR.
This is not an exceptional growth rate considering that:
- Over the same period, the US GDP grew at 4.6 % CAGR.
- SLGN spent USD 3.6 billion on acquisitions. This is sizeable as its total assets in 2011 was only USD 3.0 billion. Over the same period, the company also spent USD 2.2 billion on CAPEX.
Chart 2: Performance Index (Author)
Note to Chart 2: To be able to plot the various metrics on one chart, I have converted the various metrics into indices. The respective index was created by dividing the various annual values by the respective 2011 values.
The greater concern was the declining gross profitability. You can see that the gross profitability in 2022 at 14.3 % was lower than the 17.4 % in 2011. This is not a sign of improving capital efficiency.
This poor capital efficiency picture is supported by the DuPont Analysis. This showed declining asset turnover over the past 12 years. Refer to Chart 3.
- There was no long-term uptrend in the ROE. ROE declined from 29 % in 2011 to 20 % in 2022.
- There was no improvement in the operating margin. Over the past 12 years, there were only 3 years when the operating margins were higher than that in 2011.
This is reinforced by the Selling, General, and Administration or SGA margins. While revenue had about doubled from 2011 to 2022, the SGA margin in 2021/22 averaged 5.5 % compared to the average 2011/12 margin of 5.3 %.
The only positive sign was that although leverage increased around the mid-2010s, by 2022, it had dropped back to around the 2011 level.
Chart 3: DuPont Analysis (Author)
Note to Chart 3: I converted the various metrics into indices by dividing the values in the various years by the respective 2011 values.
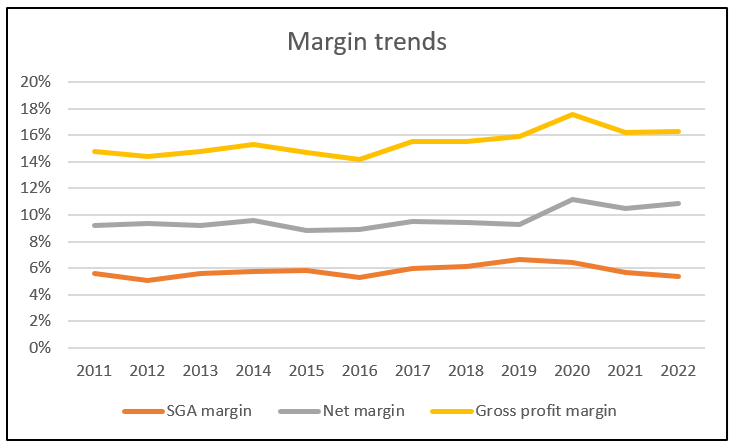
The poor ROE is a reflection of poor operating efficiencies. This can be seen from Chart 4 which shows the trends in gross profit margin, SGA margin, and net margin (gross profit margin - SGA margin).
- There were only slight improvements in the gross profit margin before 2020. The bigger improvement came in 2021.
- The SGA margin did not show any improvements (declining trend) before 2020.
The result was that the net margin was almost flat from 2011 to 2019. It only improved in 2020 onwards.
Chart 4: Margin trends (Author)
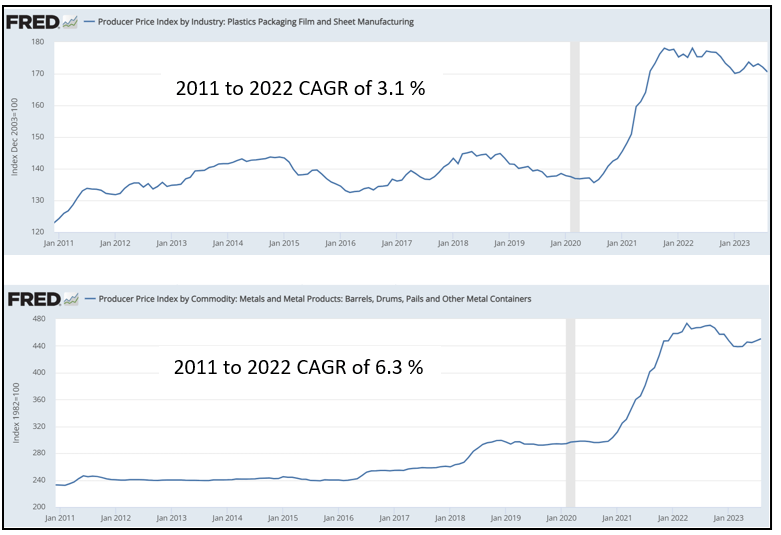
I would argue that the post-2020 improvement was due to increased selling prices. Refer to Chart 5 showing the FRED Producer Price Index for plastic packaging and metal containers.
While there were long-term price growths, a significant part of the increase was due to price jumps over the past 2 years.
Comparing Chart 5 with Chart 3, the improvement in the operating margins post-2020 coincided with the Producer Price Indices jumps. In other words, net margin improvement over the past 2 years was due to external factors rather than management efforts to improve productivity or efficiencies.
Consolidated net sales…representing a 15.3 percent increase as compared to 2020 primarily as a result of the pass through of higher raw material and other costs…" 2021 Form 10k.
Consolidated net sales…representing a 12.9 percent increase as compared to 2021 primarily as a result of higher selling price due to the pass through of higher raw material and other inflationary costs…" 2022 Form 10k.
All the above are not clear signs of a company that has "…enhance profitability through productivity improvements and cost reductions…"
Chart 5: Packaging Producer Price Index (FRED)
You should not be surprised by the increases in the Producer Price Indices over the past few years. There have been similar price spikes for raw materials such as metal and resins (linked to oil prices).
While there has been some downturn in metal prices (refer to my steel company analysis ), crude oil prices seem to be holding. Your view of the prospects of SLGN will depend on your view of the commodity prices.
1H 2023
In the first six months of 2023, revenue decreased by 4.7 % as compared to that for the first six months of 2022. The company attributed this to several reasons including lower volumes, non-recurring net sales in the first six months of 2022, and unfavorable forex.
PAT also decreased from USD 301 million in the first half of 2022 to USD 275 million in the first half of 2023. This was due to lower volume, and higher pension expenses despite a better product mix.
In the context of operating improvements, I consider quarterly results as "noisy" and pay less attention to them compared to the longer-term trends.
Growth
Over the past 12 years, revenue grew at 5.6 % CAGR due to both acquisitions and organic growth. The company did not provide a breakdown of the annual revenue due to organic growth and that due to acquisitions.
However, over the past 12 years, the company spent USD 3.6 billion on acquisitions compared to USD 2.2 billion for CAPEX. It is possible that the CAPEX for a particular year included those for facilities acquired in the past.
Given the above, it would be reasonable to deduce that without the acquisitions, the revenue growth would be reduced by more than half. This is not a growth company.
At the same time, the packaging sector is not a growth one. For example, the global packaging market is expected to grow at a CAGR of:
- 3.94% during the forecast period 2023-2028 - Mordor Intelligence
- 3.92 % during the forecast period 2023 to 2027 - Research and Markets
From 2012, SLGN provided a breakdown of its product sales into % change due to unit volume and others (price changes, forex, etc.).
I estimated the annual dollar increase due to volume by multiplying the % change by the respective product revenue of the previous year. The results for the past 11 years are summarized in Table 1. Note that these growths included acquisitions.
While this is a back-of-envelope analysis, it pointed out that SLGN growth was not volume-driven.
Table 1: Sources of revenue growth (Author)
This is consistent with the FRED data in Chart 5. Price growth probably accounted for a significant part of SLGN revenue growth.
I think the following from SLGN's 2022 Form 10k supports my view that it was not volume-driven.
"In 2019, we initiated a multi-year footprint plan in our metal container business in the United States to reduce capacity…"
There is no reason to reduce capacity if the company is experiencing volume growth.
Reinvestments
Growth needs to be funded and one metric for this is the Reinvestment rate. This is defined as:
Reinvestment = CAPEX & Acquisitions - Depreciation & Amortization + Net Changes in Working Capital.
I then determined the Reinvestment rate = Reinvestment / after-tax EBIT.
Acquisitions are an integral growth driver for the company. As such I have included the annual acquisition expenditure as part of the CAPEX.
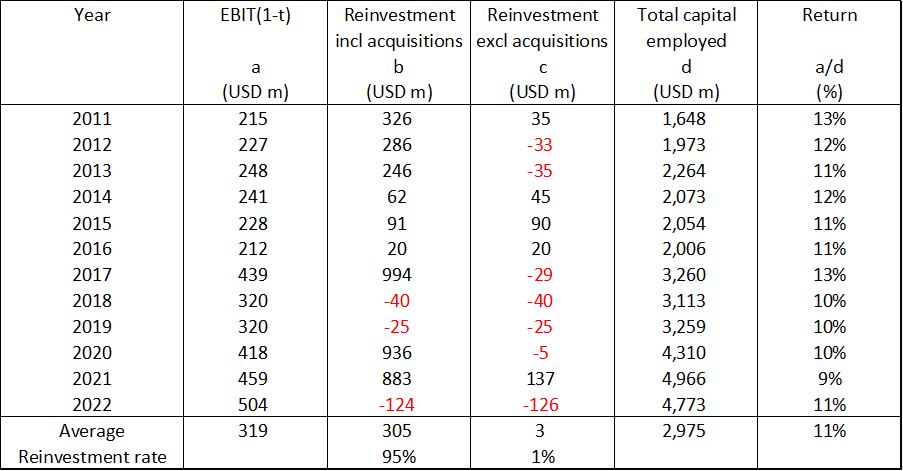
As can be seen from Table 2, the Reinvestment rate with acquisitions was 95 %. This meant that for every dollar of after-tax operating income, 95% was spent to fund growth. This is not a sustainable Reinvestment rate as the company needs funds for dividends and to repay its debt.
If we exclude the acquisition expenditure, the Reinvestment rate reduced to 1%. I am not suggesting that the company should stop its acquisitions. Rather I am saying that its past 12 years acquisitions are not sustainable. Is this a sign of a company with a good capital allocation plan?
Table 2. Reinvestment rate (Author)
Did growth over the past 12 years create shareholders' value? For growth to create shareholders' value, the returns have to be greater than the cost of funds.
Over the past 12 years, the average return as measured by EBIT(1-t) / TCE was 11 %.
I defined TCE = total capital employed = Total Equity + total Debt - Cash.
As can be seen from Table 3, this 11 % far exceeded the weighted average cost of capital of 6%.
Table 3: Estimating the Cost of Capital (Various)
Note to Table 3:
a) Based on the Google search for the term "SLGN WACC".
b) Simply Wall Street did not provide its estimate of the WACC.
What are the takeaways for the valuation of SLGN?
Over the past 12 years, it managed to grow its revenue and earnings. While this growth has created shareholders' value, it is not a sustainable growth rate.
The Reinvestment rate required for growth far exceeded the after-tax EBIT. I postulate that growth via acquisitions will have to eventually slow down to a sustainable rate.
What can be a sustainable Reinvestment rate? I suggest that this can be determined from the fundamental growth equation where:
Growth = Return X Reinvestment Rate.
Financial position
I normally avoid companies with a debt equity ratio greater than 1. This was my first red flag for SLGN as its debt equity ratio was 2.2 as of June 2023.
I also have other concerns about its financial position based on the following:
As of the end of June 2023, it had USD 237 million in cash. This was only about 3 % of its total assets. The cash had reduced from USD 586 million as of the end of Dec 2022.
As of the end of June 2023, it had a debt / total capital ratio of 69%. According to Damodaran Jan 2023 datasets, the packaging and container sector average ratio was 38 %.
But there were also positive points:
- Over the past 12 years, it generated positive cash flow from operations every year. It generated about USD 454 million in cash flow from operations annually compared to an annual average PAT of USD 228 million. This is a good cash conversion ratio.
- Its average cash conversion cycle improved from 56 days in 2011/12 to about 24 days in 2021/22.
- Its EBITDA / interest expenses for the past 2 years averaged 6.6.
My earlier analysis suggests that its debt equity position was due to its high Reinvestment rate. Management has stated that it plans to reduce debt. But this is not achievable if it continues with acquisitions at an unsustainable Reinvestment rate.
Capital allocation
Over the past 12 years, SLGN raised about USD 7.8 billion of funds from cash flow from operations and net debt (after accounting for debt repayments). Refer to Table 4.
You can see that the cash flow from operations was sufficient to fund the dividends & buybacks as well as CAPEX. There was USD 1.8 billion left for acquisitions and miscellaneous.
But the cash acquisitions far exceeded this balance sum, so it had to raise debt. I had already mentioned that its historical acquisitions were at an unsustainable reinvestment rate. This shows the financial impact.
From this perspective, it was not an optimal capital structure to support growth. While shareholders value was created there was no reduction in financial risk.
- The debt capital ratio in 2021/22 averaged 0.65 compared to 0.63 for 2011/12.
- The EBITDA / interest expense averaged 8.5 in 2021/22 compared to 7.8 in 2011/12.
Table 4: Sources and Uses of Funds (Author)
Valuation
The value of a company depends on its expected future cash flow as per the following equation:
Free Cash Flow to the Firm (FCFF) = EBIT(1-t) X (1 - Reinvestment rate).
If SLGN continues with the past 12 years' Reinvestment rate, the FCFF would be very low. But the picture is different if SLGN reduces the Reinvestment rate to a sustainable level.
2 other key variables drive the FCFF. They are revenue and net margins.
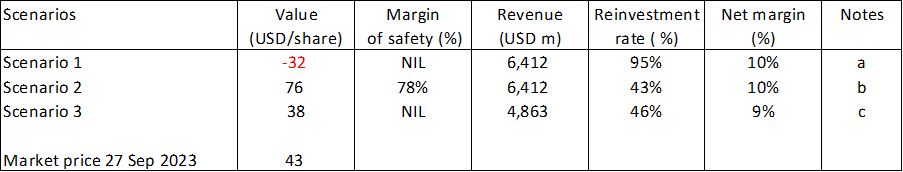
Given these, I considered 3 Scenarios in my valuation.
Scenario 1. This is the historical situation with a high Reinvestment rate of 95 % as per Table 2. The revenue is assumed to be the same as that for 2022 with the net margins based on the past 12 years' average.
Scenario 2. This assumes a sustainable Reinvestment rate. The revenue and net margins are as per Scenario 1.
Scenario 3. This is a conservative one where I "washed out" the 2020 to 2022 high price growth. As such I adjusted the 2022 revenue downwards by the past 3 years' price growth. Net margin was based on the 2011 to 2019 values. I assume a sustainable Reinvestment rate.
For all the Scenarios, I assumed a 4% growth rate pegging it to the growth in global packaging industry.
The results of the valuation and the key parameters are shown in Table 5.
- There is no margin of safety under Scenario 1.
- There is more than a 30% margin of safety under Scenario 2
- Scenario 3 seems to represent the market price.
Comparing the parameters in Scenario 1 and 2, you can see that the Reinvestment rate has a critical role in the valuation.
Scenario 2 is a tough one. First, you must believe that metal and crude oil prices will continue to be high. Then you expect management to scale down its acquisition plans to achieve a sustainable Reinvestment rate.
I believe that Scenario 3 is more likely as I believe that metal and crude oil prices are cyclical and will revert to their historical "averages". Of course, management will still have to scale down its acquisition plans to achieve a sustainable Reinvestment rate.
As such I believe that SLGN is fairly valued at its current market price.
Table 5: Summary of valuation (Author)
Notes to Table 5:
a) Revenue based on 2022. Reinvestment rate and SGA margin based on the 2011 to 2022 average.
b) Revenue based on 2022. Reinvestment rate based on sustainable rate. SGA margin based on the 2011 to 2022 average.
c) Revenue based on 2022 adjusted for 2020 to 2022 price growth. Reinvestment rate based on sustainable rate. SGA margin is based on the 2011 to 2019 average.
Valuation model
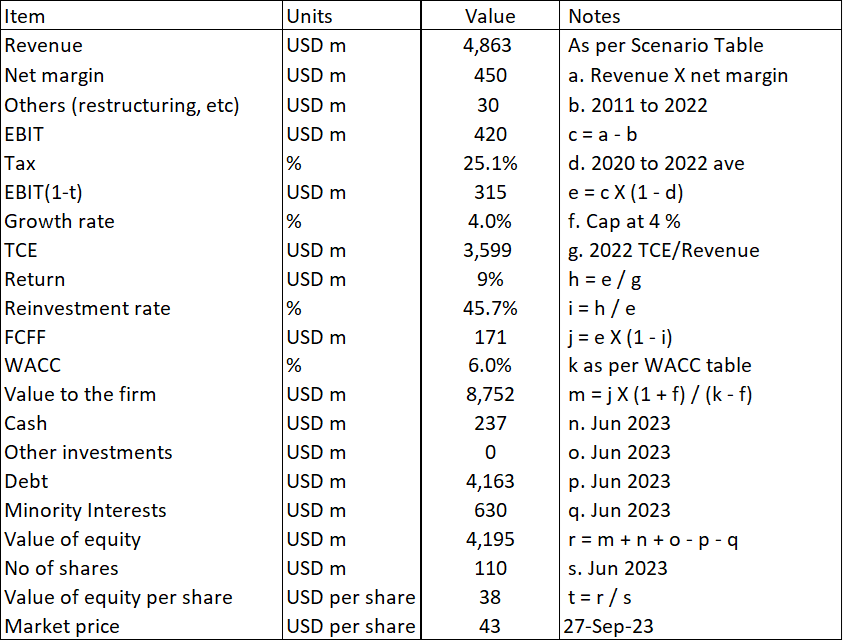
My valuation is based on the single-stage Free Cash Flow to the Firm model as illustrated in Table 6
Table 6: Sample valuation for Scenario 3 (Author)
The critical parameters in my model are the Revenue, Reinvestment rate, and net margins. These are derived as per the assumptions in Table 5.
Most of the items are self-explanatory except for the following:
- Item b. This is to cover the past 12 years' restructuring charges, legal, and other unusual cost.
- Item d. The tax rate was based on the past 3 years' average tax rate to account for the international operations.
- Item g. The TCE was derived based on the (2022 Revenue / TCE ratio) X Revenue
- Item h. Return = EBIT(1-t) / TCE.
- Item i. The sustainable Reinvestment rate = growth / Return in this sample calculation.
Risks and limitations
There are 2 critical assumptions in my valuation:
- Sustainable Reinvestment rate.
- Additional margin of safety from a more efficient TCE.
In Scenario 2 and 3, I have assumed that SLGN reduces its Reinvestment rate immediately. This is the essence of the single-stage valuation model. If the company takes a few years to reach the sustainable Reinvestment rate, then the value would be lower than those shown in Table 5.
If you look at item "g" in Table 6, you can see that the derived TCE is USD 3.6 billion. This is because the revenue was reduced to USD 4.9 billion. I am not even assuming any improvement in the asset turnover as I assumed the 2022 TCE / revenue ratio.
In other words, the total capital required for the business would be reduced when compared to the actual total capital employed of USD 5.8 billion as of the end of June 2023. This meant that there would be US 2.2 billion (about USD 20 per share) of "excess capital" that could be used to either reduce debt or return to shareholders.
I consider this a hidden margin of safety as it depends on the company reducing the Reinvestment rate to a sustainable level. At the same time, it has to ensure that there is no deterioration in the asset turnover and other operating parameters.
My analysis suggests that there is potential for SLGN's value to be higher than what I have shown under Scenario 3. But this will have to depend on management taking a different acquisition route.
Conclusion
SLGN has achieved revenue and profit growth over the past 12 years. But these were due to acquisitions and price growth rather than efficiency or productivity improvements. Growth was also funded by debt rather than just by internally generated funds.
I do not consider SLGN as strong fundamentally:
- There were no improvements in ROE, gross profitability, asset turnover, or operating margins.
- I also have concerns about its financial strengths.
- Growth was due to acquisitions at an unsustainable Reinvestment rate.
But there is a better growth path for SLGN that requires pegging the Reinvestment rate to a sustainable level. This will probably mean fewer acquisitions. The company then has to make up for the impact on profit (due to the reduced growth) by delivering efficiency and productivity improvements.
Furthermore, there is only a margin of safety if you assume that the current high product prices are sustainable, and a reduction in the Reinvestment rate to a sustainable rate.
You can understand why I do not consider SLGN an investment opportunity as I have yet to see a track record of productivity improvements. The company has also not stated any plan to match acquisitions with internally generated funds. On top of these, there is no margin of safety.
I am a long-term value investor and my analysis and valuation are based on this perspective. This is not an analysis for those hoping to make money over the next quarter or so.
For further details see:
Silgan: The Historical Growth Rate, While Not Fantastic, Is Even Not Sustainable