SILK - Silk Road Medical: Big Nearby Cap-Gain Medical Equipment Stock Prospect
2023-05-16 01:53:30 ET
Summary
- This article is an investment recommendation based not on the critique of corporate productivity, competitive ability, or profit management measured by forecasts of EPS, but on communication skills.
- Investment achievement depends upon acceptance, by others than present owners, of the probability that per share prices can likely rise to attractive rates of gain in reasonable holding periods.
- Acceptance also with sufficient odds of continuing holding value to withstand the conversion of investment gains into persistent wealth-taking liquidity conversions.
- Communication is evidenced by financial-protection actions (hedging) which define the boundaries of credibility, providing knowledgeable investor comfort within clearly forecast price limits.
- The systemic market behavior of “institutional investors”, the best-informed, most strongly resourced financially and humanly equipped participants, makes Silk Road Medical, Inc. attractive among alternative equities here.
The primary interest of this article is Silk Road Medical, Inc. ( SILK ).
Investment Thesis
Investing strategy needs to support long-term objectives but the pace of technological advances in this 21st century no longer allows a passive strategic conduct of "buy&hold" so effective in the last half of the 20th century.
Instead, the long-term objective needs the continued, persistent Active Investment strategy supported by shortened forecast horizons and readily-invoked discipline now economically encouraged by trade-commission-free competitive brokerages for smaller (than institutions) individual investors.
While such shortened-horizon forecasts may employ "fundamental analysis" frequent measurements at their base, Active investment Discipline depends on frequent, near-continuous monitoring of investor attitudes evidenced among market participants, both individuals and institutions.
Fundamentals indicated by financial records tend to be time-periodic in nature, but investor attitudes get moved by both reasoning and emotional triggers not often well-behaved and predictable. A readily-available and continuously-updated source of these changes is available from the price-disruptive presence of large, irregular presence of institutional-investor "block trades" in specific stocks.
The required mechanics of continuous market-making for both large- and small-scale investors forces moment-by-moment revelation of current acceptability of specific stock price range limits, low and high. Their availability along with subsequent market actions produce historic records of how well such forecasts have been seen under differing sets of balance between upside and downside coming price change prospects.
The market-making community does not provide flawless forecasts, but a sense of historic odds for profitable success among various stocks has been generated during more than two decades of daily updating and record-keeping. Comparison between alternatives is important, and is provided herein.
Description of the Corporation of Current Investment Interest
Silk Road Medical, Inc. operates as a medical device company in the United States. The company offers various products for the treatment of carotid artery disease called transcarotid artery revascularization. Its products include system that is used to directly access the common carotid artery and initiate temporary blood flow reversal and a specialty balloon for the TCAR procedure. Silk Road Medical, Inc. was incorporated in 2007 and is headquartered in Sunnyvale, California."
Source: Yahoo Finance
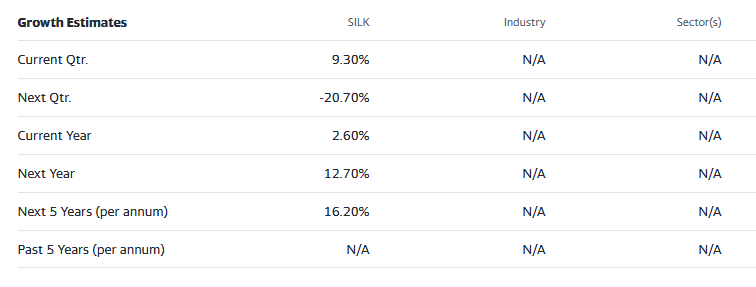
These growth estimates have been made by and are collected from Wall Street analysts to suggest what conventional methodology currently produces. The typical variations across forecast horizons of different time periods illustrate the difficulty of making value comparisons when the forecast horizon is not clearly defined.
Alternative Medial Equipment Investments Compared
Here are several businesses similar to Silk Road Medical, Inc.. Following the same analysis as with SILK, historic sampling of today's Risk~Reward balances were taken for each of the alternative investments. They are mapped out in Figure 1.
Figure 1
blockdesk.com
Expected rewards for these securities are the greatest gains from current closing market price seen worth protecting short positions. Their measure is on the horizontal green scale.
The risk dimension is of actual price drawdowns at their most extreme point while being held in previous pursuit of upside rewards similar to the ones currently being seen. They are measured on the red vertical scale.
Both scales are of percent change from zero to 25%. Any stock or ETF whose present risk exposure exceeds its reward prospect will be above the dotted diagonal line. Capital-gain attractive to-buy issues are in the directions down and to the right.
Our principal interest is in SILK at location [10], at the lower right margin of Figure 1. A "market index" norm of reward~risk tradeoffs is offered by SPY at [8]. Most appealing (to own) by this Figure 1 view is SILK. But there may be other reasons to commit capital, so please see Figure 2 .
Comparing features of Alternative Investment Stocks
The Figure 1 map provides a good visual comparison of the two most important aspects of every equity investment in the short term. There are other aspects of comparison which this map sometimes does not communicate well, particularly when general market perspectives like those of SPY are involved. Where questions of "how likely' are present other comparative tables, like Figure 2, may be useful..
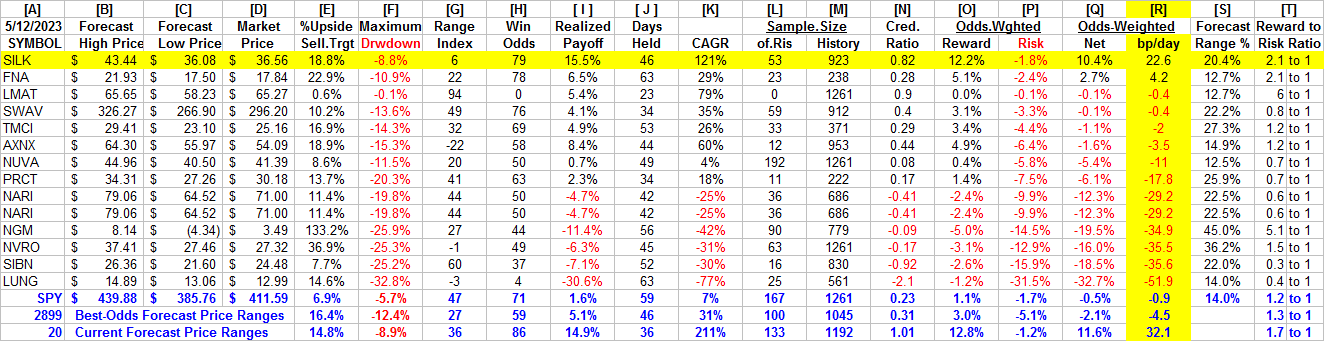
Yellow highlighting of the table's cells emphasize factors important to securities valuations and the security SILK, most promising of near capital gain as ranked in column [R].
Figure 2
Why do all this math?
Figure 2's purpose is to attempt universally comparable answers, stock by stock, of a) How BIG the prospective price gain payoff may be, b) how LIKELY the payoff will be a profitable experience, c) how SOON it may happen, and d) what price drawdown RISK may be encountered during its holding period.
Readers familiar with our analysis methods after quick examination of Figure 2 may wish to skip to the next section viewing Price range forecast trends for SILK.
Column headers for Figure 2 define investment-choice preference elements for each row stock whose symbol appears at the left in column [A]. The elements are derived or calculated separately for each stock, based on the specifics of its situation and current-day MM price-range forecasts. Data in red numerals are negative, usually undesirable to "long" holding positions. Table cells with yellow fills are of data for the stocks of principal interest and of all issues at the ranking column, [R].
The price-range forecast limits of columns [B] and [C] get defined by MM hedging actions to protect firm capital required to be put at risk of price changes from volume trade orders placed by big-$ "institutional" clients.
[E] measures potential upside risks for MM short positions created to fill such orders, and reward potentials for the buy-side positions so created. Prior forecasts like the present provide a history of relevant price draw-down risks for buyers. The most severe ones actually encountered are in [F], during holding periods in effort to reach [E] gains. Those are where buyers are emotionally most likely to accept losses.
The Range Index [G] tells where today's price lies relative to the MM community's forecast of upper and lower limits of coming prices. Its numeric is the percentage proportion of the full low to high forecast seen below the current market price.
[H] tells what proportion of the [L] sample of prior like-balance forecasts have earned gains by either having price reach its [B] target or be above its [D] entry cost at the end of a 3-month max-patience holding period limit. [ I ] gives the net gains-losses of those [L] experiences.
What makes SILK most attractive in the group at this point in time is its basic strength of reward to risk ratio of 2.1 to 1 in [T], more than the brevity of holdings needed to reach closeout prices..
Further Reward~Risk tradeoffs involve using the [H] odds for gains with the 100 - H loss odds as weights for N-conditioned [E] and for [F], for a combined-return score [Q]. The typical position holding period [J] on [Q] provides a figure of merit [ fom ] ranking measure [R] useful in portfolio position preferencing. Figure 2 is row-ranked on [R] among alternative candidate securities, with SILK in top rank.
Along with the candidate-specific stocks these selection considerations are provided for the averages of some 3000+ stocks for which MM price-range forecasts are available today, and 20 of the best-ranked (by fom ) of those forecasts, as well as the forecast for S&P500 Index ETF ( SPY ) as an equity-market proxy.
Current-market index SPY is not competitive as an investment alternative. Its Range Index of 47 indicates 53% of its forecast range is to the upside, but Less than 3/4ths of previous SPY forecasts at this range index produced profitable outcomes, with enough losers to put its average payoff in low single-digit positive result.
As shown in column [T] of figure 2, those levels vary significantly between stocks. What matters is the net profit between investment gains and losses actually achieved following the forecasts, shown in column [I]. The Win Odds of [H] tells what proportion of the Sample RIs of each stock were profitable. Odds below 80% often have proven to lack reliability.
Recent Price Range Forecast Trends for SILK
Figure 3
blockdesk.com
No, this is not a "technical analysis chart", I am showing only historical data. It is a Behavioral Analysis picture of the Market-Making community's actions in hedging investments of the subject. Those actions define expected price change limits shown as vertical bars with a heavy dot at the closing price on the date of the forecast.
It is an actual picture of the expected future prices for SILK made by experienced market professionals, not a simple hope of a recurrence of the past. Expectations backed up by significant bets of investment capital made to protect market-makers or earn a proprietary profit from risk-taking.
The special value of such pictures is their ability to immediately communicate the balance of expectation attitudes between optimism and pessimism. We quantify that balance by calculating what proportion of the price-range uncertainty lies to the downside, between the current market price and the lower expected limit, labeled the Range Index [RI].
A RI at zero indicates no further price decline is likely, but not guaranteed. The odds of 3 months passing without either reaching or exceeding the upper forecast limit or being at that time below the expected lower price (today's) are quite slight.
The probability function of price changes for SILK are pictured by the (thumbnail) lower Figure 3 frequency distribution of the past 5 years of RI values with the today value indicated.
Conclusion
The multi-path valuations explored by the analysis covered in Figure 2 is rich testimony to the near-future value prospect advantage of a current investment in Silk Road Medical, Inc. over and above the other compared alternative investment candidates.
For further details see:
Silk Road Medical: Big Nearby Cap-Gain Medical Equipment Stock Prospect