FCNCO - Silver Beech Capital Q2 2023 Investor Letter
2023-07-15 06:50:00 ET
Summary
- Silver Beech is a value-oriented, fundamentals-driven investment firm that targets high-quality but misunderstood North American businesses and deep value opportunities.
- We are pleased with Silver Beech’s 14.1% year-to-date performance.
- Outside of our new investment in Google, we have found most of our other opportunities in asset-rich, mid-capitalization businesses and value-oriented special situations.
- Silver Beech’s financials investments havesubstantially outperformed the S&P 500’s financials sector losses of -4%(since Silver Beech’s January 11 inception).
Dear Fellow Investors and Friends,
The estimated year-to-date 2023 and historical net performance for Silver Beech Capital, LP (“the Fund” or “Silver Beech”) is presented below. Monthly and quarterly results can be found on page 8.
Performance Summary
| Silver Beech |
| S&P 500 |
| Russell 2000 |
| 2021 |
| Track Record |
| 32.6% |
| 28.7% |
| 14.8% |
| 2022 |
| Track Record |
| 6.9% |
| (18.1%) |
| (20.4%) |
| 2023 YTD (6/30) |
| Silver Beech |
| 14.1% |
| 14.5% |
| 4.4% |
| January 1, 2021 – June 30, 2023 |
| Cumulative |
| 61.7% |
| 20.6% |
| (4.6%) |
| Compound Annual Return |
| 21.5% |
| 7.9% |
| (1.9%) |
| Value of $100 Invested |
| $162 |
| $121 |
| $95 |
| Returns presented above for Silver Beech are net of 1% management fee and 20% incentive fee above a 6% hard hurdle as of June 30, 2023, and since inception (January 11, 2023). Each Investor’s actual performance will vary depending on the timing of their contribution(s) and fees. Returns for the S&P 500 and Russell 2000 include dividend reinvestment. YTD returns begin January 11 to match Silver Beech’s inception. Please see additional disclosure. |
We aim to take a long-term view, but we are pleased with Silver Beech’s 14.1% year-to-date performance. Silver Beech has generated strong absolute returns considering our downside-oriented investment philosophy, and strong relative returns compared to the S&P 500 ( SP500 , SPX ), in light of the risk-taking and speculation that we see reflected in the ballooning valuations of the largest technology companies.
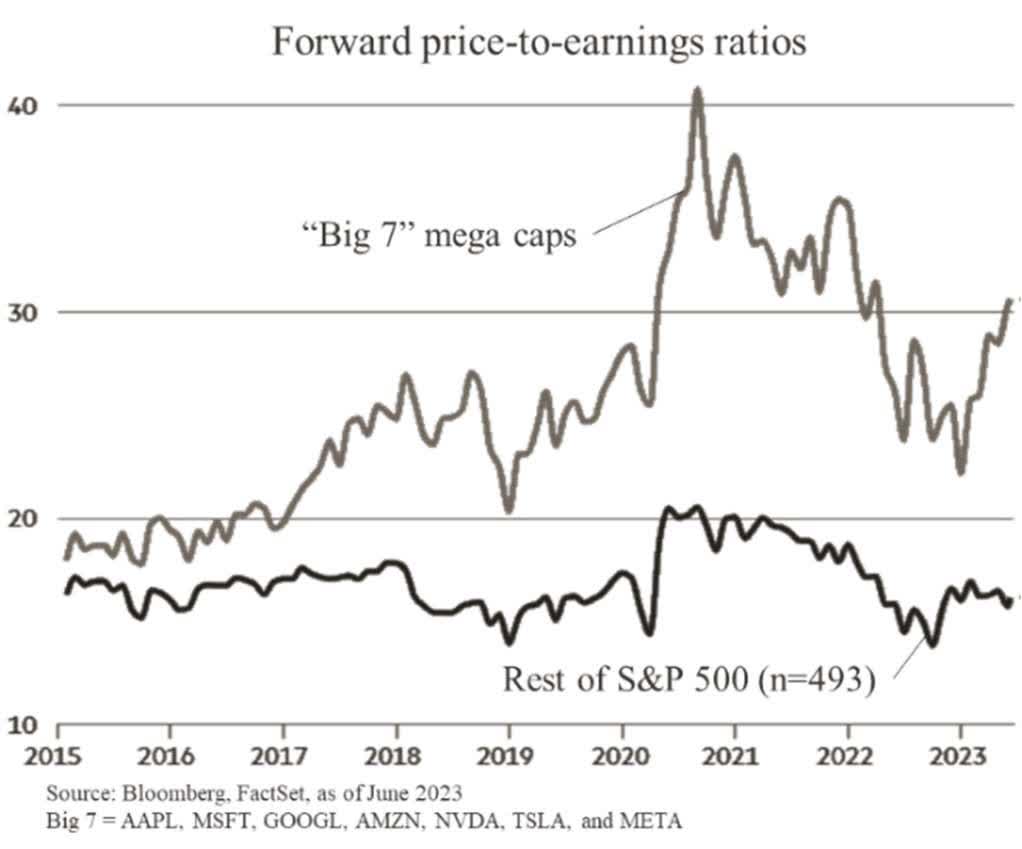
Indeed, due to its market-capitalization weighted methodology, the S&P 500’s largest technology companies (the “Big 7”) drove the vast majority of the S&P 500’s 14.5% year-to-date returns (since the Fund’s January 11, 2023 inception). Over the same period, the equal-weighted S&P 500 and Russell 2000 indices ( RTY ) have returned only 3.3% and 4.4%. To help underline the massive bull run in these “mega cap” tech companies, consider that the tech-heavy NASDAQ index returned its best first half in forty years.
As depicted on the right-hand-side chart, the forward P/E multiple of the Big 7 rapidly expanded to more than 30x in the first half of 2023.
Investors in the Big 7 are correct when they declare that these companies deserve higher valuation multiples than most other companies due to their superior growth prospects and efficient business models. But how much higher?
We are downside-oriented, intrinsic-value based investors and actively investigate discrepancies between value and price. Growth in the next year, or even five years, is extremely challenging to predict with a high degree of confidence. As valuation multiples increase, investors become more “leveraged” to growth as returns are less dependent on cash flow today, and more dependent on future cash flows. Future cash flows are inherently more speculative, and in our opinion, require healthy skepticism and wider confidence intervals.
For these reasons, we have largely invested outside of this technology universe, however as detailed later in this letter, we believe Alphabet ( GOOG , GOOGL, formerly known as Google) is currently offered by markets at an attractive price. Outside of our new investment in Google, we have found most of our other opportunities in asset-rich, mid-capitalization businesses and value-oriented special situations. As a result, the Fund’s composition is very different from the S&P 500 index.
| Portfolio Comparison | Silver Beech | S&P 500 |
|---|---|---|
| Price-to-Book Ratio | ||
| 1.8x | ||
| 4.3x | ||
| Price-to-Earnings Ratio (2023E) | ||
| 12.7x | ||
| 20.5x | ||
| Earnings-Per-Share Growth Forecast (2023E-2024E) | ||
| 15.8% | ||
| 11.8% | ||
| After-Tax Returns-on-Capital | ||
| ~12% | ||
| ~15% | ||
| # Holdings | ||
| 9 | ||
| 500 | ||
| Source: S&P Global, as of 6/30/2023 | ||
The Fund also averaged ~39% exposure to the eventful financials sector in the first half of 2023 versus the S&P 500’s ~16% concentration. We wrote about our financials investments, specifically bank investments, in the first quarter 2023 letter. Silver Beech’s financials investments have substantially outperformed the S&P 500’s financials sector losses of -4% (since Silver Beech’s January 11 inception). We are pleased to have navigated this sector with significant outperformance.
Portfolio Update
For this quarter, we begin with updates on our special situations investments in First Citizens BancShares and Arbor Realty Trust that we have fully exited, followed by longer-form introductions to Silver Beech’s new and larger investments in Asbury Automotive Group and Alphabet Inc. We also provide a brief introduction to our new investment in Playa Hotels & Resorts.
Exited Position – First Citizens BancShares, Inc. ( FCNCA )
We introduced First Citizens BancShares (“First Citizens”) in our first quarter 2023 letter. As noted, we invested in First Citizens after they acquired Silicon Valley Bank. The investment was based on our thesis that the acquisition conservatively accreted over $8 billion to First Citizens’ common equity whereas the market was pricing in substantially less.
Prior to First Citizens’ earnings release, we continued to build conviction in our analysis and sized the position to the largest in the Fund. In its May 10 earnings release, in line with our analysis, First Citizens posted ~$9.1 billion of accretion from its acquisition of Silicon Valley Bank, and the market responded accordingly. We fully exited our position after the earnings release as the market incorporated the full accretion. Our investment in First Citizens generated a ~23% return over a 5-week holding period.
As we discussed in our first quarter 2023 letter, we have tracked First Citizens for several years and believe the bank is led by world-class management. The bank remains on our investment watchlist, and we remain confident the company will continue to create value for shareholders, especially in light of likely future banking sector consolidation that will benefit First Citizens’ opportunistic acquisition strategy and capital strength. We exited our position in First Citizens in favor of more attractive riskadjusted opportunities.
Exited Position – Arbor Realty Trust, Inc. ( ABR )
Arbor Realty Trust is a small-capitalization mortgage REIT that primarily originates bridge multifamily and single-family home loans. Arbor also has in-house asset-light agency loan origination and mortgage servicing right segments that are a good strategic fit for properties that mature out of Arbor’s bridge multifamily loan program. Over the last decade, in part due to Arbor’s unique business combination and capital allocation strength, the company has earned among the highest returns on equity and shareholder returns in the mortgage REIT sector.
On March 14, an unidentified short seller published a report that claimed Arbor had engaged in fraud by hiding toxic assets off-balance sheet, reporting fake revenues, and accused management of looting funds from the company, among several similar claims. The report’s claims were among the most extraordinary we have read in a short report and resulted in a dramatic decline in the company’s share price. Additionally, the report was released three days after Silicon Valley Bank was put into foreclosure by the FDIC. Investor fear and the short report drove selling, compounded by a Wall Street Journal article highlighting a multifamily loan to a distressed Houston project.
Arbor categorically rejected the short report and initiated a repurchase authorization program to take advantage of the attractive share repurchase opportunity. Ivan Kaufman, Arbor’s founder, CEO, and Chairman personally acquired shares at trough levels.
We opportunistically invested in Arbor at a deep discount to replacement cost and intrinsic value after evaluating the short report, studying Arbor’s assets and capital structure, and speaking with borrowers that worked with Arbor in the past. We did not find any material discrepancies in Arbor’s financial reporting nor signs of fraud. We liked the company’s defensive loan structures and history of capital allocation. We exited this value-oriented special situation when the company’s share price normalized shortly after the end of the second quarter with a ~28% return over our 8-week holding period.
Asbury Automotive Group ( ABG )
Asbury Automotive Group is a mid-capitalization company and one of the largest automotive retailers based in the United States. Asbury operates 190 franchises located primarily in southeastern and southwestern metropolitan markets. The retail automotive industry is highly fragmented, however Asbury has generated outstanding ~20% compounded returns for shareholders over the last ten years. We believe the factors that helped the company achieve this success remain in place today and that Asbury’s intrinsic value exceeds its June 30 share price by more than 40%.
Asbury’s success resulted from nearly doubling its franchise footprint in the past 10 years from 98 franchises to 190 franchises (152 dealerships / 38 collision centers). Asbury profitably doubled its footprint by acquiring and integrating franchises at attractive prices. To underline the scale of Asbury’s capital deployment: in 2012 the company had ~$1.4 billion of capital deployed, by 2022 this figure had grown 5x to ~$7.4 billion. Clearly, Asbury saw an attractive opportunity in franchise acquisitions.
Asbury has an operations playbook for its new acquisitions that (i) improve franchise operating efficiency (more inventory turns, floorplan financing, geographical clustering within a market for scales of economy); and (ii) sell higher margin and less cyclical lines of business (parts/services and finance/insurance products). Based on our studies of Asbury’s acquisitions and financial history, we estimate that Asbury’s after-tax incremental returns on capital were ~13%+. Asbury’s historically high debt levels helped turn ~13% incremental returns on capital into greater than 20% incremental returns on equity. Attractive capital deployment, high reinvestment rates, and leverage drove returns.
Asbury’s management team continues to outline a large pipeline of franchise acquisition opportunities that should reward shareholders. Further, we believe Asbury’s go-forward incremental returns on capital might even exceed past returns driven by two capital-light product additions to its operations playbook: (i) expansion of its finance/insurance business line into repair/maintenance contracts through a 2021 acquisition named Total Care Auto (TCA); and (ii) franchise integration with Clicklane, Asbury’s online vehicle retail platform.
Broadly, we believe public markets have undervalued automotive retail companies based on risk factors against which Asbury has thoughtfully prepared itself:
| Disintermediation by online-only retailers |
| Clicklane is a 100% online solution for automotive acquiring, financing, insuring, registration, and home delivery. Clicklane integrates with Asbury’s physical footprint, to provide service that other online-only services cannot. Clicklane and Asbury are focused on profitable unit economics, which have been elusive for online-only competitors. |
| Impact of autonomous vehicles ((AVs)) |
| We believe large-scale autonomous adoption is at least ten years away due to technological, infrastructure, and regulatory factors. In a downside scenario with no place for Asbury in the AV value chain, Asbury’s terminal valuation is controlled by the valuable owned real estate on which the company’s franchises currently operate. |
| Impact of electric vehicles ((EVs)) |
| EVs concern the market because they have fewer moving parts than internal combustion engine vehicles and fewer high-margin parts and services appointments. However, Asbury reports that given the complexity of batteries, price per service is much higher. EVs are their “highest repair order dollars per ticket.” |
| Manufacturers going direct to consumer ((DTC)) |
| DTC risk has existed for decades, but distribution is a large barrier for manufacturers. Auto manufacturing is competitive with low returns on capital that prevent excessive risk taking. Tesla’s struggles with services and repairs despite driver loyalty support this view, and other manufacturers would have faced brand impairment with a DTC model. |
We believe Asbury is an attractive investment for the following reasons:
- Less cyclical cash flows: Asbury employs a razor–blade model, with cars sold as the low margin “razor”, and finance/insurance and parts/services as the higher margin “blade”. The “blade” segments represent only 19% of revenues but 61% of gross profits, are not as cyclical as automotive sales, and are growing share of profit as new service capabilities are integrated.
- Management track record of strong capital allocation: The large opportunity remains to acquire franchises at attractive 13%+ after-tax returns on capital. Asbury has a lower leverage level than management’s target range which provides capacity to deploy capital via franchise acquisitions and share repurchases. Management has opportunistically repurchased 5% of outstanding shares at attractive levels in the last 12-months.
- Attractive valuation: In 2015, Berkshire Hathaway acquired Van Tuyl Group, the largest privately-owned automotive retailer with 100 franchises for $4.1 billion. Van Tuyl competed with Asbury and had a similar playbook. Terms were not disclosed, but we estimate Berkshire paid 78x TEV/EBITDA. By comparison, Asbury trades around 8x TEV/EBITDA on the market’s bearish consensus 2023/2024 EBITDA estimates and a low double-digit free cash flow yield. Asbury has historically traded around 9-10x TEV/EBITDA, which we argue is still low given the company’s track record of capital deployment, operational efficiency, and organic growth initiatives (like Clicklane). We believe Asbury’s intrinsic value is at least 40% greater than its June 30 share price.
Playa Hotels & Resorts ( PLYA )
Playa Hotels & Resorts is a small-capitalization owner/operator of 25 all-inclusive resorts in Mexico (Cancun and Pacific Coast), the Dominican Republic, and Jamaica. Playa’s portfolio is branded (mostly Hilton and Hyatt), includes primarily luxury/upscale resorts, and operates at among the highest margins in the hotel industry. Playa’s resorts are irreplaceable assets in supply-constrained markets that continue to benefit from rising post-COVID international tourism.
We believe the public market discounts Playa’s shares based on recessionary fears, however, strong international flight data into Playa’s regional airport hubs do not support this view, and spot private market valuations for Playa’s hotels exceed its public market valuation. Management has demonstrated impressive capital allocation to address this valuation gap by moderating growth capital expenses for only the highest return projects and looking to sell select strategic resorts and repurchase shares at today’s attractive level. Over the last two quarters, Playa has repurchased more than 4% of the company’s outstanding shares. The company trades at a TEV/EBITDA of 7.6x (2023E), and a low double-digit free cash flow yield. We believe Playa’s intrinsic value is more than 50% greater than its June 30 share price.
Alphabet Inc. ( GOOG , GOOGL )
Alphabet Inc. (“Alphabet” or “Google”) is a high-quality, asset-light global monopoly business in digital advertising. Google has maintained 90%+ market share in its core search franchise for decades; search dominance drives user engagement across the company’s other market-leading franchises including YouTube, Chrome, Gmail, and Google Cloud, among many others. In the global digital advertising market, Google search and YouTube capture ~50% of total spend. Google’s lead in search is so pronounced that three of the top four search terms on Bing, Google’s “closest” search competitor, are “Google”, “YouTube”, and “Gmail”!
We have long admired Google. Silver Beech invested in the company during the second quarter at an attractive valuation as market concern over the company’s AI strategy eclipsed the reality that Google is a high-quality company with years of growth ahead. In short, we believe that Google is a high-quality company with strong returns on capital and growth prospects, trading at a valuation substantially cheaper than peers, and in fact, cheaper than the broader S&P 500. We believe Google’s intrinsic value is more than 30% greater than its June 30 share price.
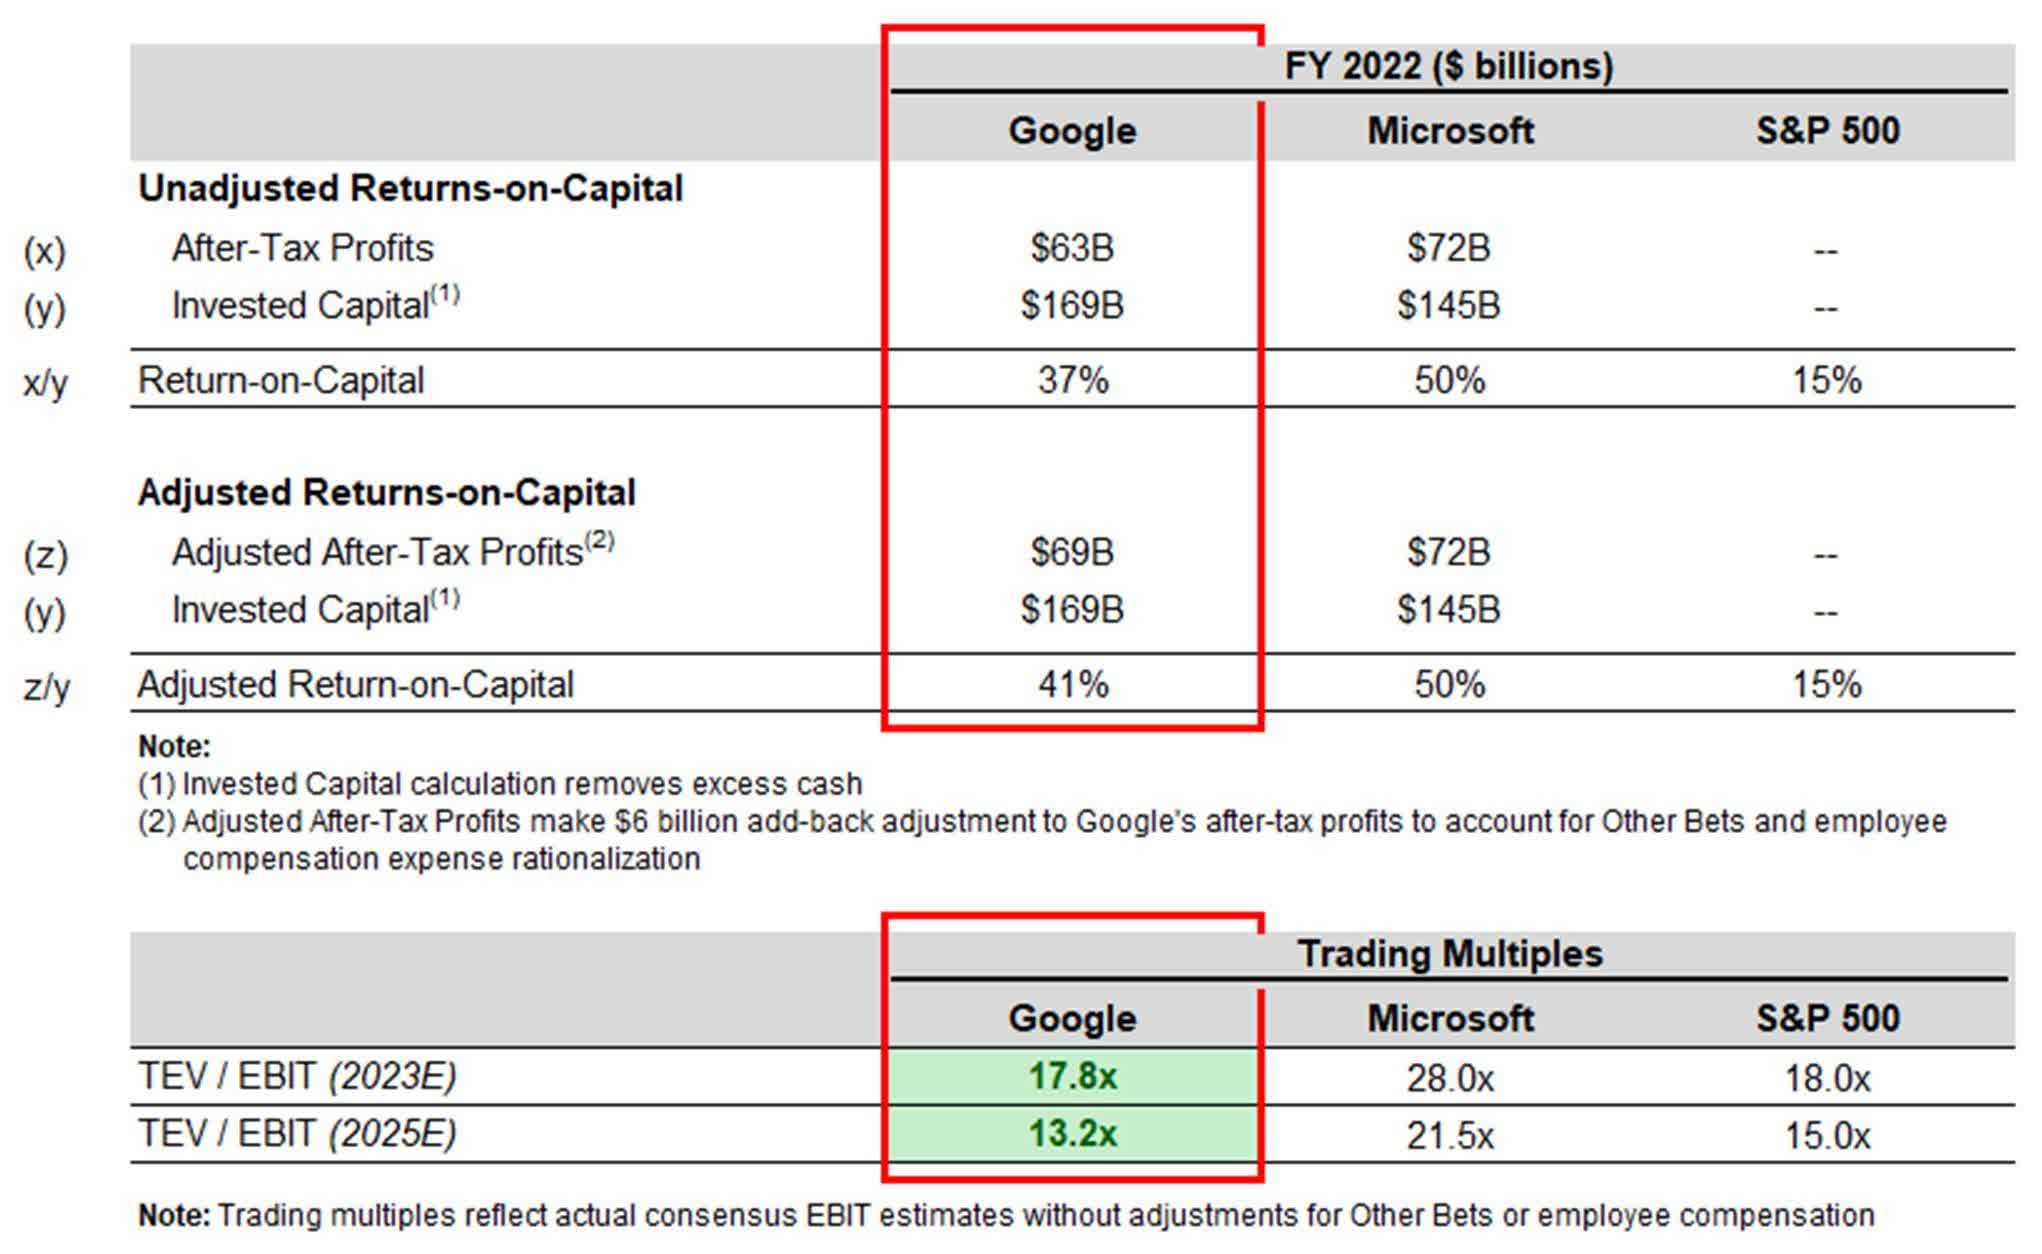
In the tables below, we illustrate Google’s high quality by calculating its after-tax returns on capital (ROC). When evaluating business quality, we think of a business like a capital machine: you put capital in (as capital investment) and get capital out (as cash flow). ROC captures this idea. Generally speaking, the higher a company’s ROC, the higher its quality. We think Google’s true ROC requires a few adjustments because the company funds unprofitable business lines that are secondary to its core franchise and excessive employee compensation that has been widely criticized and even noted by management.
Comparing Google to Microsoft ( MSFT , one of the best capital machines in history) and the broader S&P 500 (comprised of 500 of the largest capital machines in the United States) is striking alongside the valuation multiple comparison below.
As depicted in the above tables, Google’s returns on capital are much higher than the broader S&P 500, yet Google trades at a lower valuation. There are multiple reasons why investors would be willing to pay a higher price for Microsoft than Google–and we do not assert that Microsoft and Google should trade at similar multiples even if their returns on capital are similar–but we strongly believe that Google deserves a higher multiple than the S&P 500.
Our investment thesis is based on Google’s existing dominant market position(s) and the discrepancy between the company’s intrinsic value and share price. We do not believe our Google investment is predicated on the company “winning” AI; however, we note that Google is a formidable AI competitor due to some key advantages:
- Ability to distribute AI services across existing search, video, and productivity tools and users.
- Rich dataset of search queries and consumer preferences data that can be used to train AI models.
- Access to capital to fund research and development. Well-endowed technology companies are best positioned to fund AI innovation and reap its benefits due to the huge amounts of capital expense required to train AI’s models.
- Deep history in AI innovation. In 2014, Google acquired DeepMind, whose technology is now at the forefront of AI research. In 2015, the company released TensorFlow, a powerful open-source machine learning framework that has become industry standard. Other notable AI developments include Google Brain, a deep learning program that has greatly contributed to the medical field, and Google Assistant, an AI-powered virtual assistant that incorporates natural language processing, and Bard, its generative AI chatbot, which, like OpenAI’s ChatGPT, is built on large language models.
We think our investment in Google represents an opportunity to own a high-quality business at an attractive price.
Conclusion
We welcome new Investors that have committed to joining the investment partnership and thank you for the trust that you have placed in us. We also greatly appreciate your referrals and capital introductions. We look forward to providing you with the next update in the third quarter of 2023, and please do not hesitate to contact us in the meantime.
Sincerely,
James Hollier, Partner & Portfolio Manager | James Kovacs, Partner
Silver Beech Capital, LP
Silver Beech Capital, LP – Fund Summary as of June 30 th , 2023
| Holdings: | |||
|---|---|---|---|
| Name | Ticker | Sector | Description |
| Alphabet | |||
| [[GOOGL ]] | |||
| Internet Content & Information | |||
| Leading global tech company with significant market share in digital advertising and cloud. Products include Google search, Google Cloud, Chrome, Bard, and Gmail. | |||
| Ally Financial | |||
| [[ALLY]] | |||
| Credit Services | |||
| Digital financial services company that provides banking, auto finance and insurance services, credit cards, and advisory services to consumers. | |||
| Arbor Realty Trust | |||
| [[ABR]] | |||
| Mortgage REIT | |||
| Commercial real estate structured finance company, primarily bridge multifamily & single-family home loans. Also has agency origination & mortgage service business. | |||
| Asbury Automotive Group | |||
| [[ABG]] | |||
| Auto & Truck Dealerships | |||
| Large U.S. automotive retailer that sells new/used cars and products/services across the vehicle ownership lifecycle (repairs, maintenance, finance, and insurance). | |||
| Citigroup | |||
| [[C]] | |||
| Banks (Diversified) | |||
| Global diversified financial services company that primarily provides consumers and institutions with banking, advisory, trading, and treasury services. | |||
| Dentalcorp | |||
| [[DNTL]] | |||
| Medical Care Facilities | |||
| Largest and fastest growing owner, acquiror, and partner of Canadian dental practices with over 500 practices. | |||
| Playa Hotels & Resorts | |||
| [[PLYA]] | |||
| Resorts & Casinos | |||
| Owner and operator of all-inclusive branded resorts in Mexico (Cancun and Pacific Coast), the Dominican Republic, and Jamaica. Primarily luxury/upscale resorts. | |||
| U-Haul | |||
| [[UHAL]] | |||
| Rental & Leasing Services | |||
| Largest DIY moving and storage company in North America. Specialized rental products include trucks, trailers, self-storage real estate, and portable storage. | |||
| Winnebago | |||
| [[WGO]] | |||
| Recreational Vehicles | |||
| North American manufacturer of RVs and marine powerboats under the Winnebago, Grand Design, ChrisCraft, Newmar, and Barletta brands. |
| Fund Composition By Market Capitalization: | |
|---|---|
| Weight | |
| Large Cap (greater than $10 billion) | |
| 25.9% | |
| Mid Cap (greater than $2 billion) | |
| 55.0% | |
| Small Cap (less than $2 billion) | |
| 19.1% | |
| Total | |
| 100.0% |
| Monthly Net Returns | ||||||||||||||
|---|---|---|---|---|---|---|---|---|---|---|---|---|---|---|
| Jan | Feb | Mar | Apr | May | Jun | Jul | Aug | Sept | Oct | Nov | Dec | Year | S&P 500 TR | |
| 2021 | ||||||||||||||
| 6.8% | ||||||||||||||
| 6.9% | ||||||||||||||
| 4.2% | ||||||||||||||
| 5.3% | ||||||||||||||
| 1.3% | ||||||||||||||
| (1.7%) | ||||||||||||||
| (0.1%) | ||||||||||||||
| 1.3% | ||||||||||||||
| 3.1% | ||||||||||||||
| 4.9% | ||||||||||||||
| (2.3%) | ||||||||||||||
| 5.9% | ||||||||||||||
| 32.6% | ||||||||||||||
| 28.7% | ||||||||||||||
| 2022 | ||||||||||||||
| 2.1% | ||||||||||||||
| 2.8% | ||||||||||||||
| 6.9% | ||||||||||||||
| (2.5%) | ||||||||||||||
| 8.0% | ||||||||||||||
| (15.2%) | ||||||||||||||
| 16.2% | ||||||||||||||
| (0.1%) | ||||||||||||||
| (11.3%) | ||||||||||||||
| 2.0% | ||||||||||||||
| 5.4% | ||||||||||||||
| (3.6%) | ||||||||||||||
| 6.9% | ||||||||||||||
| (18.1%) | ||||||||||||||
| 2023 | ||||||||||||||
| 7.7% | ||||||||||||||
| (1.6%) | ||||||||||||||
| (3.0%) | ||||||||||||||
| 2.3% | ||||||||||||||
| 1.7% | ||||||||||||||
| 6.7% | ||||||||||||||
| -- | ||||||||||||||
| -- | ||||||||||||||
| -- | ||||||||||||||
| -- | ||||||||||||||
| -- | ||||||||||||||
| -- | ||||||||||||||
| 14.1% | ||||||||||||||
| 14.5% |
| Returns presented above for Silver Beech are net of 1% management fee and 20% incentive fee above a 6% hard hurdle since inception (January 11, 2023). Each Limited Partner’s actual performance will vary depending on the timing of their contribution((s)) and fees. Returns for the S&P 500 include dividend reinvestment. Please see additional disclosure. |
IMPORTANT DISCLOSURESSilver Beech Capital Management, LLC (“Silver Beech”) is a New York limited liability company that serves as the investment manager to Silver Beech Capital, LP (the “Fund”), a Delaware limited partnership. The principals of Silver Beech are James Hollier, who serves as the portfolio manager and managing partner of the Fund, and James Kovacs, who serves as the managing partner of the Fund. All performance results presented herein refers to the performance of an unrestricted investor in the Fund since its inception. Net performance is presented net of the highest performance allocation in effect at the time (20%) above a 6% hurdle rate, the highest actual management fees (1.0%) charged at the time, and net of other expenses, and includes the reinvestment of all dividends, interest, and capital gains. Performance for investors who subscribed on different dates, or who pay different fees would necessarily be different from the performance presented herein. The rate of return is calculated on a “time weighted” rate of return basis, which minimizes the effect of cash flows on the investment performance of the Fund. All monthly performance data presented herein reflects unaudited data, unless otherwise specified, and as such its accuracy cannot be guaranteed. Past performance is not necessarily indicative of future results. All securities transactions involve substantial risk of loss. The material presented is compiled from sources thought to be reliable, including in certain instances, from outside sources, but accuracy and completeness cannot be guaranteed. Any opinions expressed herein reflect the judgment of Silver Beech and are subject to change. The information in this letter is for discussion purposes only. Nothing contained herein should be construed as an offer to sell, or a solicitation of an offer to buy or sell any security or investment strategy or a recommendation as to the advisability of investing in, purchasing or selling any security or investment strategy, which may only be made in the Fund’s confidential offering memorandum and operative documents (collectively, the “Offering Documents”). Before making an investment decision with respect to the Fund, prospective investors are advised to read the Offering Documents carefully, which contain important information, including a description of the Fund’s risks, investment program, fees, expenses, redemption and withdrawal limitations, standard of care and exculpation, etc. Prospective investors should also consult with their tax and financial advisors as well as legal counsel. The Offering Documents are the sole documents on which a potential investor is entitled to rely in evaluating an investment in the Fund. The information in this letter does not take into account the particular investment objectives, restrictions, or financial, legal or tax situation of any specific prospective investor, and an investment in the Fund may not be suitable for many prospective investors. This letter is not intended to be, nor should it be construed or used as, investment, tax or legal advice. PAST PERFORMANCE IS NOT NECESSARILY INDICATIVE OF FUTURE RESULTS. |
Original Post | Tear Sheet
Editor's Note: The summary bullets for this article were chosen by Seeking Alpha editors.
For further details see:
Silver Beech Capital Q2 2023 Investor Letter