GTX - Silver Ring Value Partners Q1 2023 Letter
2023-05-10 13:49:00 ET
Summary
- Silver Ring Value Partners provides investment advisory services. The Company offers portfolio management, financial planning, and trading services. Silver Ring Value Partners serves investors in the State of Massachusetts.
- It continues to be a challenging environment for me to find compelling new investments that combine both business quality and a margin of safety in the form of a large gap between price and intrinsic value.
- I encourage you to consider the results summarized in conjunction with both the investment thesis tracker as well as the discussion of the individual companies in this letter.
Dear Partners:
I hope that you are doing well. It continues to be a challenging environment for me to find compelling new investments that combine both business quality and a margin of safety in the form of a large gap between price and intrinsic value. This isn’t a top-down statement about the market. It’s the result of examining many potential candidates, casting a wide net, and still not being able to find anything attractive enough to add to our portfolio.
In the last letter I wrote to you that I found a small group of promising candidates. While I am still doing research on some of them, none have proved as attractive as I initially hoped. I would be much happier writing to you that I found plenty of new ideas to invest in. I am as eager as any of you to deploy our capital on attractive terms. However, what I am not going to do is to force the action and compromise on either quality or price. Doing so would be a good way to lose our money.
Warren Buffett in his 2022 annual letter to Berkshire Hathaway shareholders wrote that over Berkshire’s 60 years, about a dozen investments accounted for almost all of the excess returns. The rest of his investments did not contribute much to Berkshire’s returns as a group. That’s one investment every 5 years .
Please rest assured that I am not somehow unusually risk-averse and unable to commit capital when the opportunities are there. I have done so plenty of times in my 20+ year investment career. I have also learned to trust my judgement and not to lower my standards when I can’t find anything that clears the hurdle. Instead, I use it to motivate myself to look harder, but not to act faster .
The good news is that the math of waiting, which I lay out later in this letter, is quite forgiving of patience. That math is not at all forgiving of large permanent capital losses.
We had one new partner join us in Q1. The partnership is open to long-term investors who want to safely compound their capital at attractive rates, and who use process rather than outcome to measure short-term progress.
Investment Activity
I made the following change to the portfolio during Q1 2023:
• Exited the Apple ( AAPL ) put options position, as I came to the conclusion that I was wrong about the degree to which the stock is overvalued. While I still believe it’s optimistically priced, the fundamentals over the last few years made me believe that my initial decision to buy the put options was wrong
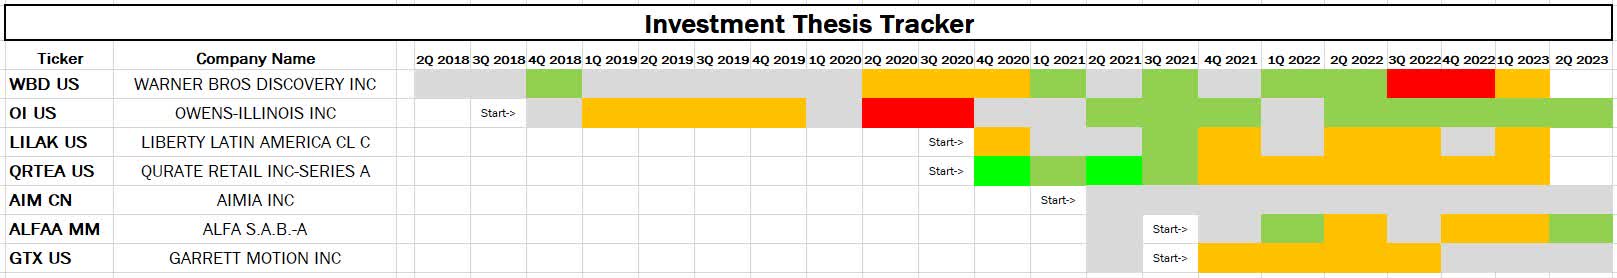
- Light Gray: thesis is tracking roughly in-line with my base case
- Orange: thesis is tracking somewhat below my base case
- Red: thesis is tracking significantly below my base case
- Dull Green: thesis is tracking somewhat better than my base case
- Bright Green: thesis is tracking significantly better than my base case
- White: No data
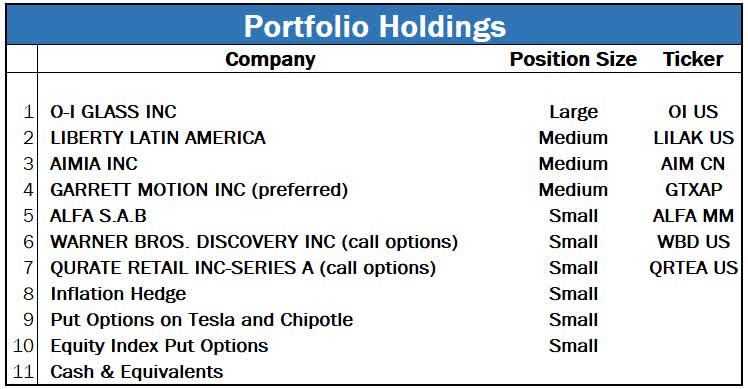
- The portfolio was priced at 74% of Base Case value and at 64% excluding cash at the end of Q1
- Option-adjusted net exposure was at 14%, reflecting option-based hedges
- Excluding the inflation hedges, option-adjusted net exposure would have been 29%
- Cash and equivalents were 28% at the end of the quarter, and weren’t a reflection of market timing, but rather a temporary residual of the bottom-up investment process
Operations Update
- K-1s were once again available in mid-March and posted on SS&C’s portal. If you need any help accessing them please reach out to me and I would be happy to help.
- The partnership’s audit has been completed and the audited financial statements should be available on SS&C’s portal.
Portfolio Update
The Math of Waiting to Invest
The “Too Long, Didn’t Read” version is this: if you wait to invest, your likely range of outcomes is between slightly below-average and very good. If you force yourself to invest and end up making a typical sized mistake, you could lose a good portion of your capital. Let me show you the math.
Currently, the ~1,000 quality companies that I described as my hunting ground in the last letter are trading at an average normalized forward Free Cash Flow ((FCF)) yield of 4% to 4.5%. I give a range because without doing the work on all individual companies it’s hard to know exactly how much to penalize the FCF over the last 5 to 10 years for a lack of a real economic recession. If we assume that this universe grows FCF at about 5%, a typical historical growth rate, this would imply about a ~9% Internal Rate of Return ((IRR)) from buying this group of companies.
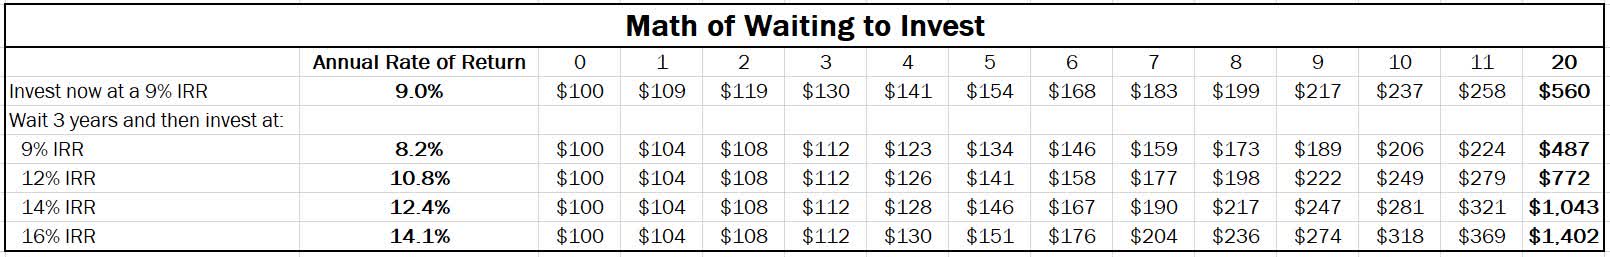
So, let’s compare the following scenarios:
- We invest right away at a 9% IRR
- We wait for 3 years while we search for ideas, invest in Treasury Bills at a 4% annual return, and then deploy our capital in an investment that has either 9%, 12%, 14% or 16% IRR
- The 9% scenario represents the case in which we search in vain for 3 years and then invest in securities with similar expected returns to what’s available today. The other three scenarios are realistic IRRs for the typical investments that I look for and believe are very reasonable to be able to find, with hard work, within the 3 year timeframe
As you can see, with these assumptions, at worst we do slightly worse than we could have done by investing right away, but have a very decent chance of doing much better despite waiting a whole 3 years. In practice, I don’t think the whole 3 years is likely to be needed, as good ideas historically have come more frequently than that, but I wanted to use that waiting period to illustrate the point.
Let’s say however, that we think ourselves to be Mr. Stock Pickens McPickens. McPickens doesn’t need to settle for mere group-average returns of 9%. He is one insightful hombre, and he is going to find that winning stock even in a tough market. That’s what he is paid to do, darn it!
Maybe. Or maybe McPickens makes a mistake. In his desire to find high returns and look smarter than his peers, he gets too clever for his own good.
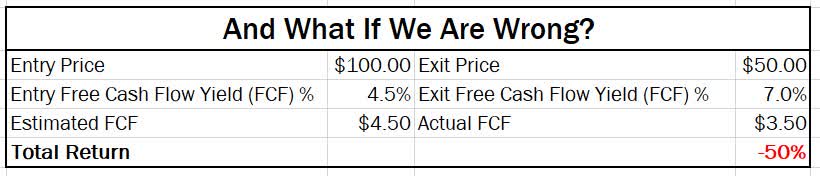
Let’s say he buys a quality company at the average FCF yield of 4.5% that is available today. McPickens has a very fancy argument, supported by reams of data and lots of field research that makes him believe this is a high-growth business. A compounder, perhaps the next Costco or Amazon!
Except that such companies are exceedingly rare. So, let’s say that this time the market got the better of McPickens, and he was actually a bit too optimistic on the starting FCF of the business. Perhaps he didn’t fully appreciate the cyclical boost to current profits. Also let’s assume that while the business he picked is still quite good, it ended up being mature and couldn’t generate much more than low single-digit future growth. That is the growth of a typical mature business, after all.
So what would McPickens’ visionary bravery do to the capital he invested if he were wrong?
He would lose 50% of his money.
By the way, while McPickens is not a real person, he is inspired by my voracious reading of many investors’ letters and investment theses. And perhaps by some of my own McPickens-like mistakes of the past. In investing, experience needs to build both confidence and humility. The former without the latter is just unwarranted hubris.
Company Updates
O-I Glass ( OI )
The company has been consistently exceeding expectations. Most recently, management raised EPS guidance for 2023 to a range of $3 to $3.50, up from previous guidance of $2.50+. What are some possible concerns by the market that account for a price which still values the company at 7x the low end of expected earnings for this year?
- This year’s profits represent a cyclical peak. It is likely that the company is currently earning somewhat above normalized levels, however this is a business with modest cyclicality. For context, organic sales declined about 6% in 2009 and 3% in 2020. My estimate of normalized, mid-cycle EPS is $2.75, placing the stock at less than 9x normalized EPS and Free Cash Flow.
- The company is in a secular decline. While aluminum cans have taken share on a secular basis from glass, primarily in mass-market beer, that trend is a) slow b) has a low likely magnitude of impact going forward given the remaining exposure to the vulnerable segment is a small % of the current business mix. Despite the secular challenges, OI has averaged organic sales growth of 2% over the last decade.
- Capital expenditures are elevated. Management is investing in its new MAGMA technology for smaller, more energy-efficient glass furnaces. It estimates IRRs of close to 20% and has multiyear customer commitments in hand for much of the capacity expansion. The technology has met its milestones thus far, but as with any such endeavor there is always a risk that something goes wrong at a later stage. I estimate that the worst case with respect to this risk is that we lose a year or two of Free Cash Flow and have a business with a low-single digit growth trajectory after that.
- Historical balance sheet and cash flow statements aren’t representative of the current situation and the market still hasn’t caught up. Someone who doesn’t know the business and just looks at historical cash flow will see a very unrepresentative picture. Historically the company had large asbestos-related payments which depressed its Free Cash Flow substantially. Last year the company resolved this issue by bankrupting the relevant subsidiary and settling with the plaintiffs. It has zero asbestos liability remaining and no future payments required. Furthermore, the balance sheet is now at less than 3.5x Debt/EBITDA, which is well below what a business with such low cyclicality is capable of maintaining.
Given the above, I expect one of the following scenarios to play out over the next few years:
- The stock market recognizes the value of the business and the stock re-rates up.
- Fundamentals play out as expected, the market doesn’t recognize the value and the company is taken private by a Private Equity buyer.
- Fundamentals play out as expected, the stock market doesn’t recognize the value of the company, and management begins returning meaningful Free Cash Flow to shareholders. This should begin in 2025 once the period of elevated capital expenditures investment is over.
- I am wrong on the fundamentals either with respect to normalized EPS or to the growth trajectory.
Garrett Motion ( GTXAP )
As a reminder, the convertible preferred stock that we own was a security that came about as a result of the bankruptcy process. Unlike most preferred stocks, which are issued to benefit the seller, and which are usually structurally unattractive securities, this security was structured under duress to benefit the buyers. As a result, it has the best of both worlds – strong downside protection and full upside participation with the equity.
Alas, all good things eventually come to an end. The preferred stock was never meant to be a permanent security, but rather a bridge to better days for the company, when the intent was always to convert it to common equity. With the company on the threshold of hitting the profitability metrics at which the preferred would have converted to equity, the board struck a deal with the major holders of the preferred to proceed with the conversion.
We will receive our accrued dividends, some in cash and some in the form of additional shares, and one share of common equity for each share of the preferred. I view this as a negative development for us, since the downside protection of the preferred would come in handy in case of a severe recession, which is a possibility at this point. Now owners of the convert will not have the extra protection as the economy enters a likely recession. Given the above, I intend to re-think the position sizing once the conversion occurs to make sure it’s consistent with the new risk/reward.
Aimia (AIM CN)
Aimia is a holding company managed by value investors which is undergoing an asset conversion. Having sold its minority stake in the Aero Mexico miles loyalty program last year, the plan was to deploy the proceeds into good operating businesses at an attractive price. This would also allow the company to utilize its substantial NOLs.
This year the company announced that it has agreed to buy two businesses. Tuffropes is an Indian family-owned company which manufactures specialty ropes and netting for the marine industry. Bozzetto is a European specialty chemicals business. In both cases, management partnered with the same private equity firm which sourced the ideas and which will receive a percentage of the profits above an 8% growth rate in profits.
Many investors seem to be unhappy with these transactions. Reasons cited include the heightened risk of acquiring foreign companies, having to give up a portion of the economics to the private equity firm, the fact that multiples of profits paid for the acquired businesses weren’t particularly low, insufficient disclosure about the historical economics of the acquired companies, general frustration that the stock hasn’t done well and that management didn’t just return its ample capital to the shareholders.
It’s easy to start letting emotions drive the narrative when the stock hasn’t been performing as investors had hoped. I would wager that if the stock were trading at 2x its current levels, which is closer to my estimate of its intrinsic value, there would be far fewer complaints. However, I do share some of the concerns and wanted to share my view on the company’s transformation and where it leaves the shares as an investment at current prices.
I agree that the historical financial performance disclosure of the acquired businesses is insufficient, and I have shared my concerns with the management. I am also not thrilled to be sharing future business economics with a PE firm. However, in both cases the company was able to avoid an auction, so perhaps the PE firm did add some value. The ultimate measurement of success will be based on the returns the company will earn on its capital employed in these two transactions, not based on how they were found or structured.
My estimate is that the two businesses being acquired together will generate normalized operating income that will slightly exceed the sum of corporate costs, preferred dividends and the interest expense on the non-recourse subsidiary-level debt that the company intends to obtain shortly after the transactions close.
Assuming everything goes according to plan, this should leave the company with the following:
- Cash of approximately CAD 2.25 per share
- Other investments valued at about CAD 3.50 per share at cost
- A portfolio of two profitable and moderately growing businesses and substantial Net Operating Losses to offset future tax payments for many years
- This compares to the recent stock market price of the equity at about CAD 3.30
What can go wrong?
- Management might not be able to execute the refinancing on acceptable terms, leaving it with less leverage and less or no excess cash. This is unlikely to be a permanent issue but if the credit markets turn sour, or perhaps if they already have turned sour, then it might take anywhere from quarters to years to get the refinancing done.
- India is not the easiest place for Western companies to operate. From my limited experience, things don’t always work as acquirers expect. To make things worse, Tuffropes was owned by a family that is completely exiting in this transaction. The good news is that Aimia management is hiring locals to run the business. The bad news is that the price paid, by my estimates ~ 13x operating income and 18x after-tax net income on a recapitalized basis, assumes that things will go well.
- Bozzetto, the European specialty chemicals business, is cyclical. There is a chance that the sellers sold Aimia on a level of profit that’s cyclically too high. The good news is that Bozzetto management is staying on and is rolling over a meaningful portion of its proceeds into the equity of the subsidiary.
In thinking about the worst case scenario for my intrinsic value estimate, I made the following assumptions:
- Assumed that both acquisitions produce much lower profits than management expects, and that both are sold for much lower multiples of that reduced profit than what management paid
- Assumed that the holding company is run for 5 years at a loss and then liquidated
- Assumed a 20% to 50% discount from historical cost for the other investments
- No value ascribed to NOLs
The result is my Worst Case value estimate in the low CAD 3s, not far from where the current stock price is trading. I am not oblivious to the risk that things might not go the way that management expects. However, given my analysis that there is limited long-term downside to my worst case value and that the stock is trading at less than half of my base case value, I am maintaining our medium-sized position.
Performance Discussion and Analysis
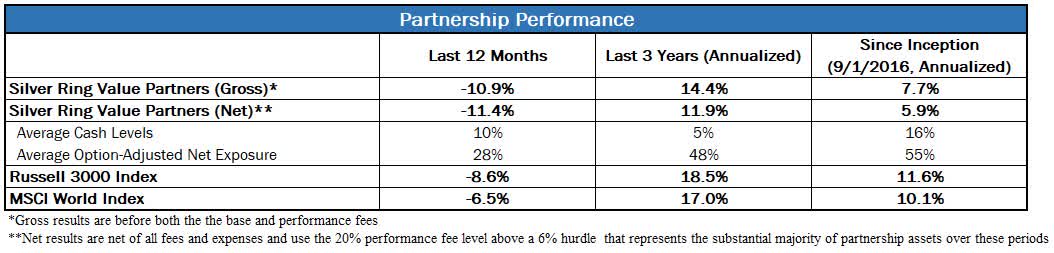
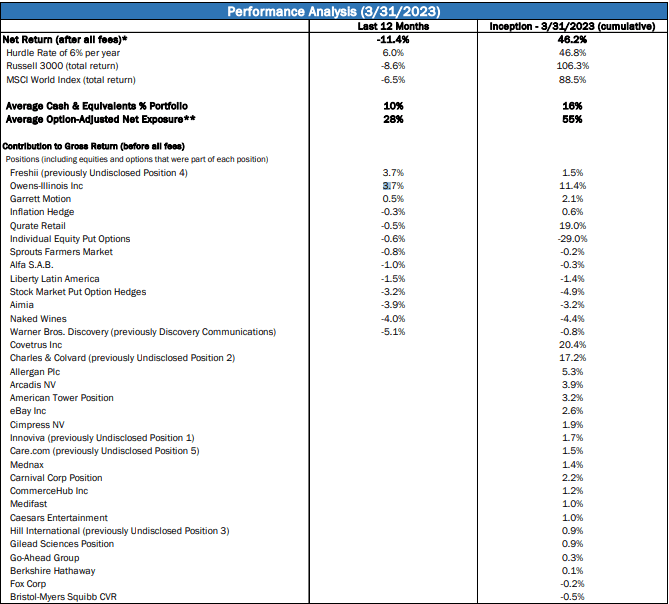
I encourage you to consider the results summarized below in conjunction with both the investment thesis tracker as well as the discussion of the individual companies in this letter. Any investment approach that is judged over less than a full economic and market cycle is liable to appear better than and worse than it really deserves at different points. Ultimately, it is the quality of the investment process and the discipline with which it is implemented that determines the long-term outcome. Therefore, I strongly encourage you to focus on process over outcome in the short term.
* Performance fee is presented based on the 20% rate, which reflected the majority of the assets during these time periods
** Option-Adjusted Net Exposure adjusts for the use of options by replacing their weight with the delta-adjusted notional value for each option. While imperfect, it takes into account both the use of put option hedges and the presence of call options
Disclaimers: Please see the “Disclaimers” section at the end of this letter
Your Questions
As I have committed to do in the Owner’s Manual, I will use these letters to provide answers to questions that I receive when I believe the answers to be of interest to all of the partners. This quarter I received one question that I wanted to answer for everyone’s benefit. Please keep the questions coming; I will do my best to address them fully.
I really enjoy the articles that you publish, but doesn’t writing them take time away from you doing research on stocks?
This came to me from a business acquaintance who is not involved with the partnership, but I thought it relevant to address it here nonetheless. First, my writing doesn’t come at the expense of research as I prioritize investing over other activities. So why do I write?
There are three reasons:
- I enjoy it and learn from it
- I hope that some of my writing helps others, especially those whom I can’t help more directly due to the constraints of the partnership structure
- It’s a positive form of marketing
The first two are self-explanatory, so let me dive in to the third reason, marketing. I used to think of marketing as a dirty word. Something to be ashamed of. It took me a while, but I finally understood why I felt that way, and also why it’s the wrong mindset.
For much of the investment management industry marketing is quite a dirty part of the business. Why? Let’s examine how the industry typically does marketing. The thing I want you to pay attention to is how in these cases it’s done with an almost adversarial mentality of the customer as someone to profit from rather than to help.
Industry Marketing Strategy #1: The field of a hundred funds blooming.
This one works as follows: a mutual fund complex launches 100 funds. Five have standout 1 to 3 year results, so the marketing apparatus sells the heck out of those to unsuspecting customers. When the inevitable reversion to the mean (mean being equal to market returns less fees) occurs, they find another five funds to market in the same fashion.
The hope is to always keep bringing in new customers, and to try to minimize the churn among the disappointed ones by keeping them within the mutual fund complex and selling them the new “fund of the year.” Hopefully you can see how this ends: customers make a return that’s equal to roughly market minus fees, and the mutual fund complex skims its 0.5% to 1% off the top for no value added. Where are the customer’s yachts, indeed.
Industry Marketing Strategy #2: Shooting star
A hot-shot hedge fund manager launches a modest-sized fund. He sits relatively quietly until he hits a stretch of 2-3 years of great returns. Perhaps he even invests in a way to take large risks to achieve the possibility of big gains that he can market. Perhaps not and he is simply waiting for positive randomness, it doesn’t matter.
Having hit the lucky streak, he goes on a marketing rampage. Of course, he supplements the amazing recent results with a narrative. Nothing sells like a story about the “special sauce” that he uses to produce these amazing results. The performance-chasing customers pile in, just in time for the reversion to the mean. The result is that on an asset-weighted basis his customers have a result ranging from terrible to mediocre, whereas the manager makes a killing for himself. Ouch.
Industry Marketing Strategy #3: Don’t think for yourself
This is done by marketing ninjas skilled in the black arts of behavioral persuasion. It usually involves some combination of the following:
Social Proof – “Did you know that [big name XYZ] invested with us?”
Scarcity – “This is only available for the next 2 months, closing the fund soon, we are so successful.”
Group Affinity – “Trust us, we are part of the same group.”
Reciprocity – “We like you, now like us back.”
Switch The Question – “Don’t answer whether you think we will do well with your investments, answer a different question, such as do you like us, are we well dressed and look the part, etc?”
The point of all of this is for you to stop using the rational part of your brain and to switch to the “reptilian” brain which uses short-cuts that favor the persuader to get the prospects to make quick decisions.
What do all of these methods have in common? The customer is the “mark” that exists primarily to provide wealth to the investment manager. They can’t be too smart or thorough in their decision making process, as these tactics work best on those chasing trailing performance and the easily persuadable who make impulsive decisions. Sadly, there seems to be no shortage of customers who fit these characteristics and fall for these tactics.
Trailing Performance
Almost a quarter century ago I took the Investments class at the Sloan School of Management at MIT with Ken French, of the Eugene Fama and Ken French academic fame. In it, Professor French asked us how long did we think it would take for a typical mutual fund to generate a record of beating the market that we can have 90% confidence in being skill as opposed to luck. The guesses ranged from 3 to 7 years. He then derived the answer on the board – it was about 12 years.
The industry focuses on 3-year, and maybe occasionally on 5-year results. So do the famous Morningstar “stars.” These lengths of time have almost no statistical significance. That’s why studies have shown that Morningstar “stars” have little to no predictive power in selecting fund managers who will outperform the market in the future.
Why does the industry act this way? Two simple reasons: it’s very profitable and they don’t have many impressive 12+ year performance records. So, the next time someone talks to you about their 1, 3 or 5-year results as a primary reason to invest, replace the words they are using with the phrase “we think that you are gullible and are an easy mark to make some money off of.” Then act accordingly.
Positive Marketing
Let’s come back to what I am trying to accomplish with respect to marketing by writing:
- Sell process, not short-term outcome. Long-term investment outcomes are a function of investment process, the efforts of the person implementing the process and time. I want those who want to partner with me for the right reasons -- because they like how I make decisions over time (not because they over-extrapolate some period of recent performance and draw unwarranted conclusions from it).
- Market counter-cyclically. When the partnership had a 5-year period of very attractive returns I intentionally stressed that the levels were unsustainably high in order to discourage investments based on unrealistic expectations. Conversely, when recent returns were sub-par but the opportunity set was attractive, I encouraged new investments.
- Educate to help you make better decisions rather than self-promote. I am very transparent about how I make decisions and try to write honestly about mistakes. The goal is to present a realistic picture rather than some façade designed to impress on a false basis.
- Self-select the right partners in and keep the majority of potential clients who don’t fit out. The majority of those seeking to invest in funds are short-term performance chasers. I want to have as little as possible to do with them since I would not be a fit for them but they would waste a lot of my time. By stressing process I save myself a tremendous amount of time that I otherwise would be wasting doing “intro calls” with those who will never become partners. By the time potential partners contact me, they have a good idea of what to expect and whether they like it or not. This saves both of us time, and results in me spending very little time on marketing.
- Encourage constructive behavior among current and prospective partners. You are always welcome to ask any question that you want. However, I am proud of the group that we have assembled in that they choose to not engage in meaningless dissection of short-term results. You would be surprised how many of the investment managers that I know have to field questions that in private they believe to be asinine but in public have to grin and bear it and pretend are legitimate. I have no doubt that it negatively affects their investment mindset, and if I were in their shoes it would affect mine as well.
What I described does not scale. It would not work at a large investment firm – that’s why I left that world. It’s not the path to the highest personal net worth – that’s not my goal. Instead, I am fortunate to be able to practice my craft with a group of likeminded partners that I enjoy interacting with and who make my job easier.
We are a small tribe of people who think about investing rationally through the lens of measuring process over the long-term rather than results over the short-term. I hope to slowly grow our tribe over time, but never at the risk of allowing the wrong people inside. It’s just not worth it.
Portfolio Metrics
I track a number of metrics for the portfolio to help me better understand it and manage risk. I track these both at a given point in time, and as a time series to analyze how the portfolio has changed over time to make sure that it is invested in the way that I intend for it to be. Below I share a number of these metrics, what each means, and what it can tell us about the portfolio. As time passes, you should be able to refer to these charts and graphs to help you gain deeper insight into how I am applying my process.
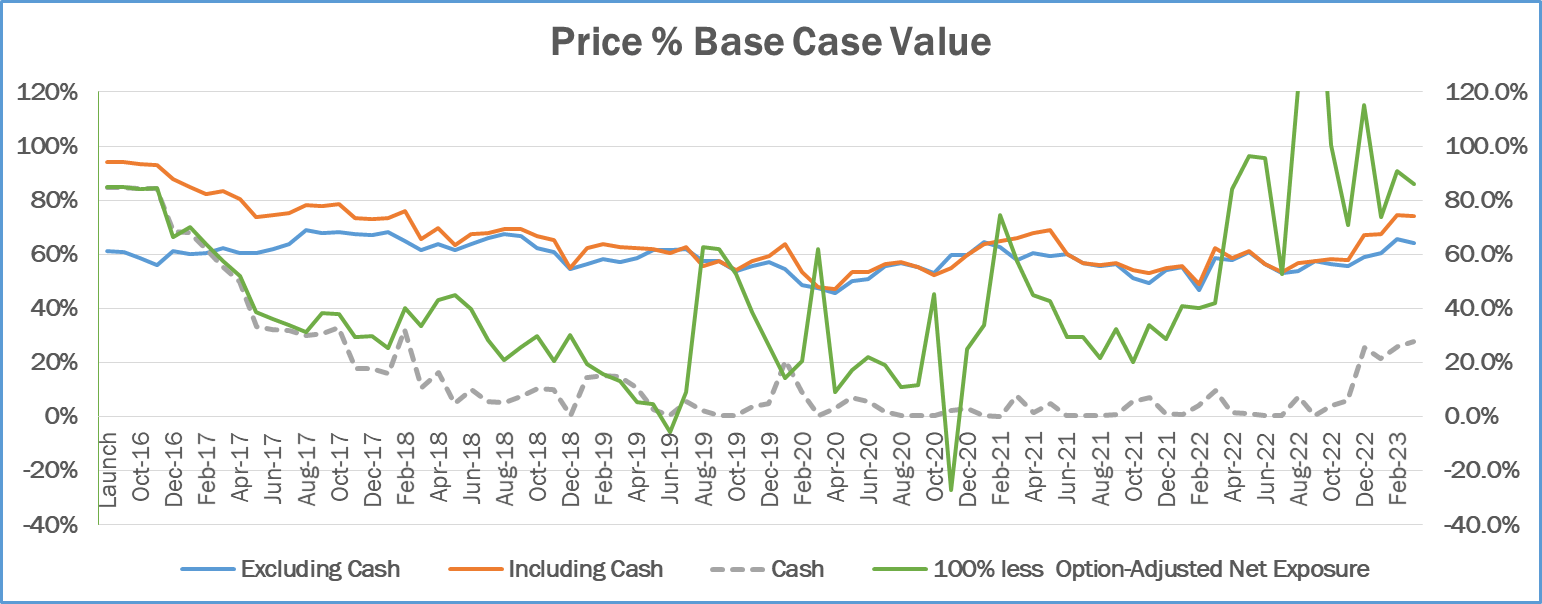
Price % Base Case Value
This metric tracks the portfolio’s weighted average ratio between market price and my Base Case intrinsic value estimate of each security. This ratio is presented both including cash and equivalents, which are valued at a Price to Value of 100%, and excluding those. All else being equal, the lower these numbers are, the better. Excluding cash and equivalents, a level above 100% would be a red flag, indicating that the portfolio is trading above my estimate of intrinsic value. Levels between 90% and 100% I would characterize as a yellow flag, suggesting that the portfolio is very close to my estimate of value. Levels between 75% and 90% are lukewarm, while levels below 75% are attractive.
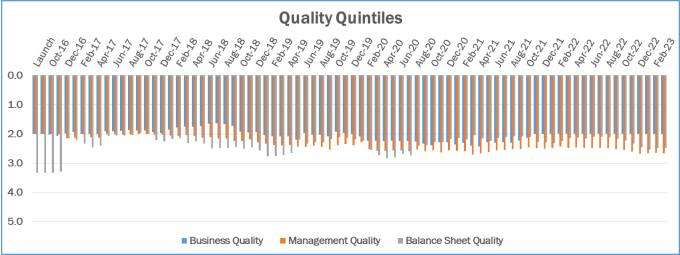
Quality Quintiles
As outlined in the Owner’s Manual, I evaluate the quality of the Business, the Management and the Balance Sheet as part of my assessment of each company. I grade each on a 5-point scale with 1 meaning Excellent, 2 Above Average, 3 Average, 4 Below Average and 5 Terrible. The chart that follows presents the weighted average for each of the three metrics for the securities in the portfolio.
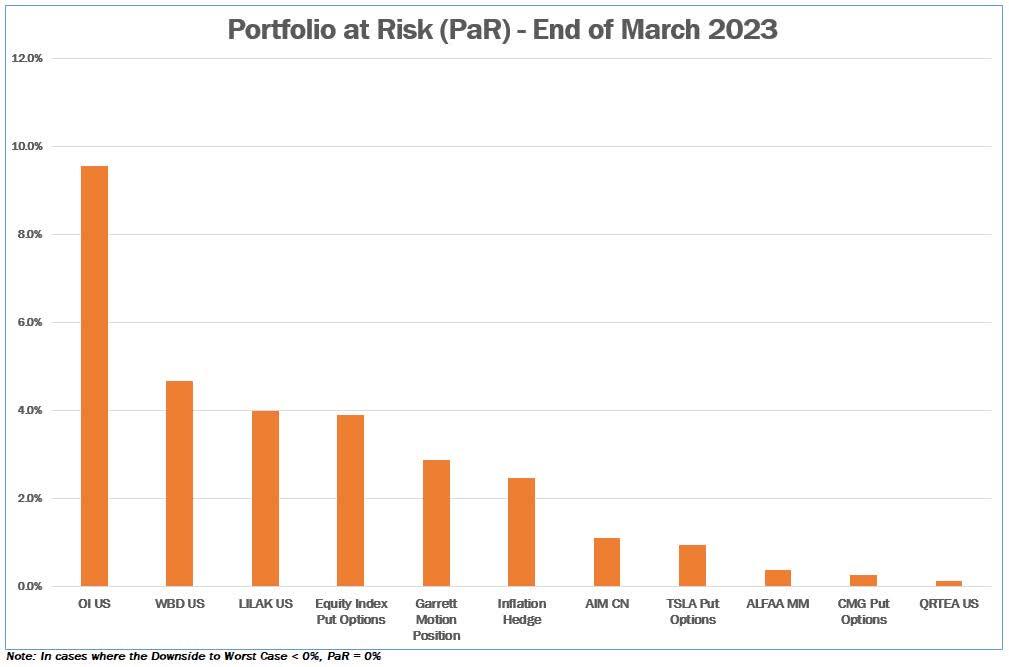
Portfolio at Risk (PaR)
I estimate the Portfolio at Risk (PaR) of each position by multiplying the weight of each position in the portfolio by the percent downside from the current price to the Worst Case estimate of intrinsic value. This helps me manage the risk of permanent capital loss and size positions appropriately, so that no single security can cause such a material permanent capital loss that the rest of the portfolio, at reasonable rates of return, would not be able to overcome. I typically size positions at purchase to have PaR levels of 5% or lower, and a PaR value of 10% or more at any time would be a red flag. The chart below depicts the PaR values for the securities in the portfolio as of the end of the quarter. Positions are presented including options when applicable.
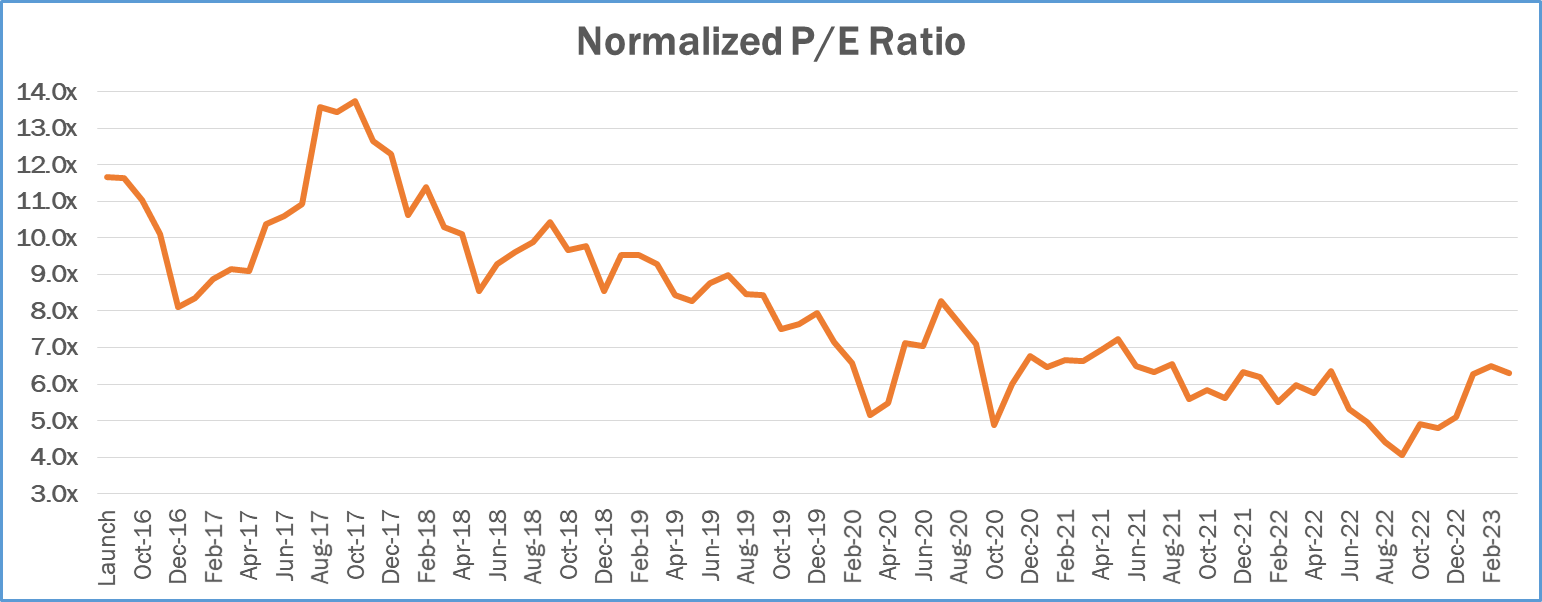
Normalized Price-to-Earnings (P/E) Ratio
I supplement my intrinsic value estimates, which are based on Discounted Cash Flow ((DCF)) analysis, with a number of other metrics that I use to make sure that my value estimates make sense. One of the more useful ones is the Normalized P/E ratio. The denominator is my estimate of earnings over the next 12 months, adjusted for any one-time/unsustainable factors, and if necessary adjusted for the cyclical nature of the business to reflect a mid-cycle economic environment. The numerator is adjusted for any excess assets (e.g. excess cash) not used to generate my estimate of normalized earnings. One way to interpret this number is that its inverse represents the rate of return we would receive on our purchase price if earnings remained permanently flat. So a normalized P/E of 10x would be consistent with an expectation of a 10% return. While the future is uncertain, it is typically my goal to invest in businesses whose value is increasing over time. If I am correct in my analysis, our return should exceed the inverse of the normalized P/E ratio over a long period of time. The graph below represents the weighted average normalized P/E for the equities in the portfolio.
Conclusion
Unlike my last letter, the poem below is entirely by yours truly, with no help from any AI-bots. You may hold me completely responsible for what follows:
Rolling Treasury bills isn't fun,
But I would rather our money not be gone.
If we try to be overly clever,
Our capital might be lost forever.
Most mistakes impatience reveal, And an over-abundance of zeal.
We convince ourselves to do acts, When our investment case lacks enough facts.
When a great investment is found, We get a feeling that's rather profound.
We don't need to debate whether it's good, Since it's clearly misunderstood.
I am happy to answer any questions that you have. Your feedback is important to me; please let me know how I can improve future letters. I greatly appreciate your trust and support, and I continue to work diligently to invest our capital.
Sincerely,
Gary Mishuris, CFA, Managing Partner, Chief Investment Officer
Silver Ring Value Partners Limited Partnership
IMPORTANT DISCLOSURE AND DISCLAIMERS
The information contained herein is confidential and is intended solely for the person to whom it has been delivered. It is not to be reproduced, used, distributed or disclosed, in whole or in part, to third parties without the prior written consent of Silver Ring Value Partners Limited Partnership (“SRVP”). The information contained herein is provided solely for informational and discussion purposes only and is not, and may not be relied on in any manner as legal, tax or investment advice or as an offer to sell or a solicitation of an offer to buy an interest in any fund or vehicle managed or advised by SRVP or its affiliates. The information contained herein is not investment advice or a recommendation to buy or sell any specific security.
The views expressed herein are the opinions and projections of SRVP as of March 31 st , 2023, and are subject to change based on market and other conditions. SRVP does not represent that any opinion or projection will be realized. The information presented herein, including, but not limited to, SRVP’s investment views, returns or performance, investment strategies, market opportunity, portfolio construction, expectations and positions may involve SRVP’s views, estimates, assumptions, facts and information from other sources that are believed to be accurate and reliable as of the date this information is presented—any of which may change without notice. SRVP has no obligation (express or implied) to update any or all of the information contained herein or to advise you of any changes; nor does SRVP make any express or implied warranties or representations as to the completeness or accuracy or accept responsibility for errors. The information presented is for illustrative purposes only and does not constitute an exhaustive explanation of the investment process, investment strategies or risk management.
The analyses and conclusions of SRVP contained in this information include certain statements, assumptions, estimates and projections that reflect various assumptions by SRVP and anticipated results that are inherently subject to significant economic, competitive, and other uncertainties and contingencies and have been included solely for illustrative purposes.
As with any investment strategy, there is potential for profit as well as the possibility of loss. SRVP does not guarantee any minimum level of investment performance or the success of any portfolio or investment strategy. All investments involve risk and investment recommendations will not always be profitable. Past performance is no guarantee of future results. Investment returns and principal values of an investment will fluctuate so that an investor's investment may be worth more or less than its original value.
Editor's Note: The summary bullets for this article were chosen by Seeking Alpha editors.
For further details see:
Silver Ring Value Partners Q1 2023 Letter