LILAK - Silver Ring Value Partners Q2 2022 Partner Letter
Summary
- Silver Ring Value Partners provides investment advisory services. The Company offers portfolio management, financial planning, and trading services. Silver Ring Value Partners serves investors in the State of Massachusetts.
- At the end of June 2022 the portfolio was very attractively priced, with the Price to Base Case value ratio at 56%.
- Market participants tend to over-extrapolate the recent past.
- Findcompanies you understand, run by honest people whose long-term cash flowstreams are greatly underestimated by the market.
Dear Partners:
I hope that you are doing well. Temperament is perhaps the most underrated attribute an investor can have. It can’t really be taught – you are either wired to panic with the rest of market participants or you are able to stand apart from the crowd. There are many things that I may not excel at, but if there is one thing that I pride myself on it is my ability to remain rational under extreme pressure. This allows me to continue systematically executing the investment process that I have described to you in the Owner’s Manual regardless of the gyrations of the market and the fear-and-greed cycle of market participants. I strongly believe the process works over the long-term, and most of my family’s capital is invested alongside yours in the partnership.
The path of major stock market sell-offs has been fairly similar:
- speculative companies with little financial history or profits sell off
- then these companies decline further than most people imagined possible
- small, less liquid or financially levered companies sell off
- then they go even lower, to levels where it's clear nobody is paying any attention to valuation
- "blue chip" stocks, which had previously been the safe havens, sell off deeply
- most people hate stocks and think all stock investing is gambling, which is the moment of maximum pessimism (remember Business Week’s famous "Death of Equities" article?)
This trajectory can take years and things don't have to play out fully along this path. The severity of a sell-off is impossible to know, and figuring out where the bottom is would be a fool's errand. But pretty much every sell-off that I lived through or studied has followed this arc.
Why? Because human psychology is the constant across decades. There is very little in the markets outside of fear and greed.
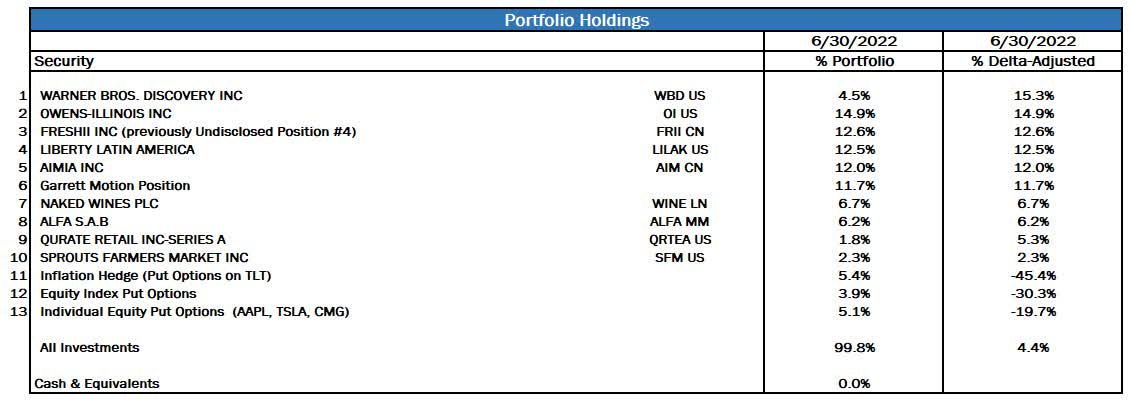
At the end of June 2022 the portfolio was very attractively priced, with the Price to Base Case value ratio at 56%. The portfolio had 13 investments plus hedges, cash at 0% and option-adjusted net exposure at 4%. My investment decisions are driven by bottom-up considerations, and cash is a residual of that bottom-up investment process. I do not seek to time the market, and I continue to rigorously adhere to my criteria for quality and discount to intrinsic value.
Investment Activity
I made the following changes to the portfolio during Q2 2022:
- Added to the Naked Wines ( NWINF ) position to restore it back to a Small size following a price drop
- Modestly Increased the Aimia ( AIMFF ) position back to Medium after a price decline
- Started a position in High Yield ETF put options
- Added to the Liberty Latin America ( LILAK ) position to restore to a Medium size following a price decline
- Added to the Qurate Retail ( QRTEA ) call option position
- Added to the Warner Brothers Discovery ( WBD ) call option position
- Added to the Tesla ( TSLA ) put option position
- Added to the Apple ( AAPL ) put option position
- Exited the [[ARKK]] ETF put position at a meaningful profit
- Exited the Snap ( SNAP ) put option position at a meaningful profit
- Reduced the Sprouts Farmers market ( SFM ) position
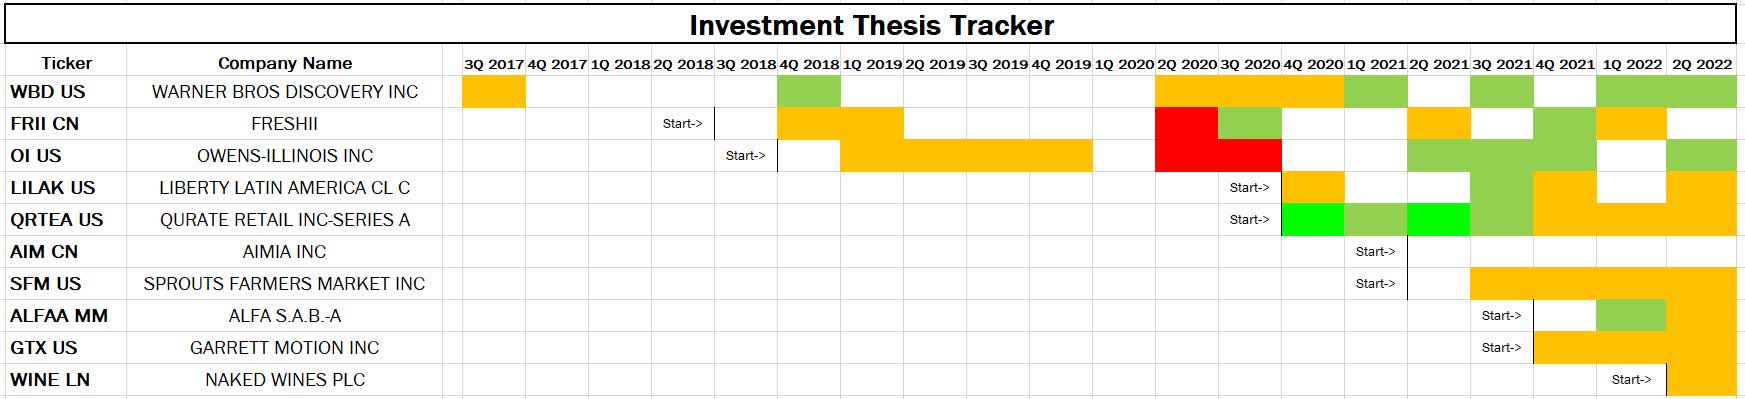
- White: thesis is tracking roughly in-line with my base case
- Orange: thesis is tracking somewhat below my base case
- Red: thesis is tracking significantly below my base case
- Dull Green: thesis is tracking somewhat better than my base case
- Bright Green: thesis is tracking significantly better than my base case
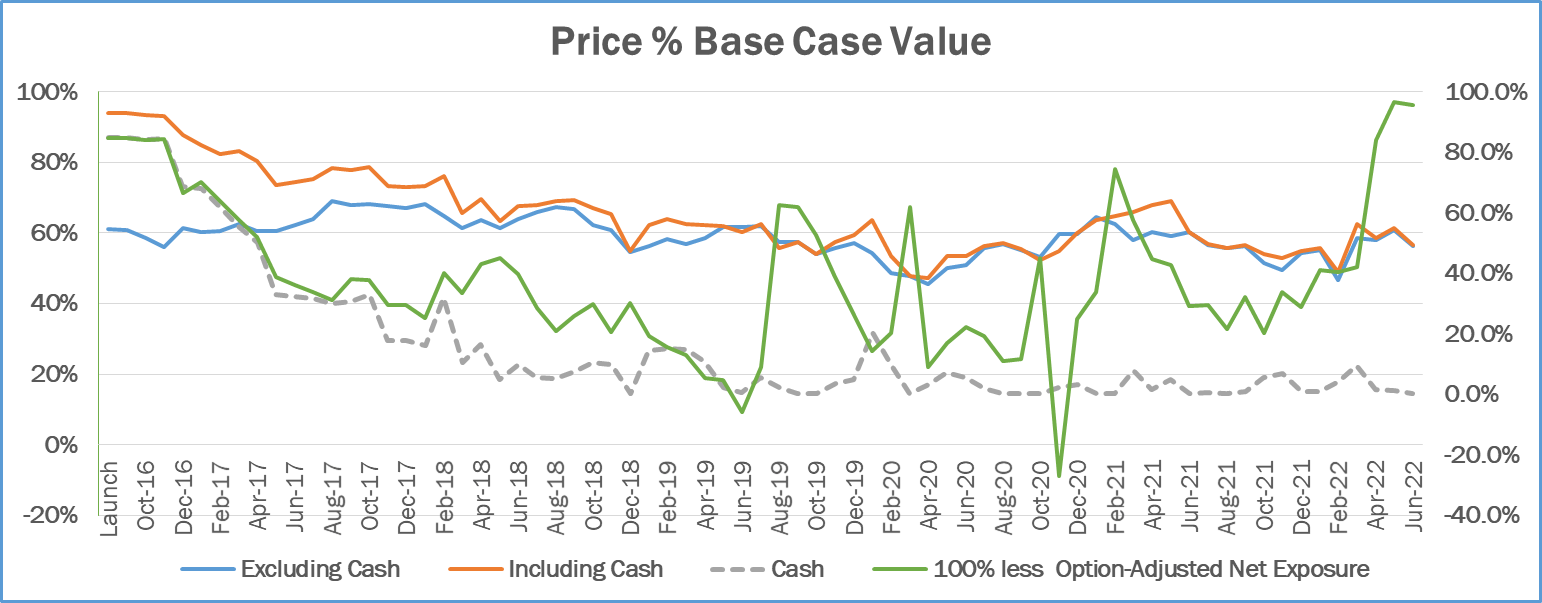
- The portfolio was attractively priced at 56% of Base Case value at end of Q2 2022
- Option-adjusted net exposure was at 4%, reflecting option-based hedges
Operational Update
I am planning to hold the Annual Partnership Meeting in early October. You can attend in person or virtually, and invitations will be sent out in the coming weeks. If you are considering joining the partnership and would be interested in attending, please reach out to me for information.
Portfolio Update
What Are The Dangers And Rewards Of Doubling Down On Your Investments?
The research note sent electric shocks through Fidelity’s investment department. It was sent by a senior analyst with over 5 years of investing experience who was expected to become a portfolio manager within a few years. It stated: “Any portfolio manager who doesn’t buy this stock, doesn’t deserve to be a PM.”
That analyst never got the coveted promotion to PM. The stock turned out to be a fraud. That’s why it looked like such a sure thing. Sometimes things that look too good to be true actually aren’t that good.
A famous investor made a career-defining move when he doubled down on Amazon post the DotCom bubble. He kept buying the stock as it kept sinking from a peak of over $80 to a low of below $10 in 2001. His mantra? “The lowest average cost wins.”
Having proven himself to have balls of steel, that same investor attempted an encore performance during the Great Financial Crisis of 2008-2009. He kept doubling down on big, safe, blue-chip financials which were being sold-off in an irrational panic. Remember, the lowest average cost wins, right? Well, not if the companies you are buying stock in go under, which is what happened to this manager. Suffice it to say, his investment career didn’t benefit from the losses that his fund’s shareholders suffered as a result of his boldness.
He wasn’t alone. There were a number of well-respected, skilled investors who kept doubling down on the likes of Washington Mutual, Bear Stearns and Lehman Brothers. One portfolio manager whom I hold in high regard made Washington Mutual a 15% position and published a thoughtful analysis on why it couldn’t possibly be worth as little as the market was valuing it at. It didn’t help him, nor his shareholders.
There was an old story circulating at Fidelity, perhaps apocryphal, of a portfolio manager who lost half of his fund in a single 5% position. I will let you sort out how that could have happened. And yet, when done well, doubling down on an attractive investment can make the difference between a good track record and a great one. So how do we decide when it is wise to do so, and when is discretion the better part of valor?
At the risk of being Captain Obvious, we should only double down on investments when their downside is limited. When is that? Let’s use Charlie Munger’s mental model and invert the question: what causes there to be near 100% downside in an investment?
Financial Leverage – Companies with substantial financial leverage can have their equity wiped out in a crisis. That should be obvious, but smart investors outsmart themselves all too often by finding arguments why in this specific case the investment is safe and won’t be wiped out. This is likely a case of the inside view behavioral bias at work.
External Funding Requirements – The company might start the crisis in a net-cash position, but if it needs to raise capital to continue operating under some business scenarios, then it is at the mercy of financial markets. And financial markets aren’t always merciful.
Reflexivity – George Soros introduced this concept in Alchemy of Finance . The intrinsic value mental model of investing postulates that value is a function of fundamentals, and over time has a gravitational pull on the price of the security. On the other hand, reflexivity suggests that price can actually change value . This isn’t the case for most companies, but it does happen. For example, the lower the stock price of Bear Stearns went during the Great Financial Crisis, the less confidence customers had in the company and the faster they left for competitors.
Path Dependency – Imagine two scenarios for a recession: a brief and shallow one vs. a long and deep one. If the company is fine in the first case but goes under or seriously dilutes value in the second case, then it is path dependent. Since you really don’t know the path the world will take, doubling down in such an investment can be a recipe for disaster.
Weak Management and Board – A take-under is when a company gets taken private at well below its intrinsic value. This is a serious risk with weak and poorly incented boards. It usually works like this: The stock declines dramatically. A press release goes out, stating something like “The transaction delivers substantial value to XYZ’s shareholders and represents a 39% premium to XYZ’s 30-day volume weighted average price per share as of the unaffected stock price.” Wait a second. Who cares about the 30-day average price? Why is that the determinant of intrinsic value? And what about all the recent optimistic pronouncements by the management team about future prospects, which might lead one to believe a much higher value is warranted? Well, guess what? The CEO will likely do just fine – he will get equity in the new private entity, or similar incentives. Unless he and/or a good portion of the board own enough outright equity or have a strong moral compass to not take from long-term shareholders’ pockets, a take-under is a risk, albeit a less serious one than those above.
Unscrupulous Management – There was a well-known case of a billionaire tech founder taking his company private at a very low price despite the protests of many long-term investors. They sued him. He won. I will never understand why really wealthy people need to use such tactics to get slightly wealthier, but it happens.
Unstable Demand – You can have the cleanest balance sheet and the best governance, but if you are selling pet rocks and people change their minds about their choice of pets, then you might be out of business. Doubling down on an investment demands something that strongly anchors value and leads you to believe the business isn’t transient in nature. Avoid faddish businesses or those that are easily disrupted by other business models.
Let’s say you have vetted your investment, and none of the above apply. Does that mean you should go all-in and make this a 40%, 50% or even 100% position? I frequently hear investors reference Warren Buffett’s ~ 50% position in American Express during the salad oil scandal when he was managing the Buffett Partnership. Well, I have news for most of you: you aren’t Warren Buffett.
Neither am I. A company can pass all the above checks and still be a fraud – recall our analyst from earlier on. Or we can simply make a mistake in our analysis. Or perhaps we have succumbed to one of a number of behavioral biases and are acting only somewhat rationally and also somewhat emotionally.
So if a company passes all of the above tests, that’s a green light to double down. It’s not a green light to lose 50% of your portfolio in a single investment. The best way to guard against that is to set an initial budget for what percentage of the portfolio you are willing commit to this investment over time at cost, and then to stick to it.
This will have the added benefit of forcing you to add to your position gradually. Remember, stocks can go a lot lower than you think. And then they can go down some more. We want our process, rigorously implemented over time, not any one brilliant decision, to be the driver of superior results.
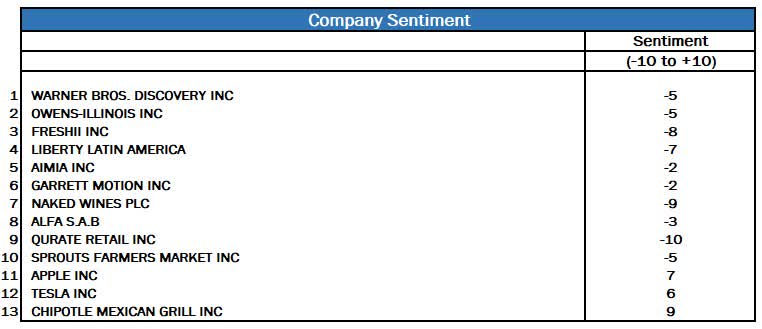
Investment Sentiment
Valuation is a lens on long-term expectations. It tells us what kind of revenues and cash flows the company needs to achieve in order to justify the current price.
Sentiment is related, but it adds a measure of the current emotional perspective of market participants towards a security. Why bother thinking about sentiment at all? It can highlight market’s excesses in one direction or another towards a security.
Market participants tend to over-extrapolate the recent past. At the risk of greatly oversimplifying, they assume that a company that has recently done poorly will continue to do so, and one that had a recent positive trajectory will remain on that upward path for a long time.
They aren’t wrong. At least not all the time. Companies that run into trouble sometimes continue to experience trouble, culminating in bankruptcy. Those that have shown strong recent growth and profits can defy economic gravity and continue to grow at exceptional rates for decades.
However, many companies that have had a spurt of exceptional results are going to have far more mundane ones far sooner than the market tends to believe. Conversely, not all trouble is a gateway to bankruptcy – many companies will recover far more than investors tend to believe when those companies are in the thick of their troubles. To re-use the quote from Horace that Benjamin Graham used at the beginning of Security Analysis : “Many shall be restored that now are fallen, and many shall fall that are now in honor.”
Looking at sentiment can help us highlight the market’s extremes – like a rubber band stretched too far in one direction or another. Below is my assessment of the sentiment on our holdings.
Portfolio Activity
Aimia
The company closed the sale of its major asset, its PLM miles loyalty business, and received the cash proceeds. This substantially de-risks the investment, as the company now has cash in excess of the market price. With the stock trading at approximately 60% of my estimate of value, there is a lot of margin of safety against the possibility of capital allocation mistakes by management. Conversely, if market turbulence continues and management is able to deploy the funds at high rates of return, the above discount to value may well prove to be understated.
Naked Wines
The company reported a moderately disappointing half-year result. Subscribers (aka “angels”) grew, which was good. However, the company is struggling to attract new customers to the top of its marketing funnel in a cost effective way. Furthermore, repeat customer contribution margins declined, driven primarily by the U.S. business where the company has been slow to pass through inflation.
The stock reaction – the share price was cut in half – appears to me far disproportionate to the incremental fundamental developments. At the current valuation, the stock price is implying an imminent and severe decline in the business. That possibility cannot be eliminated, but there is very little evidence for that thus far.
Even in a declining scenario, which is not what I believe to be the company’s long-term trajectory, the company is likely to generate enough cash flow to more than justify the current price. Therefore, I restored the position back to a small, ~ 5%, size. With a clean balance sheet and sticky customers who are on average very happy with the service, the investment meets the criteria for “doubling down” that I outlined earlier in the letter.
Why not make it a larger, 10% or 15% position? Experience has taught me a lot of humility over the years. While my analysis suggests the opportunity here is excellent, this is still a small, niche business. There could be adverse regulatory changes out of left field that could impact the economics. Or I can simply be wrong and temporary cyclical factors are propping up demand, masking the trouble brewing beneath the surface.
If the company fixes its top-of-funnel issues, demonstrates pricing power without affecting its value proposition and improves profitability, the stock may go higher. Such a scenario would increase the likelihood of being correct in my thesis. The combination of a higher price with a much higher certainty in my value estimate being correct might then merit a larger position size.
Snap
I bought SNAP put options in the fall of 2021, when the stock was above $70 and its market cap around $100B. With revenues of ~ $4B in 2021, this put the company at a whopping 25x sales. I refer to a multiple of sales only because the company wasn’t yet making a profit, despite its astronomical valuation.
I strongly believed that market participants were over-extrapolating a few years’ worth of high sales growth too far into the distant future. This growth was likely temporarily boosted as advertisers experimented during COVID, attempting to reach customers in new ways. In other words, it was benefiting from unsustainable forces.
Having followed the media space for two decades, one thing that I have observed is that change happens slowly. Advertisers rarely abandon an old medium in a wholesale fashion or embrace a new one in such a way. Instead, they shift their budgets incrementally, experimenting and measuring Return on Investment ( ROI ) along the way.
Snap might be an interesting and, to a segment of the population, useful social media app. It’s quite possible that its usage will grow, as will its revenue. However, the likelihood that the business would grow at a magnitude and duration implied by the stock market price was very low. That’s just not how advertising works.
I bought the put options for January 2023 with a strike price of $27. I believed that this would give us both a reasonable amount of time for the bubble to burst, and a ~ 10x risk/reward. The position was sized as 0.5%. Many such options will expire worthless, and risk management is important.
Fast forwarding to July 2022, less than a year later, and the same stock was now trading in the single digits. Mind you, sales are still growing, just not quite as rapidly as starry-eyed investors thought they would.
We got close to the 10x targeted payoff. The extra benefit is that this capital became available just as a number of our holdings reached extreme valuation levels in the 30% to 50% range. If I am proven to be correct on their values, the 10x return from the SNAP put options will be further magnified, to our benefit.
Lest you think this is going to be a frequent occurrence or that I somehow fancy myself to be a put options guru, rest assured, neither of these are true. The 10x payoff is necessary because so many such capital commitments will expire worthless. Furthermore, the extremes that we witnessed in 2021 are not an every year, or even an every decade occurrence. This appears to have been a true bubble, as I wrote at the time. The vast majority of the time you should expect me to focus on investing in predictable, cash flow-rich businesses at depressed valuations. There might not be another opportunity to buy put options such as these at attractive prices for many years to come.
High-Yield ETF put options
I added a ~ 1% position in High Yield ETF put options. The position will have a ~ 12x return if intermediate-term junk bond rates reach 15% by early 2023. It will begin to be profitable if such rates cross the 10% threshold.
The position is part of our inflation hedge, but it has an additional benefit. There are two ways in which rates might reach such heights. One is if the underlying government bond rates spike if inflation runs further out of control than the market currently expects. The other is if junk bond spreads to government bonds spike.
When I initiated the position, 5-year U.S. government bonds were around 3%, and spreads were around 5%, for overall junk bond yields of around 8%. In prior recessions/crises junk bond spreads spiked as high as 12% above the government bonds of comparable maturity.
So this position gives us both additional protection against runaway inflation as well as against a deep recession/financial market meltdown. As with other such positions, two things are true:
- The most likely scenario is that we just lose our 1% and the options expire worthless. Given the 12:1 return profile, the expected value can be quite positive even if the substantial majority of the probability is against the position working out
- If the payoff does occur, we would likely be in an environment of deeply depressed security prices, allowing us to use the timely infusion of capital to snap up bargains and amplify the payoff profile of this hedge
The position sizing is important here. I am not trying to make a bet on a recession, spiraling inflation or a financial crisis. To the contrary, the major “bet” I am making is on my security selection and portfolio construction of the deeply undervalued securities that we are invested in. The purpose of the hedge is to give up a small portion of the upside in order to try to make sure that external events beyond my control or ability to predict don’t derail our long-term results.
Performance Discussion and Analysis
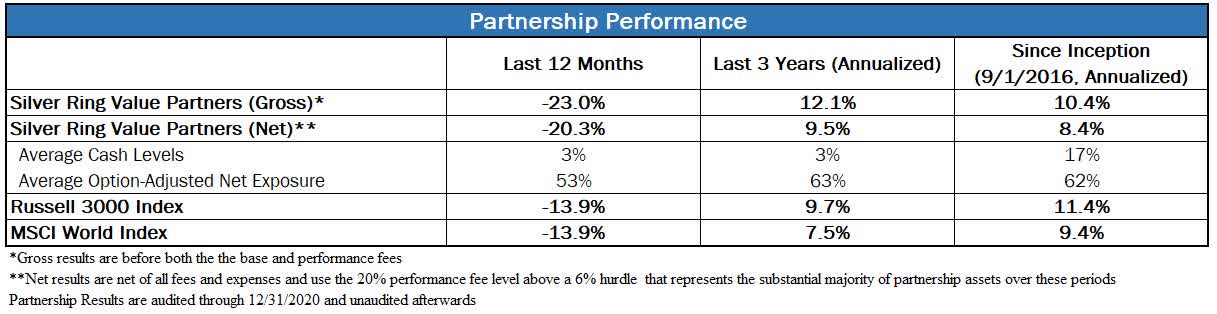
I encourage you to consider the results summarized below in conjunction with both the investment thesis tracker as well as the discussion of the individual companies in this letter. Any investment approach that is judged over less than a full economic and market cycle is liable to appear better than and worse than it really deserves at different points. Ultimately, it is the quality of the investment process and the discipline with which it is implemented that determines the long-term outcome. Therefore, I strongly encourage you to focus on process over outcome in the short-term.
* Performance fee is presented based on the 20% rate, which reflected the majority of the assets during these time periods ** Option-Adjusted Net Exposure adjusts for the use of options by replacing their weight with the delta-adjusted notional value for each option. While imperfect, it takes into account both the use of put option hedges and the presence of call options Disclaimers: Please see the “Disclaimers” section at the end of this letter |
Your Questions
As I have committed to do in the Owner’s Manual, I will use these letters to provide answers to questions that I receive when I believe the answers to be of interest to all of the partners. This quarter I did not receive any questions. Please keep the questions coming; I will do my best to address them fully.
Portfolio Metrics
I track a number of metrics for the portfolio to help me better understand it and manage risk. I track these both at a given point in time, and as a time series to analyze how the portfolio has changed over time to make sure that it is invested in the way that I intend for it to be. Below I share a number of these metrics, what each means, and what it can tell us about the portfolio. As time passes, you should be able to refer to these charts and graphs to help you gain deeper insight into how I am applying my process.
Price % Base Case Value
This metric tracks the portfolio’s weighted average ratio between market price and my Base Case intrinsic value estimate of each security. This ratio is presented both including cash and equivalents, which are valued at a Price to Value of 100%, and excluding those. All else being equal, the lower these numbers are, the better. Excluding cash and equivalents, a level above 100% would be a red flag, indicating that the portfolio is trading above my estimate of intrinsic value. Levels between 90% and 100% I would characterize as a yellow flag, suggesting that the portfolio is very close to my estimate of value. Levels between 75% and 90% are lukewarm, while levels below 75% are attractive.
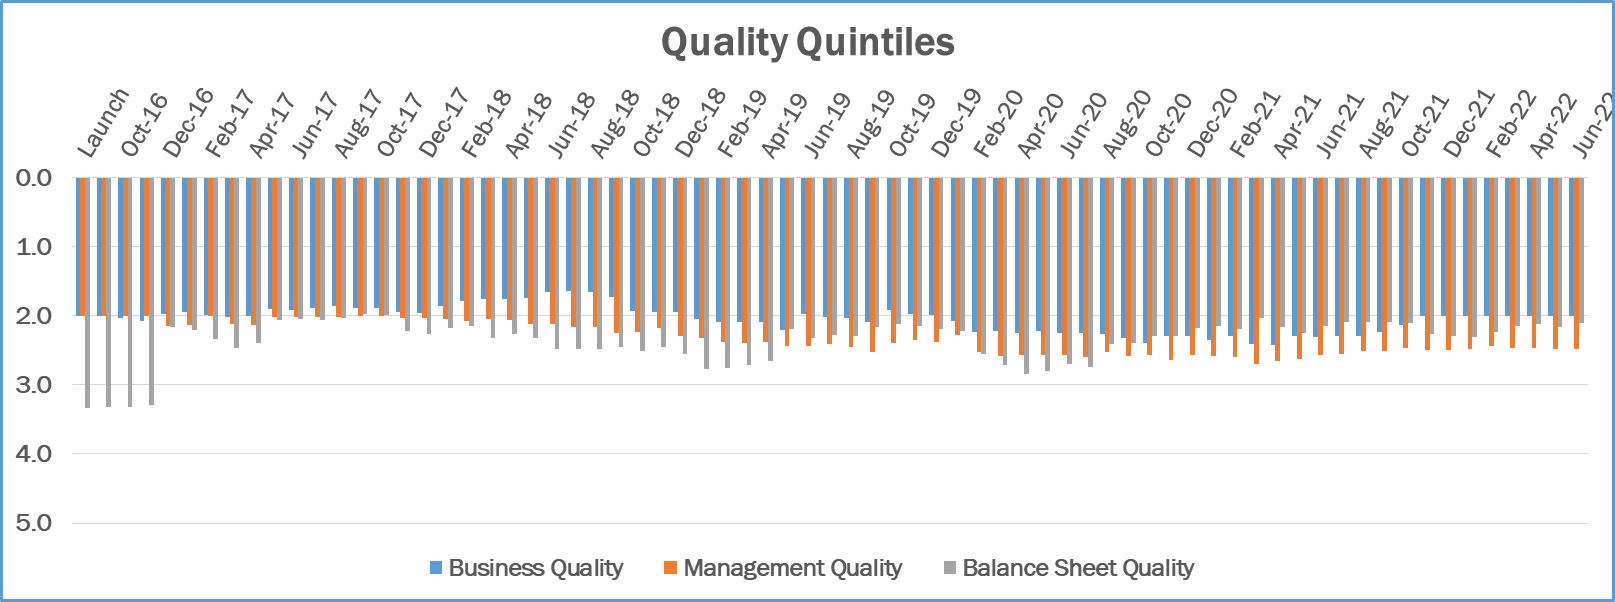
Quality Quintiles
As outlined in the Owner’s Manual, I evaluate the quality of the Business, the Management and the Balance Sheet as part of my assessment of each company. I grade each on a 5-point scale with 1 meaning Excellent, 2 Above Average, 3 Average, 4 Below Average and 5 Terrible. The chart that follows presents the weighted average for each of the three metrics for the securities in the portfolio.
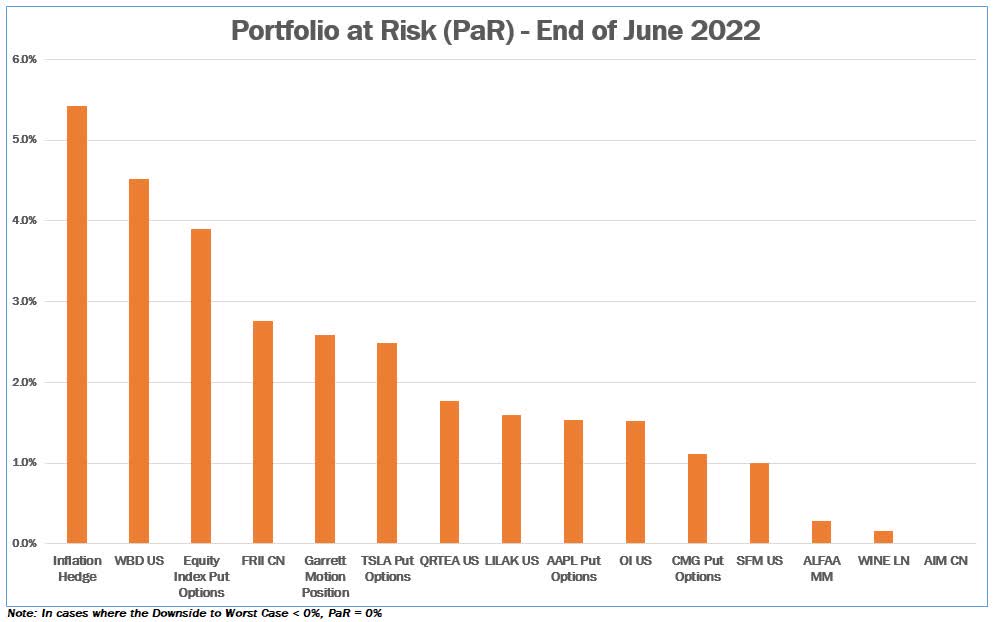
Portfolio at Risk ((PAR))
I estimate the Portfolio at Risk ((PAR)) of each position by multiplying the weight of each position in the portfolio by the percent downside from the current price to the Worst Case estimate of intrinsic value. This helps me manage the risk of permanent capital loss and size positions appropriately, so that no single security can cause such a material permanent capital loss that the rest of the portfolio, at reasonable rates of return, would not be able to overcome. I typically size positions at purchase to have PaR levels of 5% or lower, and a PaR value of 10% or more at any time would be a red flag. The chart below depicts the PaR values for the securities in the portfolio as of the end of the quarter. Positions are presented including options when applicable.
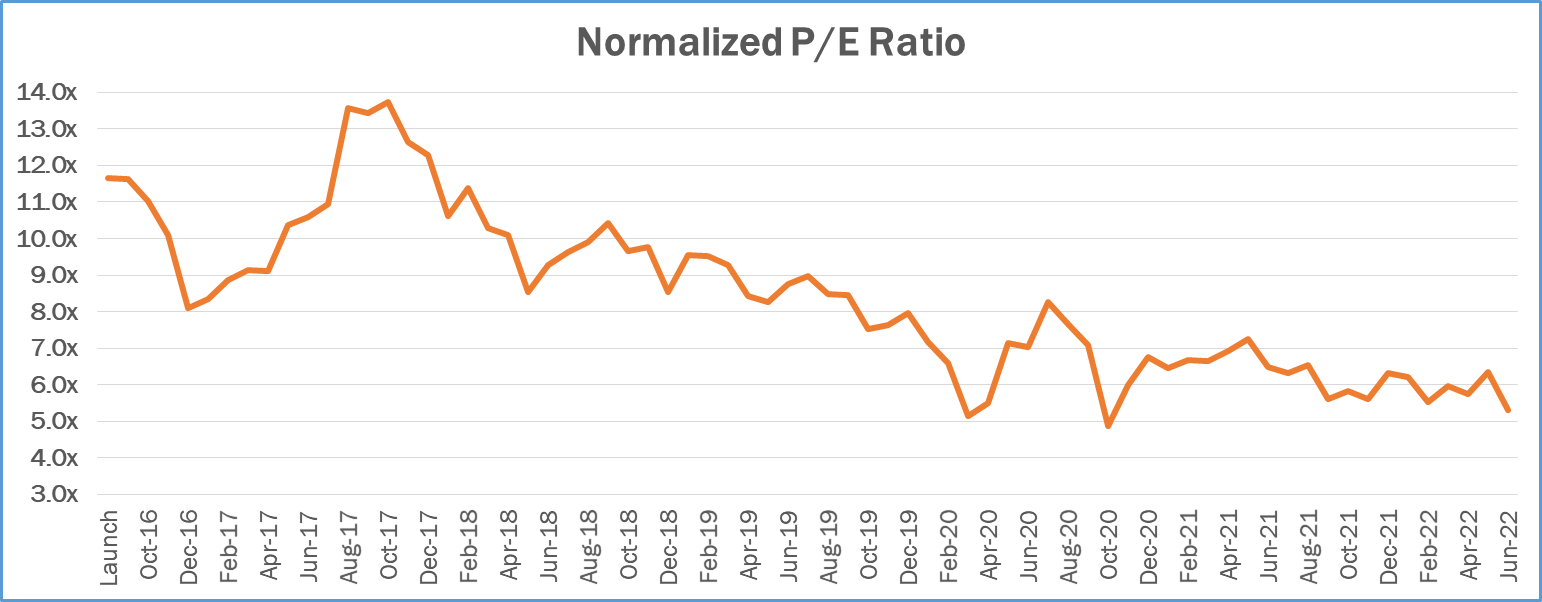
Normalized Price-to-Earnings (P/E) Ratio
I supplement my intrinsic value estimates, which are based on Discounted Cash Flow ((DCF)) analysis, with a number of other metrics that I use to make sure that my value estimates make sense. One of the more useful ones is the Normalized P/E ratio. The denominator is my estimate of earnings over the next 12 months, adjusted for any one-time/unsustainable factors, and if necessary adjusted for the cyclical nature of the business to reflect a mid-cycle economic environment. The numerator is adjusted for any excess assets (e.g. excess cash) not used to generate my estimate of normalized earnings. One way to interpret this number is that its inverse represents the rate of return we would receive on our purchase price if earnings remained permanently flat. So a normalized P/E of 10x would be consistent with an expectation of a 10% return. While the future is uncertain, it is typically my goal to invest in businesses whose value is increasing over time. If I am correct in my analysis, our return should exceed the inverse of the normalized P/E ratio over a long period of time. The graph below represents the weighted average normalized P/E for the equities in the portfolio.
Conclusion
We constantly see headlines such as:
"Recession is coming"
"Inflation"
"Stagflation"
"Deflation"
"Dip-buyer rally"
"Risk-on"
"Risk-off"
It boggles my mind that people actually think like this and invest this way. It's a crazy way to invest one's hard-earned capital.
Why not find companies you understand, run by honest people whose long-term cash flow streams are greatly underestimated by the market? I guess that doesn't make for good headlines or soundbites. But it's probably safer and more profitable for your wallet.
I am happy to answer any questions that you have. Your feedback is important to me; please let me know how I can improve future letters. I greatly appreciate your trust and support, and I continue to work diligently to invest our capital.
Sincerely,
Gary Mishuris, CFA | Managing Partner, Chief Investment Officer | Silver Ring Value Partners Limited Partnership
Editor's Note: The summary bullets for this article were chosen by Seeking Alpha editors.
For further details see:
Silver Ring Value Partners Q2 2022 Partner Letter