GTX - Silver Ring Value Partners Q3 2023 Letter
2023-11-03 05:05:00 ET
Summary
- Silver Ring Value Partners provides investment advisory services. The Company offers portfolio management, financial planning, and trading services. Silver Ring Value Partners serves investors in the State of Massachusetts.
- I have also worked hard to learn valuable lessons from past mistakes. One of them was to raise, not lower, the bar for business quality.
- Cheapness of the security is not enough when management is either not very competent or not well aligned with the shareholders.
- What you pay attention tomatters, even more so because of the other things it makes you lose sight of.
Dear Partners:
I hope that you are doing well. I will keep this letter on the shorter side given the upcoming Annual Partnership Meeting for which partners should have already received an invitation. During the meeting I plan to review the investing process and the portfolio in-depth as well as answer your questions.
If you are not currently a partner and are a Qualified Investor who is seriously considering joining us, please contact me for information about the meeting as it’s a great opportunity to understand the Partnership better. The meeting will be held both in-person and virtually.
I wish I were writing that I had found many new investment ideas. However, despite researching several companies during the quarter, I have not yet found any new opportunities that meet my criteria for the quality of people, business, and balance sheet, and with the stock trading at a price that is clearly offering a large margin of safety and attractive returns.
There are certainly plenty of behavioral pressures to act. Not investing carries the risk of appearing to be some combination of lazy, unskilled, or out of touch with the market. That’s even more the case when others are finding ideas.
However, we are not going to get rewarded for activity, but rather for finding exceptional investments. I have outlined my process and criteria in the Owner’s Manual which I have shared with all of you, and I continue to diligently execute that process. In the meantime, with U.S. Treasury Bill rates well above 5%, the opportunity cost of waiting for good ideas has come down.
I have also worked hard to learn valuable lessons from past mistakes. One of them was to raise, not lower, the bar for business quality. Another is that cheapness of the security is not enough when management is either not very competent or not well aligned with the shareholders. Both lessons argue for a higher rather than a lower bar than in the past. I am confident that I will find opportunities that meet my high criteria. Until that time, I am going to keep searching and be careful with our capital.
Investment Activity
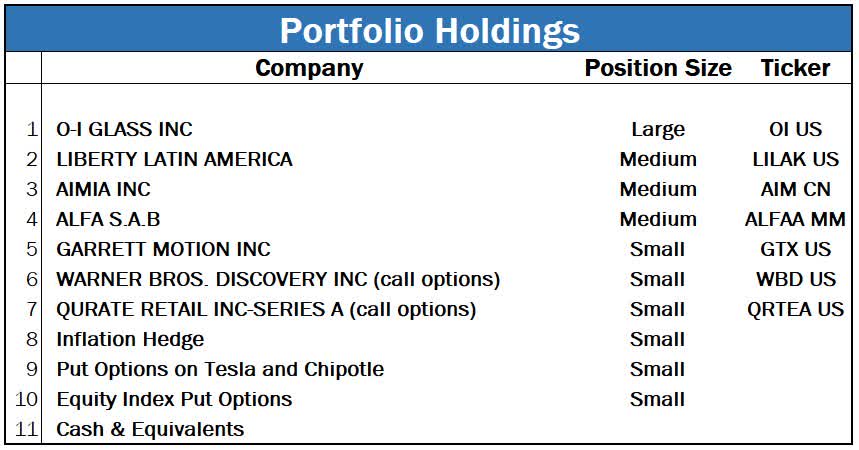
- Reduced Garrett Motion ( GTX ) from a Medium to a Small position size
- Increased Alfa ( ALFFF ) from a Small to a Medium position size
- After the end of the quarter Aimia ( AIMFF , AIM:CA ) received a take-over bid and subsequently management issued a material amount of new shares to a different investor group who they considered strategic. I plan on providing an update on the company in the next letter.
- Light Gray: thesis is tracking roughly in-line with my base case
- Orange: thesis is tracking somewhat below my base case
- Red: thesis is tracking significantly below my base case
- Dull Green: thesis is tracking somewhat better than my base case
- Bright Green: thesis is tracking significantly better than my base case ? White: No data
- The portfolio was priced at 72% of Base Case value and at 60% excluding cash at the end of Q3
- Option-adjusted net exposure was at -11%, reflecting option-based hedges
- Excluding the inflation hedges, option-adjusted net exposure would have been 3%
- Cash and equivalents were 29% at the end of the quarter, and weren’t a reflection of market timing, but rather a temporary residual of the bottom-up investment process
Portfolio Update
Who Is Stealing Your Attention?
Earlier this month I sold an ordinary $100 bill for $235 to two sophisticated investors at the beginning of my talk at the Stansberry Conference on Behavioral Defense In Investing . My opening act elicited laughter from the audience as they watched one of their peers bid over a hundred dollars for an unremarkable $100 bill that had no reason to be worth anything over that amount.
Hopefully it also convinced them of the need to guard their minds when making serious financial decisions. The conference is also where I met an extraordinary gentleman. He was a fellow speaker who goes by the title of The Gentleman Thief, aka Apollo Robbins . The man can literally steal anything from anyone after warning them he is about to do so. He had even managed to steal something from the Secret Service. If you haven’t watched this short video of him demonstrating his craft, I highly recommend it.
I have to admit that I initially underestimated Apollo. I first met him at the cocktail party the night before our respective talks. Watching him steal wallets and watches from people was entertaining enough. I thought of him as a master of a narrow craft, nothing more.
I even asked him if everything he was doing was just misdirection. “No,” he replied, “it’s more about curating attention.”
The next evening Apollo was kind enough to compliment me on my talk and I told him how impressed I was with his, and we dove into an in-depth discussion. It turned out that Apollo really studies how the mind works and knows some of the same world-class behavioral experts whom I know or whose works I have read. Quite impressive.
Two things that I learned from him stood out as relevant to making investment decisions.
First, Apollo showed us a video where a group of study participants’ eye focus was scientifically tracked and represented by bright dots on the screen. Starting with two hands held close together, one hand was moved away, opening up the body. When the hand was moved in a straight line, the eye focus of the participants was split between the hand that was moving, the hand that remained still and Apollo’s face. However, when the hand was moved to the same destination in an upward arc, all focus shifted to the moving hand, leaving participants paying no attention to the other hand. It’s fascinating that such a small change could have such a dramatic impact on where our attention was focused.
Second, he told me that he also sometimes does the $100 bill auction that I had performed at the beginning of my talk. Apollo said that he has a follow-up to it that he does with the “winner” of the auction, and asked if I wanted him to show it to me. Intrigued, I agreed.
He gave me a ring of his and told me to hide it in one hand behind my back, and then show him the hands with fists closed. He guessed the hand and… got it right. I hid it again, he guessed and… got it wrong! He said something about him still calibrating his read on me. We did it again, and this time he got it right. Two out of three.
Now he told me that he would be the one hiding his ring behind his back, and I would be the one guessing. Focusing intently, I looked at both hands, chose left, and… was right! He did it again, I guessed left again, and… was again correct. We did it a total of four times, and I got it right every time.
By this point, I was smiling, thinking to myself about how clever I must be to have “cracked” this master of misdirection so quickly. Apollo smiled, understandingly, at me and asked, “How do you think you are getting it right every time?”
“Well, I used to play poker. So maybe it’s a tell I am picking up?” I ventured. “I mean, I wasn’t great at poker or anything, but maybe at a subconscious level? I guess it is quite unlikely to get it right four times in a row just randomly, I mean the odds would be 1 out of 16, no?”
Apollo nodded. “Would you like to see the other hand?” he asked. “Sure,” I replied.
And then I felt like a total overconfident idiot. Apollo opened his right hand, and in it, of course, was an identical ring to the one he had been showing me in the open palm of his left. I had thought he was trying to keep me from winning . Nope. That wasn’t the point.
“Don’t feel bad. I have done this many times and everyone falls for it. Nobody ever questions why they are winning so much. They all come up with some skill-based explanation.” Oops.
How is all this relevant to investing and making decisions?
First, we might be aware of what we are paying attention to . But how aware are we of what that is making us not pay attention to? One of Apollo’s points stuck with me: “The easiest way to steal a man’s watch is to tell him you are about to steal his wallet.”
When you look at daily stock prices or the monthly performance of the fund that you are invested in, what are you not thinking about? When you are worried about how demand will trend in the coming quarter for a company that you are invested in, to what degree does that take your attention off the decisions the management is making that will impact profits in 5 years? And when your financial advisor appears in a fine suit, compliments you and works hard to get to know the names of your children, what might that take your attention away from?
Your attention is a finite resource. Whether it’s the environment you choose to be in or deliberate influence attempts of others, you must protect yourself and focus it on what you think matters.
Second, how much do we question our investing successes vs how much should we be questioning them? I have heard many brags from people who bought a stock that then went up in the next 3, 6 or 12 months. Almost never have I heard someone say that their stock went up despite their decision to buy it having been a bad one. And yet, that must happen quite a bit.
We humans have an innate need to create a causal narrative around events. If someone has good results, it must be because they did something right. If there is a stretch of bad performance, the manager must be making major mistakes. That’s far more satisfying than admitting how much is out of our control, especially over relatively short periods of time.
Yet the reality is that most of the short and intermediate-term outcomes are affected by randomness at least as much as they are by our intentional decision-making. In Warren Buffett’s famous Superinvestors of Graham-and-Doddsville article he presents a number of investing track records, most of them quite impressive. One of them, however, is downright awful. This one guy had underperformed the market every year for three years in a row. Not only that, but his partners experienced a cumulative decline in the value of their investment over those three years of 50%, more than twice the decline in equity markets over the same period.
This one “guy” was Charlie Munger. Despite those 3-year returns, his partnership’s overall record for his limited partners was returns of over 13% per year over a 14-year period when the Dow produced annual returns of 5%. That’s a cumulative return for his investors that amounts to over 5x that of the market!
What you pay attention to matters, even more so because of the other things it makes you lose sight of.
Company Updates
Garrett Motion ( GTX )
The fundamentals at the company are tracking in-line with my base case expectations. What made me reduce the position size from a medium one to a small one was that our preferred stock was converted into common equity.
When we owned the preferred stock, we had a particularly asymmetric risk/reward given the contractual downside protection offered by the preferred. After the conversion into common stock, that extra protection is gone, making the investment less attractive.
Why own the stock at all?
Garrett Motion is the #1 maker of turbochargers for cars that use an internal combustion engine (ICE). The business is typically very predictable, with design wins mapped out years in advance, and the industry is a concentrated oligopoly. The positive force driving growth has been the increasing penetration of turbochargers. The new negative force is that electric vehicles (EVs) are taking share and they don’t need a turbocharger.
At reasonable EV penetration rates the company will see its revenue growth flip from positive to negative, most likely 3 to 5 years from now. Whereas management is trying to invest organically in EV-related technology to address this large market, their success here is highly uncertain and material revenues won’t appear for at least 5 years.
Most investors stop there, call this business a melting ICE-cube (pun intended) and pass. The twist is that at the current stock price the likely Free Cash Flow ( FCF ) over the next 5 years is roughly equal to the market capitalization of the company. So this is an example of high uncertainty (about what happens to the business after year 5), but low risk of permanently losing capital.
While the risk is low, it’s not zero. Management could waste its FCF on EV-related acquisitions.
That’s mitigated somewhat by strong value investors on the Board, but it can still happen. Furthermore, there is always the risk that large powerful customers extract economics from the company in unexpected ways. The automotive value chain isn’t known for attractive returns for suppliers.
With the stock at around 60% of my Base Case value that does not include success in the EV market and a moderate downside to the Worst Case, a small position is warranted but a larger one is not.
Alfa (ALFAA MM)
Alfa is a conglomerate that is in the process of simplifying into a simple single-line business via divestitures of its other holdings. The remaining business is intended to be Sigma, which is a branded food business focusing on meats and yogurt with strong competitive positions in Mexico, U.S. and the EU. The sole other non-core business that is still part of the portfolio is Alpek, which is a commodity chemical company.
Alfa’s stock declined, driven in large part by the decline in its cyclical Alpek business. That business is deeply cyclical, and its stock, which trades independently under the ticker ALPEKA MM, is now priced at a greater than 20% Free Cash Flow yield based on historical full-cycle results. There are no material secular issues that I am aware of.
Alfa’s share price reached a level where the stock was trading at less than my estimate of the value of just the Sigma business. On the value of the whole enterprise the stock was trading at less than 50% of my base case value estimate with modest downside to my worst case.
While management is progressing towards simplifying the business slower than I, and I suspect other shareholders, would like I judge them to be competent and honest. The remaining business is of above-average quality with a small competitive advantage due to brands and distribution. This combination of facts merited the increase from a small to a medium position size.
Portfolio Metrics
I track a number of metrics for the portfolio to help me better understand it and manage risk. I track these both at a given point in time, and as a time series to analyze how the portfolio has changed over time to make sure that it is invested in the way that I intend for it to be. Below I share a number of these metrics, what each means, and what it can tell us about the portfolio. As time passes, you should be able to refer to these charts and graphs to help you gain deeper insight into how I am applying my process.
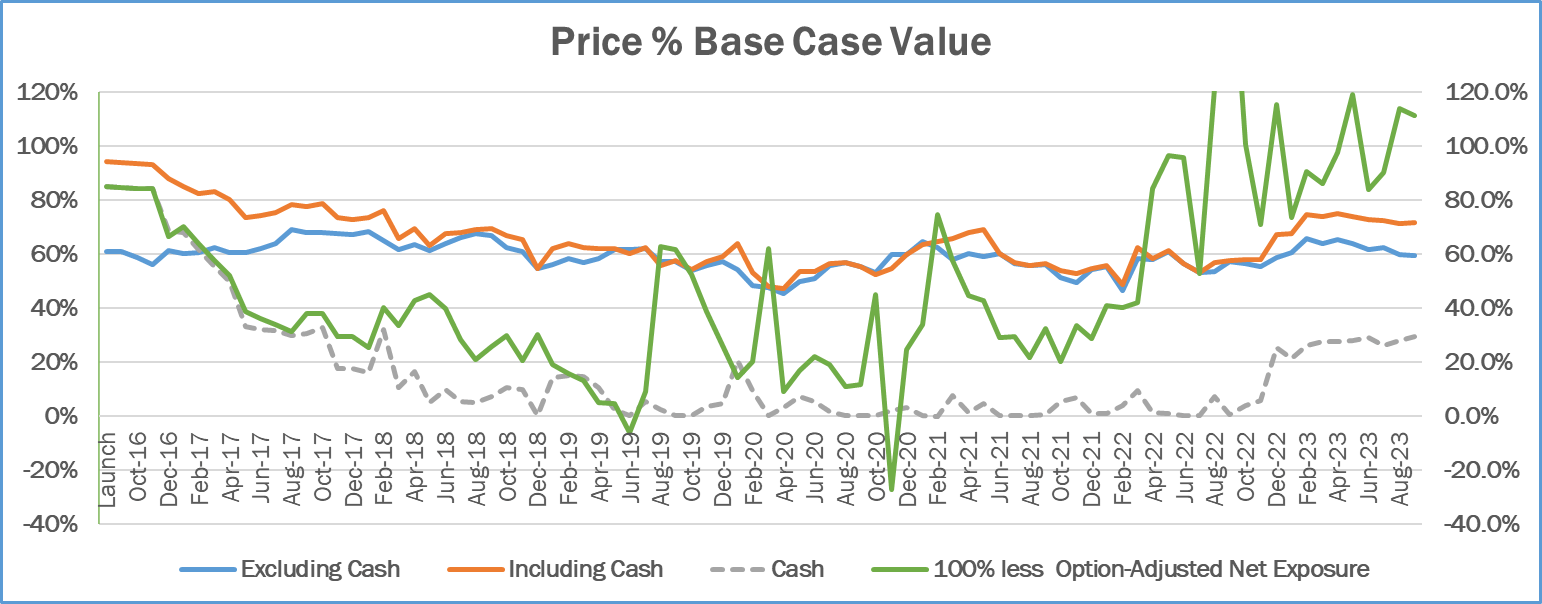
Price % Base Case Value
This metric tracks the portfolio’s weighted average ratio between market price and my Base Case intrinsic value estimate of each security. This ratio is presented both including cash and equivalents, which are valued at a Price to Value of 100%, and excluding those. All else being equal, the lower these numbers are, the better. Excluding cash and equivalents, a level above 100% would be a red flag, indicating that the portfolio is trading above my estimate of intrinsic value. Levels between 90% and 100% I would characterize as a yellow flag, suggesting that the portfolio is very close to my estimate of value. Levels between 75% and 90% are lukewarm, while levels below 75% are attractive.
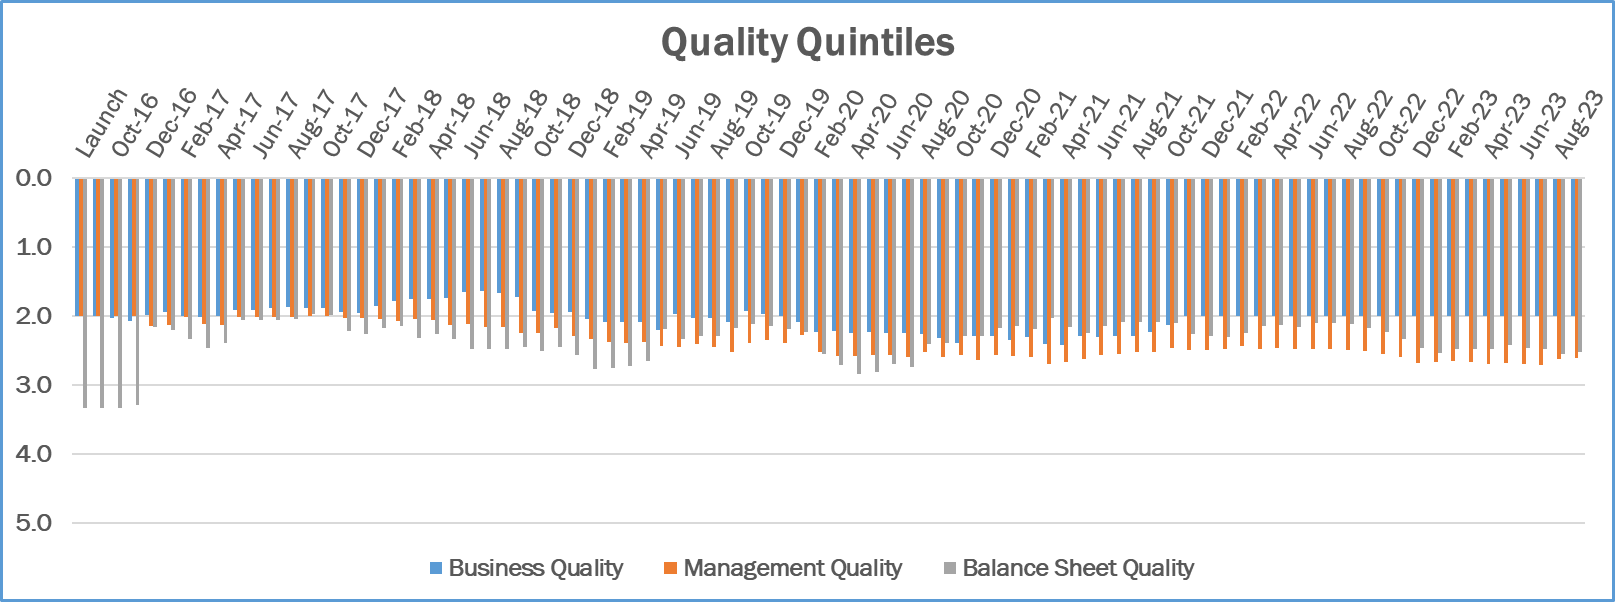
Quality Quintiles
As outlined in the Owner’s Manual, I evaluate the quality of the Business, the Management and the Balance Sheet as part of my assessment of each company. I grade each on a 5-point scale with 1 meaning Excellent, 2 Above Average, 3 Average, 4 Below Average and 5 Terrible. The chart that follows presents the weighted average for each of the three metrics for the securities in the portfolio.
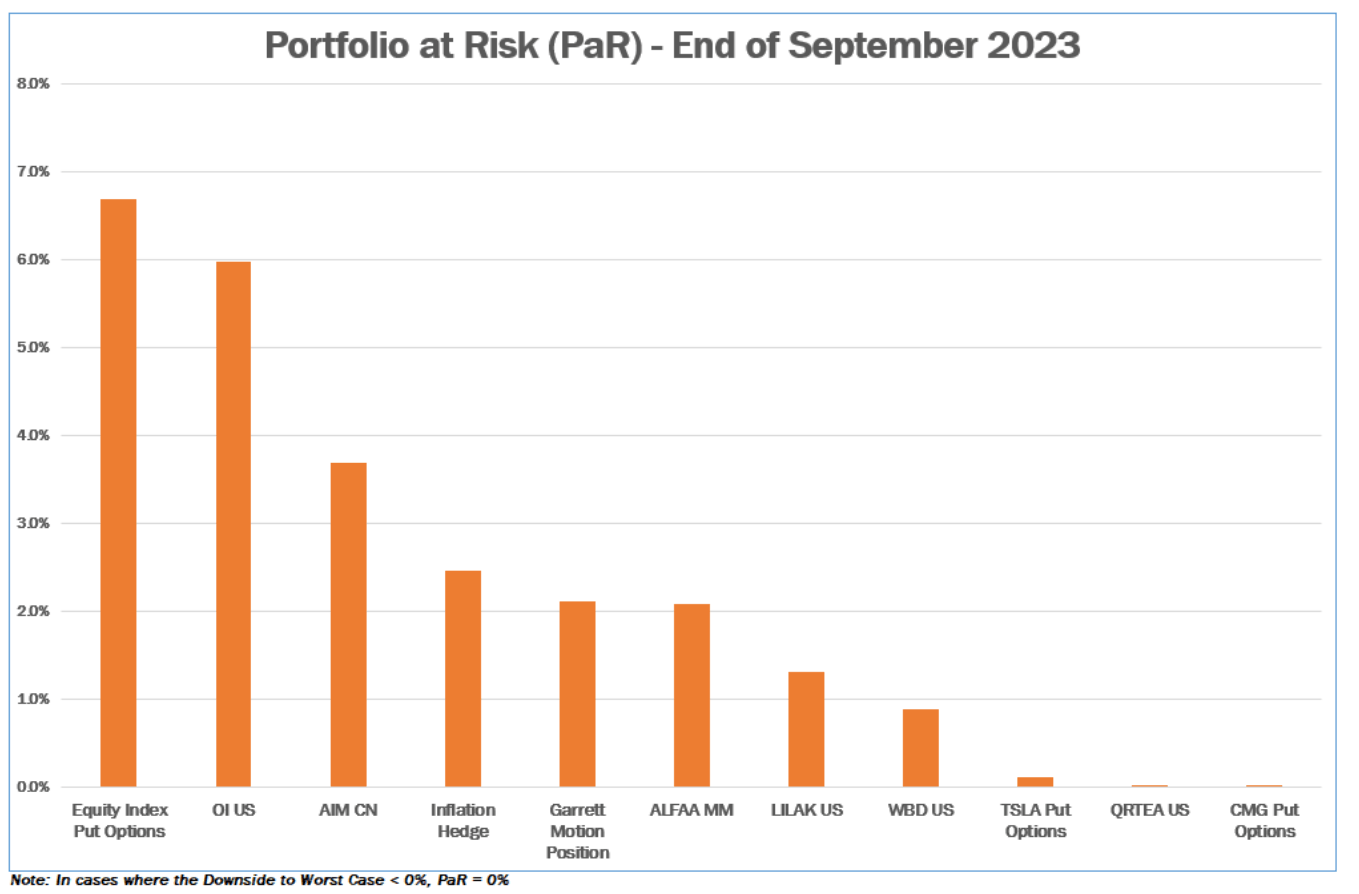
Portfolio at Risk ((PAR))
I estimate the Portfolio at Risk ((APR)) of each position by multiplying the weight of each position in the portfolio by the percent downside from the current price to the Worst Case estimate of intrinsic value. This helps me manage the risk of permanent capital loss and size positions appropriately, so that no single security can cause such a material permanent capital loss that the rest of the portfolio, at reasonable rates of return, would not be able to overcome. I typically size positions at purchase to have PaR levels of 5% or lower, and a PaR value of 10% or more at any time would be a red flag. The chart below depicts the PaR values for the securities in the portfolio as of the end of the quarter. Positions are presented including options when applicable.
Normalized Price-to-Earnings (P/E) Ratio
I supplement my intrinsic value estimates, which are based on Discounted Cash Flow ((DCF)) analysis, with a number of other metrics that I use to make sure that my value estimates make sense. One of the more useful ones is the Normalized P/E ratio. The denominator is my estimate of earnings over the next 12 months, adjusted for any one-time/unsustainable factors, and if necessary adjusted for the cyclical nature of the business to reflect a mid-cycle economic environment. The numerator is adjusted for any excess assets (e.g. excess cash) not used to generate my estimate of normalized earnings. One way to interpret this number is that its inverse represents the rate of return we would receive on our purchase price if earnings remained permanently flat. So a normalized P/E of 10x would be consistent with an expectation of a 10% return. While the future is uncertain, it is typically my goal to invest in businesses whose value is increasing over time. If I am correct in my analysis, our return should exceed the inverse of the normalized P/E ratio over a long period of time. The graph below represents the weighted average normalized P/E for the equities in the portfolio.
Conclusion
Please send me any questions that you have in advance of the Annual Partnership Meeting or ask them during the meeting. I want to give you as much transparency as possible into how I am deploying our capital.
I greatly value the trust that you have placed in me to manage your capital. While the results of the last couple of years have been far short of my and your expectations, I have full confidence in the process and believe that over time the long-term results will reflect the quality of the investment decisions.
One of the things that makes investing challenging is that every investor goes through periods of underperformance. Those investors on whom clients heap additional pressure through short-term thinking and behavior have lower odds of long-term success. I appreciate your long-term orientation and focus on process and hope to see many of you at the meeting to share my current thinking on the portfolio, the process, and the investing environment.
Sincerely,
Gary Mishuris, CFA, Managing Partner, Chief Investment Officer
| IMPORTANT DISCLOSURE AND DISCLAIMERS The information contained herein is confidential and is intended solely for the person to whom it has been delivered. It is not to be reproduced, used, distributed or disclosed, in whole or in part, to third parties without the prior written consent of Silver Ring Value Partners Limited Partnership (“SRVP”). The information contained herein is provided solely for informational and discussion purposes only and is not, and may not be relied on in any manner as legal, tax or investment advice or as an offer to sell or a solicitation of an offer to buy an interest in any fund or vehicle managed or advised by SRVP or its affiliates. The information contained herein is not investment advice or a recommendation to buy or sell any specific security. The views expressed herein are the opinions and projections of SRVP as of October 30 th , 2023, and are subject to change based on market and other conditions. SRVP does not represent that any opinion or projection will be realized. The information presented herein, including, but not limited to, SRVP’s investment views, returns or performance, investment strategies, market opportunity, portfolio construction, expectations and positions may involve SRVP’s views, estimates, assumptions, facts and information from other sources that are believed to be accurate and reliable as of the date this information is presented—any of which may change without notice. SRVP has no obligation (express or implied) to update any or all of the information contained herein or to advise you of any changes; nor does SRVP make any express or implied warranties or representations as to the completeness or accuracy or accept responsibility for errors. The information presented is for illustrative purposes only and does not constitute an exhaustive explanation of the investment process, investment strategies or risk management. The analyses and conclusions of SRVP contained in this information include certain statements, assumptions, estimates and projections that reflect various assumptions by SRVP and anticipated results that are inherently subject to significant economic, competitive, and other uncertainties and contingencies and have been included solely for illustrative purposes As with any investment strategy, there is potential for profit as well as the possibility of loss. SRVP does not guarantee any minimum level of investment performance or the success of any portfolio or investment strategy. All investments involve risk and investment recommendations will not always be profitable. Past performance is no guarantee of future results. Investment returns and principal values of an investment will fluctuate so that an investor's investment may be worth more or less than its original value. |
Editor's Note: The summary bullets for this article were chosen by Seeking Alpha editors.
For further details see:
Silver Ring Value Partners Q3 2023 Letter