SBOW - SilverBow Resources: Growing Production Aggressively In The Eagle Ford
2023-11-02 03:51:29 ET
Summary
- SilverBow Resources is an Eagle Ford Shale pureplay with a market capitalization of just under $1 billion.
- The company is focused on the Eagle Ford Shale play in South Texas and has seen significant gains in oil production growth.
- A study of the company's financials demonstrates that the company is generating profitable production growth in the Eagle Ford Shale.
- Q3 Results just came out, and the company reported continued strong growth in results.
SilverBow Resources (SBOW) is an Eagle Ford Shale pureplay with a market capitalization of just under $1 billion. The company is headquartered in Houston, Texas and is a company, formerly known as Swift Energy, that came out of bankruptcy and renamed itself SilverBow Resources in the middle of 2017.
Swift Energy had been led for 35 years by Aubrey Swift and his son Terry Swift, who had been CEO for 15 years before the restructuring due to bankruptcy.
Today, Swift Energy is on a path of aggressive growth both through strong results from the drill bit, as well as through acquisitions. Due to the company's manageable size while achieving strong results from the Eagle Ford, I am rating the company a buy. Furthermore, their Q3 Results which were reported today, (11/1) further confirm their strong growth trajectory.
Operations
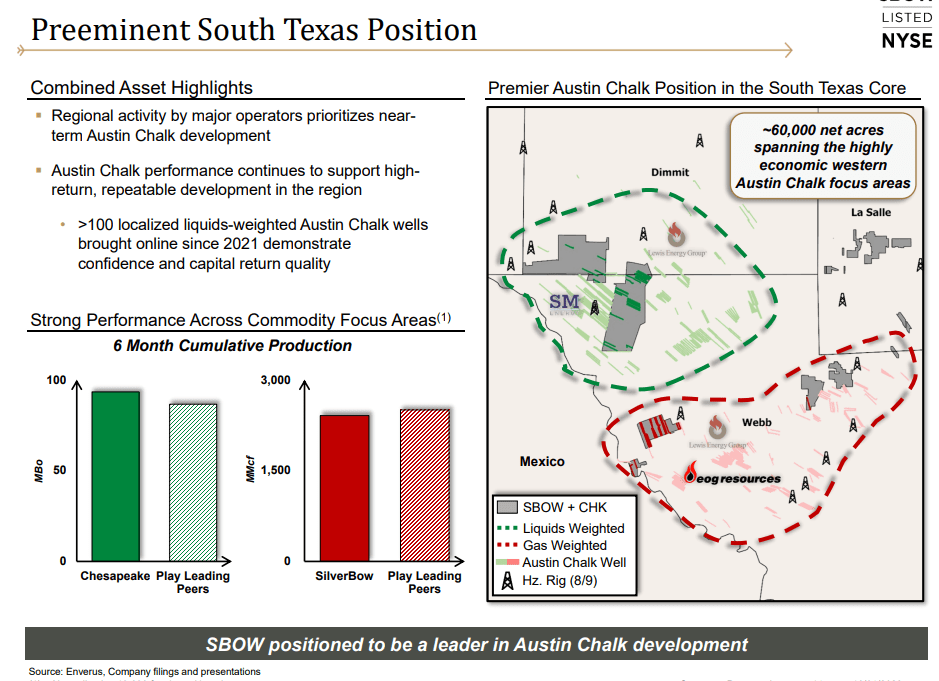
The company is purely focused in South Texas on the Eagle Ford Shale and the Austin Chalk formations. Prior to its bankruptcy in 2016, it had assets in Louisiana as well, but sold those to focus purely on the Eagle Ford when it came out of bankruptcy.
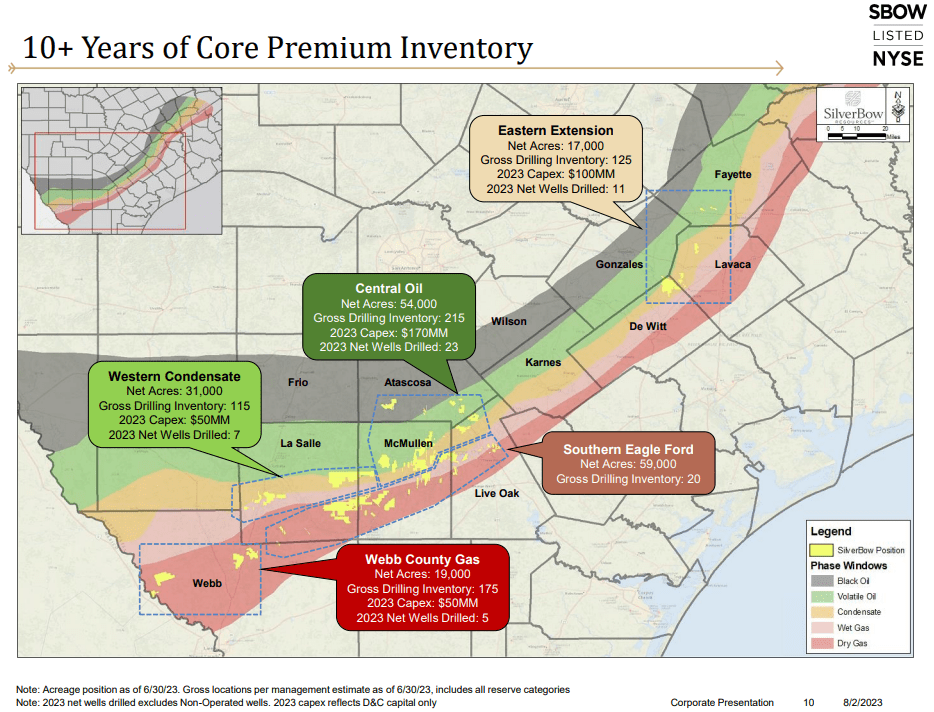
The yellow in the map highlights where the company's leases are located. The company has 180,000 net acres and has an average of an 89 percent working interest in each of their drilling locations.
One of the interesting things about the Eagle Ford, is that depending on where you are located in the play, some wells will produce 100 percent dry gas, and others will produce 80 to 90 percent liquids. SilverBow Resources is diversified throughout the play and you can see below where they are located in relation to the types of wells being drilled.
Current SilverBow Acreage (SilverBow Q2 Presentation)
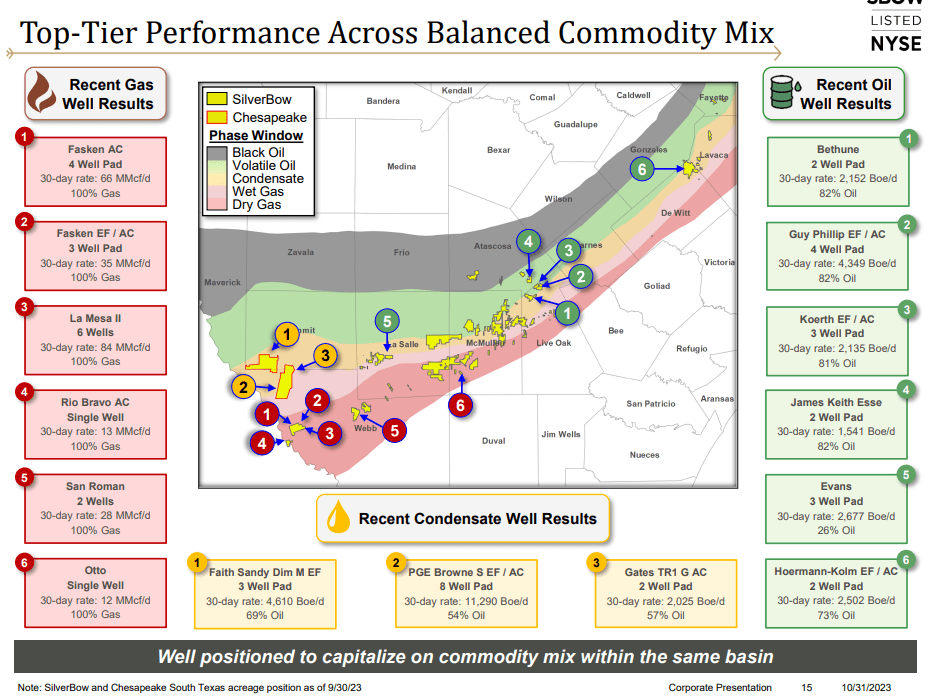
Here are some recent well results from the Q3 Presentation. These are some very good well results from both the oil side(green) and the dry gas(red). And in yellow, it shows well results from their acquisition from Chesapeake which exhibit some monster wells.
The Eagle Ford Play
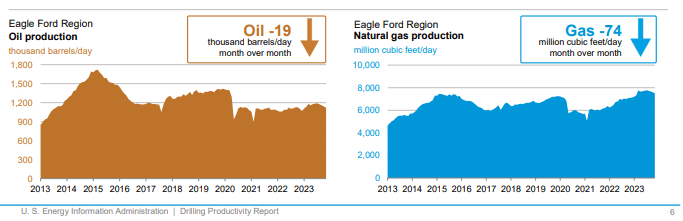
The Eagle Ford Play has not experienced growing oil production as some other plays have, such as the Permian. However, since the oil price decline in 2020, production has slightly risen from the play. Gas production has also increased slowly.
Eagle Ford Oil and Natural Gas Production Charts (EIA Energy Information Administration)
Here is a statement from the EIA on oil production and prices in the Eagle Ford play. For reference, during the first half of 2022, the price of oil increased to between $100 and $120 per barrel.
Because [oil]prices increased, we estimate that economically recoverable oil resources in the Eagle Ford formation, increased to 8.4 billion barrels in the first half of 2022, an increase from .5 billion barrels in 2020. Between 2020 and the first half of 2022, crude oil prices more than doubled...incentivizing future development in previously marginal areas.
The Eagle Ford, due to its higher oil/liquids driven well results has also seen a substantial increase in natural gas production. Between 2021 and 2022, the Eagle Ford saw the third largest increase in natural gas production. When we see this chart below, this should tell us something about the various plays found throughout the United States. To me, this points to the fact that the Permian Basin is the most profitable play in the United States.
Second, it tells me that the Haynesville is the most profitable gas shale play in the United States. The Haynesville has very little liquids productions and so with it being a purely natural gas shale, it is where natural gas producers like Southwestern Energy ( SWN ) and Chesapeake Energy ( CHK ) are focusing some of their capital.
And finally, this chart demonstrates that the Eagle Ford, a hybrid play of liquids and natural gas, is potentially the second most profitable liquids play as it has experienced a more substantial increase in natural gas production than the Bakken Shale.
This is speculation based on this chart so here's how I would explain this interpretation. I interpret it that way due to the fact that liquids(oil and natural gas liquids) are more profitable than pure natural gas. This is something I explain in this article about Southwestern Energy . Therefore, if gas production is increasing relatively faster in the Permian Basin and the Eagle Ford, it is presumably thanks to various companies deploying capital here to increase liquids production while also receiving natural gas production as a byproduct. That said, as I already mentioned, the Eagle Ford also has a dry gas zone which companies, including SilverBow, are finding profitable.
Percent Change In Natural Gas Production (EIA Energy Information Administration)
Strategic Acquisition
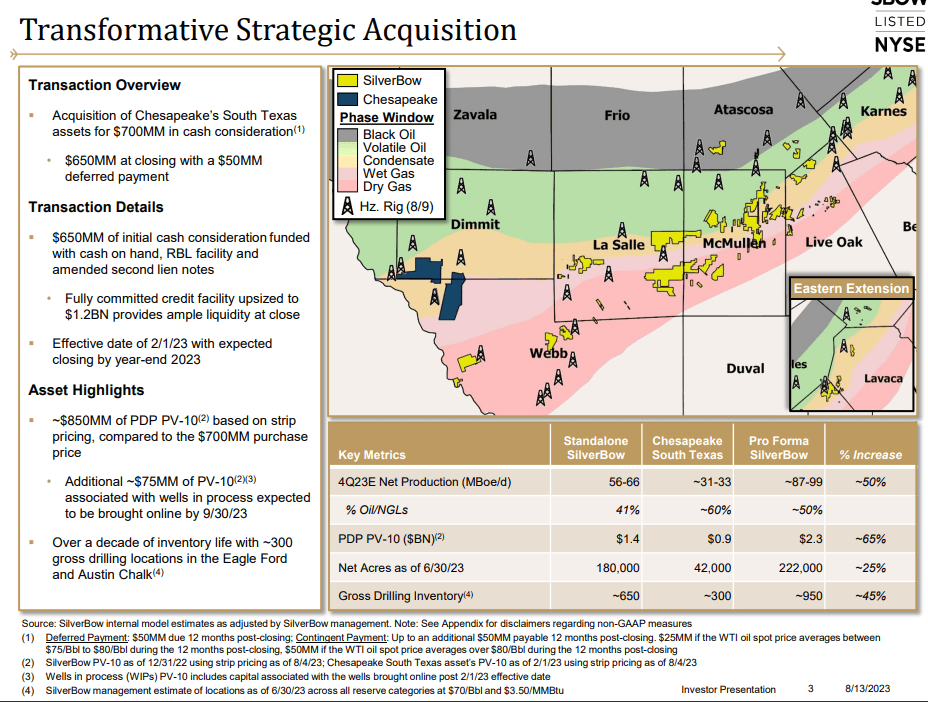
The company recently announced an acquisition from Chesapeake Energy in August. The company says the acquisition should close in the fourth quarter of 2023. The acquisition adds another 42,000 net acres to the company's 180,000 net acres currently. It also adds roughly 30,000 of barrels of oil equivalent production per day.
The company purchased the tracts from Chesapeake such that if the company doesn't drill another well, the acquisition has a Present Value with a discount rate of 10 percent(PV-10) of $850 million which is greater than the $700 million purchase price. The company believes there are over 300 new drilling locations on the property that currently has a production mix that is 60 percent liquids. This should make this acquisition highly accretive to shareholders.
Chesapeake Acquisition (Acquisition Presentation)
Here, the company highlights that their acquisition is neighbors to one of the premier operators, EOG Resources ( EOG ). Furthermore, their acreage is more liquids heavy and so it should create an investment that dependably provides returns on capital invested.
Balance Sheet
The company has a decent balance sheet, however, given that they declared bankruptcy in 2016, it is important that they continue to remain disciplined. At the company's current valuation, they are trading very near their balance sheet's book value of the company. It will be up to the company to execute on each of its acquisitions so that increasing cash flows from increasing production force the market to value it above the book value of its many recent acquisitions.
| 2018 |
| 2019 |
| 2020 |
| 2021 |
| 2022 |
| Q3 2023 |
| Assets |
| 777.5 |
| 959.8 |
| 583.1 |
| 819.5 |
| 1,716.4 |
| 1,930 |
| Debt |
| 502.7 |
| 564.1 |
| 492.1 |
| 526.9 |
| 924.8 |
| 925.9 |
| Debt to Asset Ratio |
| .64 |
| .59 |
| .84 |
| .64 |
| .54 |
| .48 |
The company has financed some of its growth with the addition of new shares. In 2022, the company made several acquisitions where they were partly completed by issuing shares. Similar to the Chesapeake acquisition in August, I am not concerned with share dilution if it adds accretive growth to shareholders.
Shares Outstanding
| 2018 |
| 2019 |
| 2020 |
| 2021 |
| 2022 |
| Q3 2023 |
| Shares Outstanding |
| 11.7 |
| 11.8 |
| 11.9 |
| 13.1 |
| 19.7 |
| 25.4 |
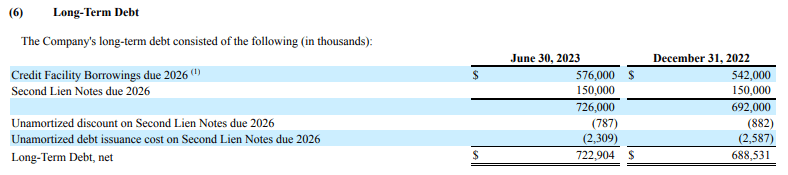
Here's a detailed look at what makes up the company's long-term debt.
Long Term Debt (Q2 SilverBow Long-term Debt)
Cash Flow Statement
Currently, the company is growing ambitiously and is outspending their operating cash flows. However, they are seeing significant gains in their oil production growth. When a company begins outspending their cash flows as we can see below, it is usually because they believe the rates of return they are earning justify the overspending and that they can still maintain their balance sheet accordingly. Of course, this is a game where eventually it makes more sense to reduce balance sheet leverage once the company growth reaches a certain point. This is currently happening with SilverBow Resources.
| 2018 |
| 2019 |
| 2020 |
| 2021 |
| 2022 |
| Trailing 9mo Q3 2023 |
| Cash Flow From Operations |
| 121.6 |
| 203.2 |
| 165.2 |
| 215.7 |
| 331.2 |
| 318.4 |
| CapEx |
| (267.5) |
| (282.7) |
| (119.3) |
| (185.4) |
| (639.5) |
| (316) |
| Free Cash Flow |
| (146) |
| (79) |
| 46 |
| 30 |
| (308) |
| 2 |
YoY & QoQ Production Growth
These are production numbers taken from their most recent quarterly results for Q3 and shows significant growth QoQ and YoY. As you can see below, the company is aggressively growing their oil production year over year. Notice that their oil production has more than doubled. This is somewhat misleading as not all of this production growth has come organically through capex via the drill bit. Some of it has come by way of acquisition. As I showed above, some of this production was diluted by the addition of new shares outstanding. However, this is still what I like to see in the company's results: strong production growth.
| Q2 2022 |
| Q2 2023 |
| Q3 2023 |
| Oil(MBbl) |
| 400 |
| 1,137 |
| 1,379 |
| Natural Gas(Mmcf) |
| 16,918 |
| 19,124 |
| 19,620 |
| Natural Gas Liquids(MBbl) |
| 387 |
| 677 |
| 714 |
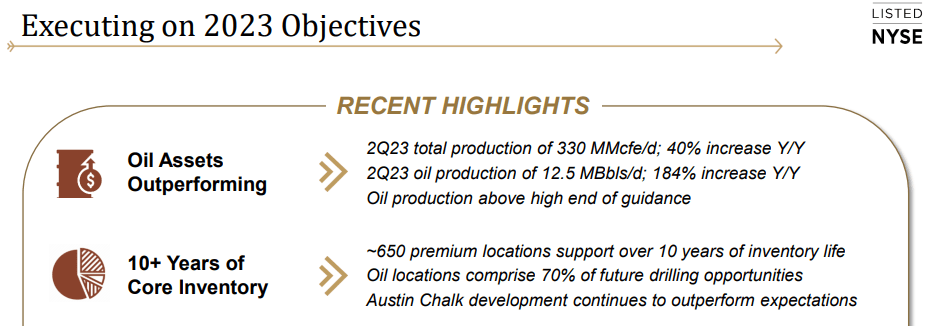
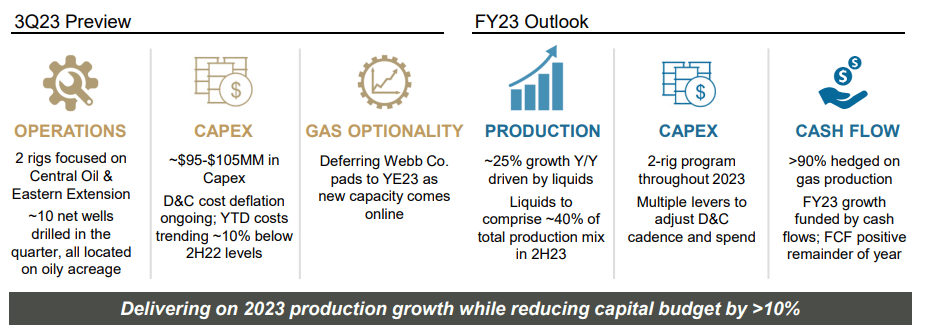
Here are just a couple excerpts from their Q2 presentation that highlights the fact that they are meeting or exceeding their expectations for oil production growth. As I share Q3 results below, the story remains the same.
Oil Production 2023 (Q2 SilverBow Presentation) Q3 Preview (Q2 SilverBow Presentation)
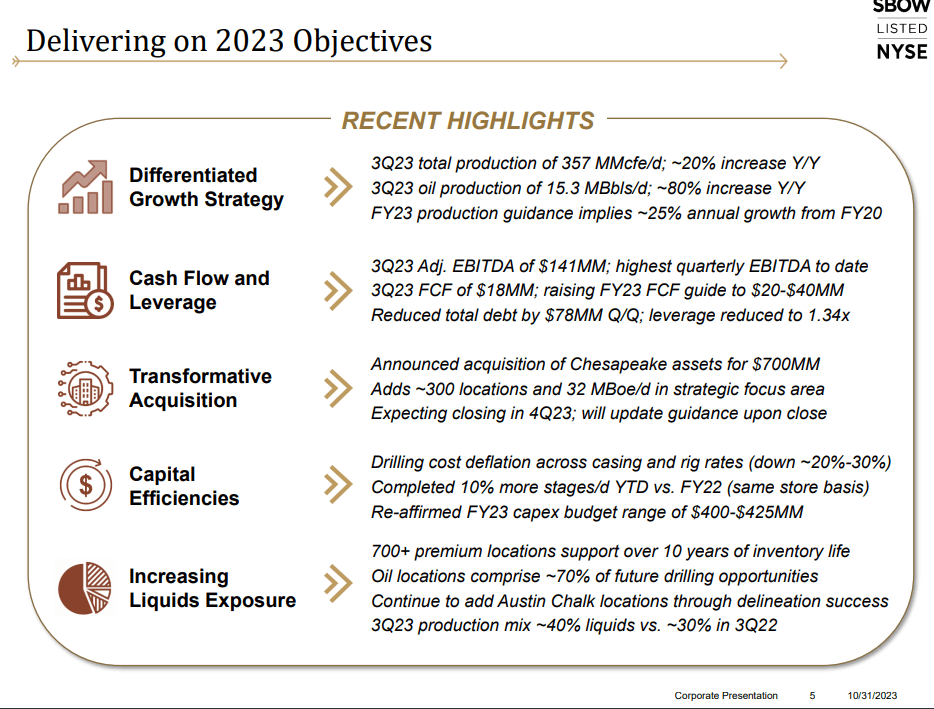
Q3 Results
The company's Q3 Results came in today and as I've share above, they grew production significantly this quarter. They expect Q4 to see another significant jump in production. Oil volumes are expected to increase by roughly 1,000 to 1,500 barrels per day.
Its Q3 resulted in the highest EBITDA that the company has ever had. Based on the results, they raised the company's FCF estimates for the year to $20 to $40 million.
As the company grows they continue to focus on cost-efficiencies and this is what they've done in Q3 seeing improvements in casing costs, and drilling rig rates. All-in-all, the company had a strong third quarter.
Risks
The largest risk to SilverBow is commodity price risk. Their current production growth has them on a trajectory that if it continues, they should see growth in their share price. If commodity prices weaken, the company's growth trajectory will slow. This is always the primary risk with oil and gas exploration companies. However, over the long-term, I believe the macro-environment is bullish for oil prices .
Execution is also a risk for SilverBow if they deploy capital without getting a sufficient return. With the company's balance sheet roughly just under 50 percent debt-to-asset ratio, repeated poor well results can cause debts to rise. However, during the shale revolution, this has become less of a concern. Although horizontal wells are more capital intensive, they have a high probability of providing a successful return on capital. And as you can see from their recent well results, the team at SilverBow has created a repeatable formula that produces results. They are executing on their goals.
Conclusion
SilverBow Resources is a buy. Despite experiencing default in 2016 as Swift Energy, the company has since had a laser-like focus on the Eagle Ford Shale and grown the company ambitiously through the drill bit and through acquisitions. Although I rate the company a buy, I do think they are pretty fairly valued relative to other smaller oil and gas companies.
For example, Permian Resources ( PR ) produced 84 thousand barrels of oil per day in Q2 2023 whereas SilverBow produced roughly 12.5 thousand barrels of oil per day. In Q3, SilverBow produced 15.3 thousand barrels per day. This is a back of the napkin comparison but this means Permian Resources is valued at 7 to 8 times SilverBow Resources and produces 7 times as much oil. The companies are valued very comparatively. This is a quick snapshot without considering each company's natural gas and natural gas liquids production.
Investors might be concerned that the only reason SilverBow is growing is because they are issuing new shares to acquire new production. A quick glance at their production growth relative to the increase in the shares outstanding demonstrates that their production growth is outpacing their growth in shares outstanding. And then, cross-referencing that with their balance sheet asset-to-debt ratio demonstrates that their production growth is happening profitably as they are able to reduce their debt at the same time. This summarizes my view of SilverBow and why I believe it represents a good long-term buy. If your portfolio needs exposure to the Eagle Ford play, then SilverBow might be a good option.
For further details see:
SilverBow Resources: Growing Production Aggressively In The Eagle Ford