SSD - Simpson Manufacturing Co.: Head And Shoulders Above The Rest
2023-04-17 11:47:35 ET
Summary
- Simpson Manufacturing has built an excellent competitive moat around its business.
- It enjoys superior market share and margins.
- The company is fully valued and should be bought on weakness.
Simpson Manufacturing Co. ( SSD ) enjoys a dominant market position within its industry and continues to enjoy superior margins compared to its peers in the building products industry. The stock had a good run over the past six months and may be fully valued, limiting its upside. Investors should consider buying Simpson Manufacturing when the stock has a market-induced weakness.
Expect a weak start to 2023
Simpson Manufacturing recorded over $2 billion in revenues for the first time in 2022. Some of its revenue growth in 2022 came from acquiring ETANCO , a fixing and fastening solution manufacturer for the European building construction market, for approximately $800 million. The company's North American business performed exceedingly well , with its sales increasing by 24.8% in 2022 compared to the previous year. Price increases in 2022 bolstered profit margins. However, the company stated that it is implementing price decreases in some of its wood products in 2023, potentially leading to lower revenues and margin compression.
Simpson Manufacturing Co. Inc. has best-in-class gross and operating margins. The company achieved a gross margin of 42.4%, the best among a group of building product companies (Exhibit 1) . Its operating margin of 17.3% was only bested by Advanced Drainage Systems (WMS), which achieved an operating margin of 18.9% (Exhibit 2) .
Exhibit 1:
Quarterly Gross Margin (%) for Building Products Companies for Quarter-Ending December 2022 (Seeking Alpha, Author Compilation)
Exhibit 2:
Quarterly Operating Margins for Building Products Companies Quarter-Ending December 2022 (Seeking Alpha, Author Compilation)
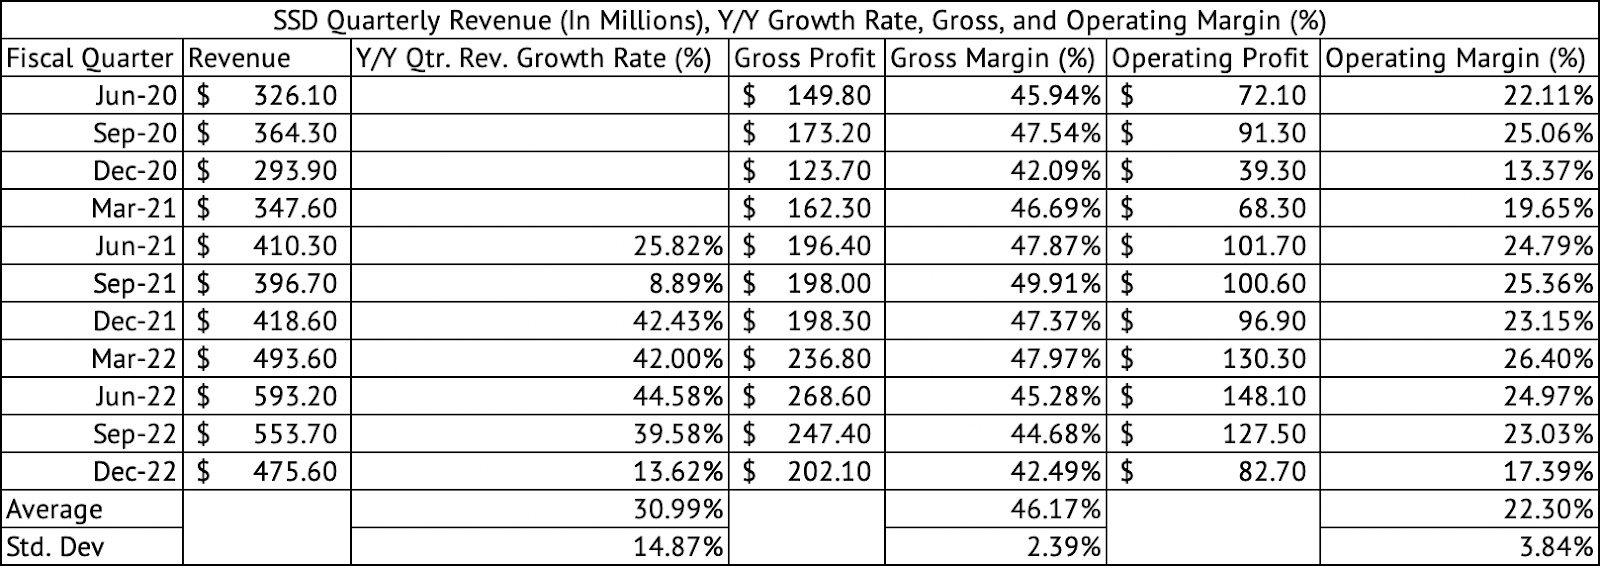
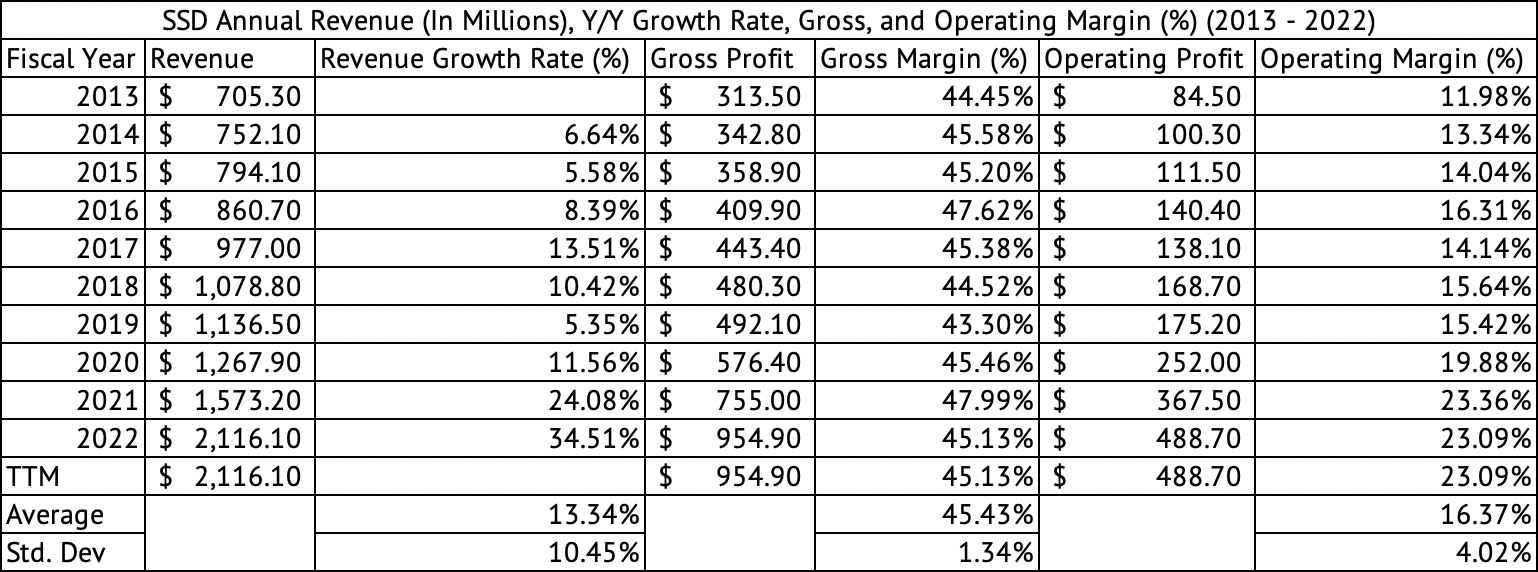
The December 2022 quarterly margins are substantially lower than their average, showing the effects of inflation and a decrease in volumes due to a severe slowdown in the construction market. The company has averaged a quarterly gross margin of 46.1% and an operating margin of 22.3% since June 2020 (Exhibit 3) . The December 2022 quarterly margins were also well below its average annual gross and operating margin over the past decade of 45.1% and 23%, respectively (Exhibit 4) .
Exhibit 3:
Simpson Manufacturing Co Quarterly Revenue, Gross, Operating Profit, and Margins (%) (Seeking Alpha, Author Compilation)
Exhibit 4:
Simpson Manufacturing Co. Annual Revenue, Gross, Operating Profit, and Margins (%) (Seeking Alpha, Author Compilation)
The company’s average gross margins of 45.4% over the past decade had a low standard deviation of 1.3% (Exhibit 4) . But, the past decade was marked by low interest rates, which may have shielded building products companies from realizing much lower margins.
Investors may have to pay close attention to the margins in Q1 2023 when the company releases earnings on April 24. The quarterly gross margin of 42.4% is among the lowest the company has achieved, so the annual margin for 2023 may come in at its December 2022 level or lower. Much may depend on mortgage rates in 2023, and if it goes lower, there could be a boom in the construction market, leading to increased revenues and profits for Simpson Manufacturing.
Building products companies are heading into a crucial earnings season in April and May, during which they will discuss their Q1 2023 earnings. The market expects revenues and profits to drop this quarter, but the extent of the drop and the tone of the commentary may set the stage for this industry for the rest of the year. Lower demand coupled with normalized supply chains has reduced inflation for these companies. This low inflation rate should lower the cost of raw materials and freight costs, thus reducing their working capital requirements. Gross margins should improve in 2023 as these companies sell their high-cost inventory.
The management’s commentary around margins would be important, with the expectation that margins have bottomed in the December 2022 quarter and should be on an upswing in 2023, especially in the second half. But, much of the potential margin improvement may depend on demand. If demand continues to deteriorate, these companies may be in for much more pain on the margin front. Investors should also pay close attention to sales volumes to assess the strength in demand. Sales volumes are expected to decline, but the rate of decline in the first half of 2023 may set the stage for revenues and margins for the entire fiscal year.
Inventory is in line with its average over the past decade
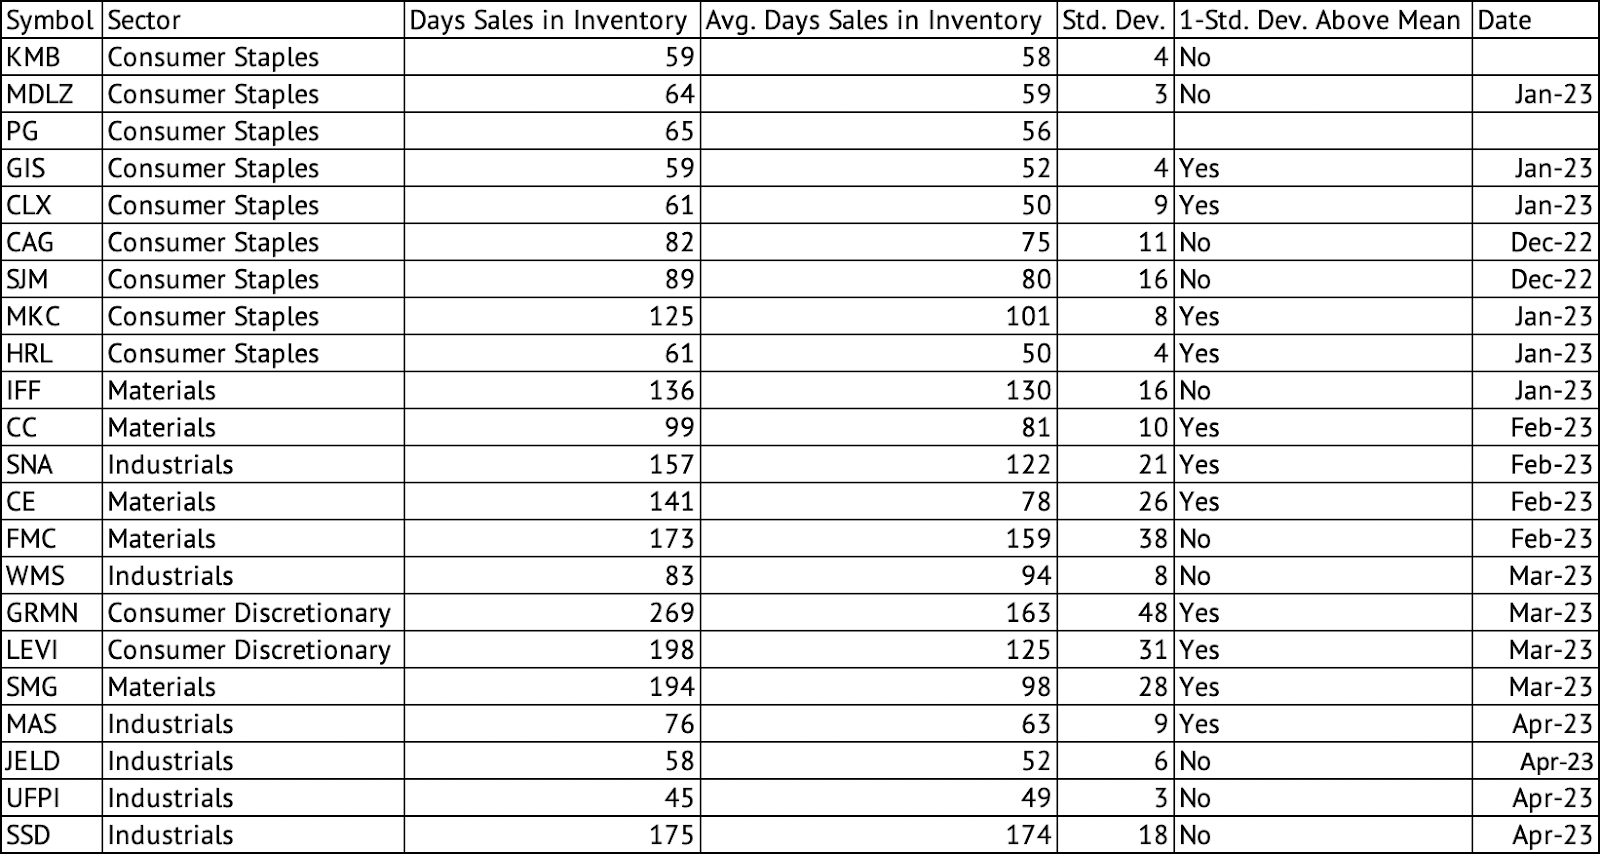
The company carried 175 days of inventory compared to its average of 174 and a standard deviation of 18 over the past decade (Exhibit 5) . The company carries a high inventory level even when compared across companies in various sectors (Exhibit 6) . Although the inventory cost is high, inflationary cost increases may have been the primary driver behind it rather than any increases in the number of units.
Exhibit 5:
Simpson Manufacturing Days' Sales in Inventory (2013 - 2022) (Seeking Alpha, Author Calculations)
Exhibit 6:
Days' Sales in Inventory Across Consumer Staples, Materials, and Industrials Sectors (Seeking Alpha, Author Calculations)
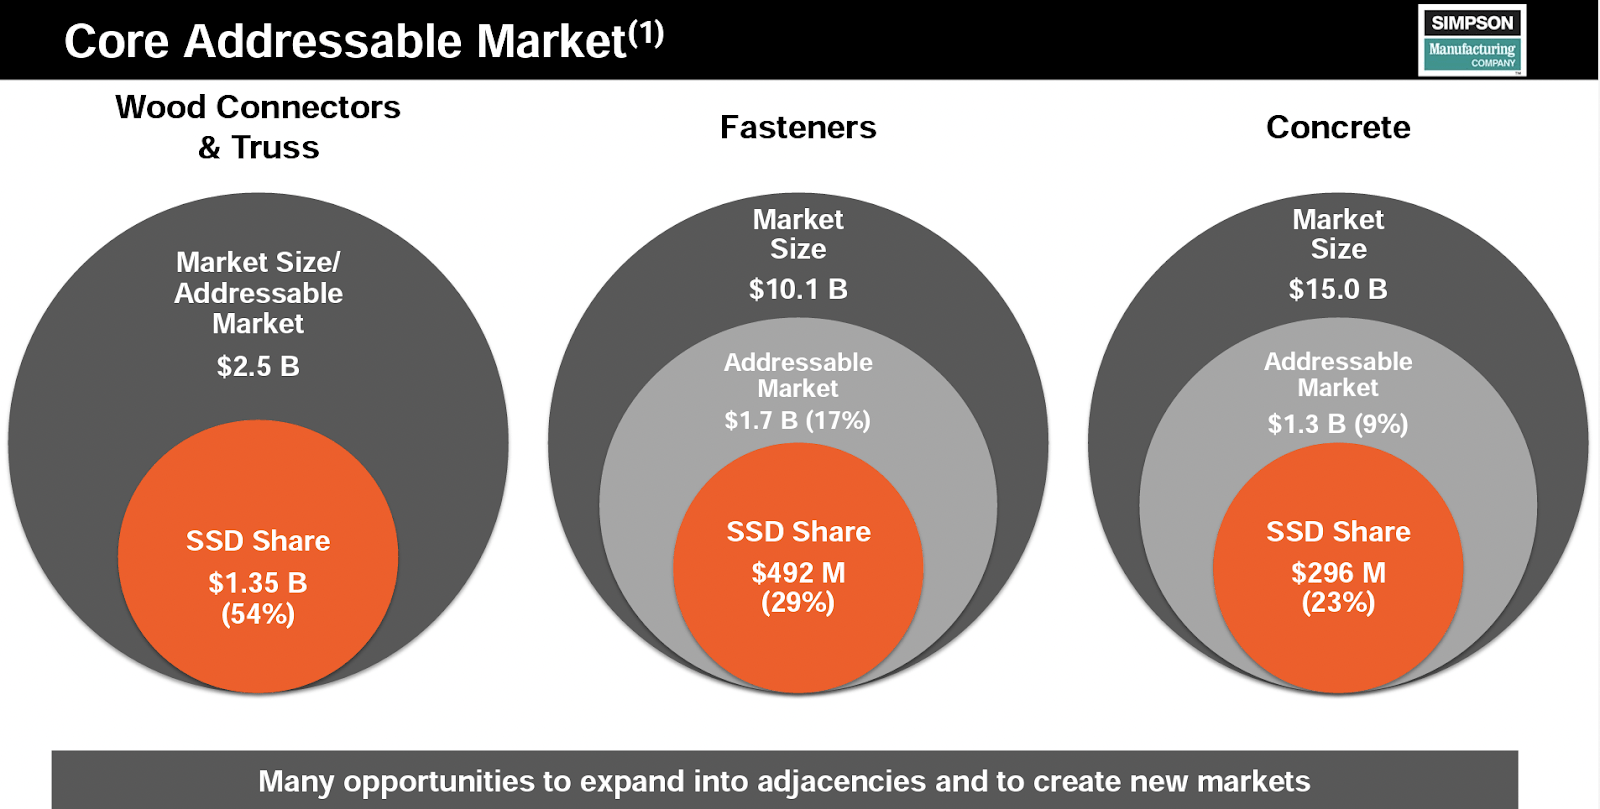
Given the company’s working capital requirements to carry these high inventory levels, it is remarkable that it has such good margins. These leading margins may be due to the company’s dominant market position and pricing power. The company has the majority share of the Wood Connector and Truss market with a 54% share (Exhibit 7) . It has cornered 29% and 23% of the Fasteners and Concrete markets.
Exhibit 7:
Simpson Manufacturing Market Share & Total Addressable Market (Simpson Manufacturing Investor Presentation)
The company makes engineered products, rather than a construction commodity, and considerable intellectual property, computed aided design, and testing that goes into each product. The company has also built a moat around its business with its patents. These engineering and design elements and their patents contribute to its pricing power and margin domination. The company also noted that its sales volumes grew above housing starts , potentially another sign of its expanding market share.
Excellent cash flow margins
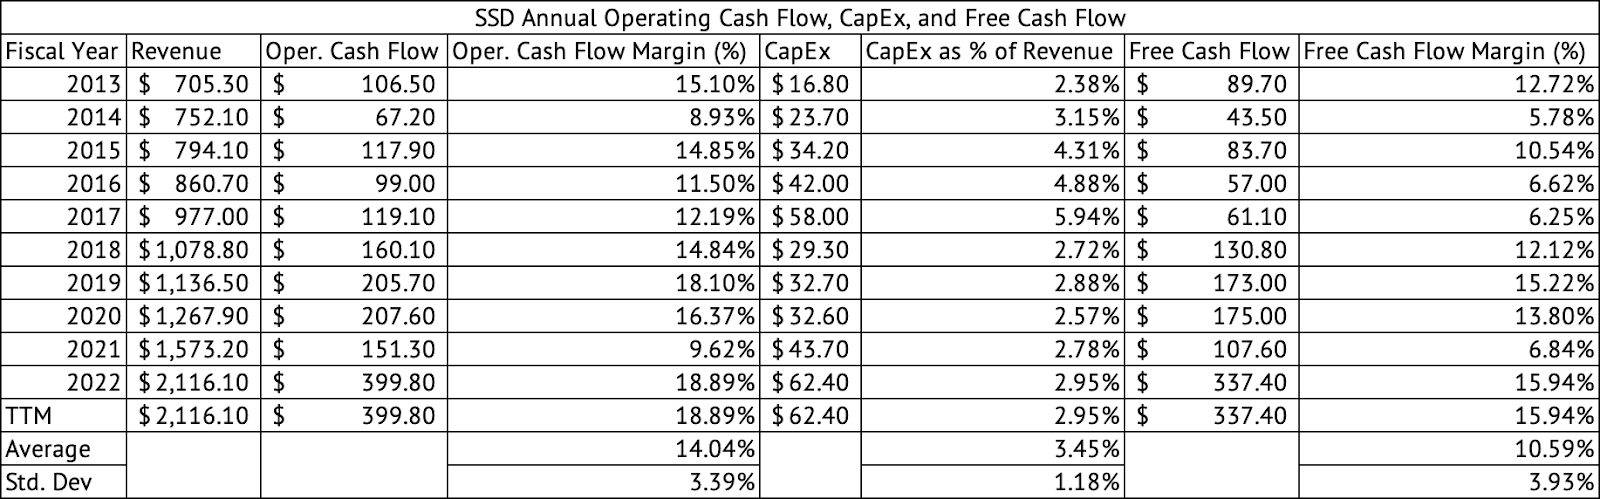
The company generated superior cash flow margins in 2022, with an operating cash flow margin of 18.89% 2022 compared to its average of 14% over the past decade. The company’s CapEx came in at 2.95% of revenue compared to its average of 3.4% over the past decade. These 50 basis points help bolster its free cash flow margins, which set a record in 2022 at 15.9%. Its average free cash flow margin was 10.5% over the past decade. The company’s cash flow margins were 22.5% and 28.6% in Q3 and Q4 of 2023, respectively. These are strong operating cash flow margins.
Exhibit 8:
Simpson Manufacturing Operating Cash Flow, Free Cash Flow, and Free Cash Flow Margin (%) (2013 -2022) (Seeking Alpha, Author Compilation)
Some of the strengths in its operating cash flow margins in the third and the fourth quarter are related to seasonality. The company saw lower receivables in Q3 and Q4 2022 which helped bolster operating cash flows. Accounts receivables increased the cash flows in Q3 and Q4 2022 to $108.4 million. In the March and June quarter, the peak construction season, the company has bills to be collected for the product it has supplied, thus seeing an increase in receivables and lower operating cash flows.
The stock is fully valued
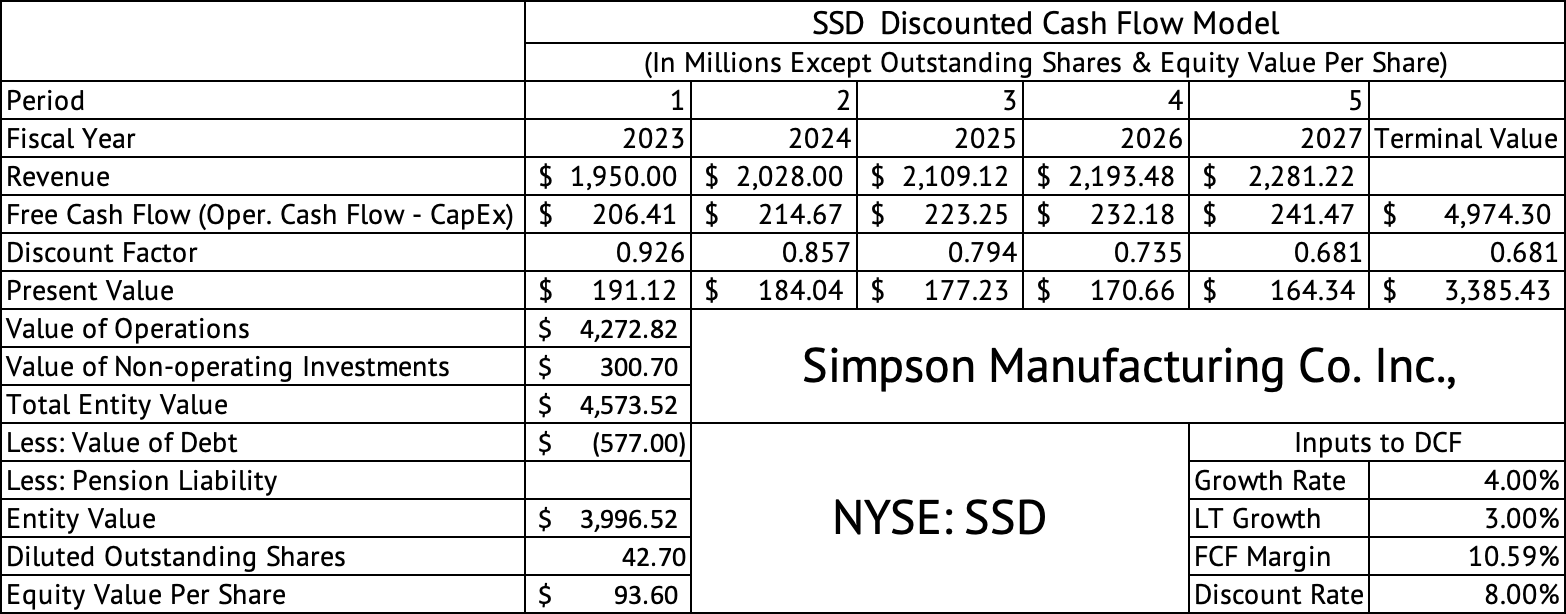
The stock may have little upside left, given its forward GAAP PE of 17.4x. The company may be overvalued based on a PEG ratio of 1.1x, given the slow growth prospects in 2023. A discounted cash flow model estimates the per-share equity value of $93.60 (Exhibit 9) .
Exhibit 9:
Simpson Manufacturing Discounted Cash Flow Model (Seeking Alpha, Author Calculations)
This model uses the consensus revenue estimate of $1.95 billion for 2023 as the starting point for future projections. This model assumes a 4% revenue growth rate until 2027 and 3% after that year for the terminal value calculation. The Free cash flow margin of 10.5% is the company’s average over the past decade. This model uses a liberal discount rate of 8%. The company has a low debt with a debt-to-EBITDA ratio of 0.58x, so its weighted average cost of capital may be low compared to other companies with much higher debt levels. Still, 8% may be low-end for the company’s cost of capital given the risk-free US 10-year Treasury bond yield of 3.5% ( US10Y ).
The company generates a good return on invested capital, which is above its weighted average cost of capital. Based on my calculation, the company’s return on invested capital was 18.19%, which considers goodwill part of intangibles (Exhibit 10) . A tax rate assumption of 21.8% is used in this calculation, which may be low. A 25% tax rate would bring the ROIC to 17.4%. The company expects its tax rate to be between 25% and 26% in 2023.
Exhibit 10:
Simpson Manufacturing Return on Invested Capital (Seeking Alpha, Author Calculations)
YCharts yields a ROIC of 21% (Exhibit 11) , which uses the following formula to calculate this metric:
Net Income / (Current and Non-Current Portion of Debt + Shareholders Equity + Minority Interests)
Exhibit 11:
Simpson Manufacturing Debt-to-EBITDA Ratio and Return on Invested Capital (Seeking Alpha)
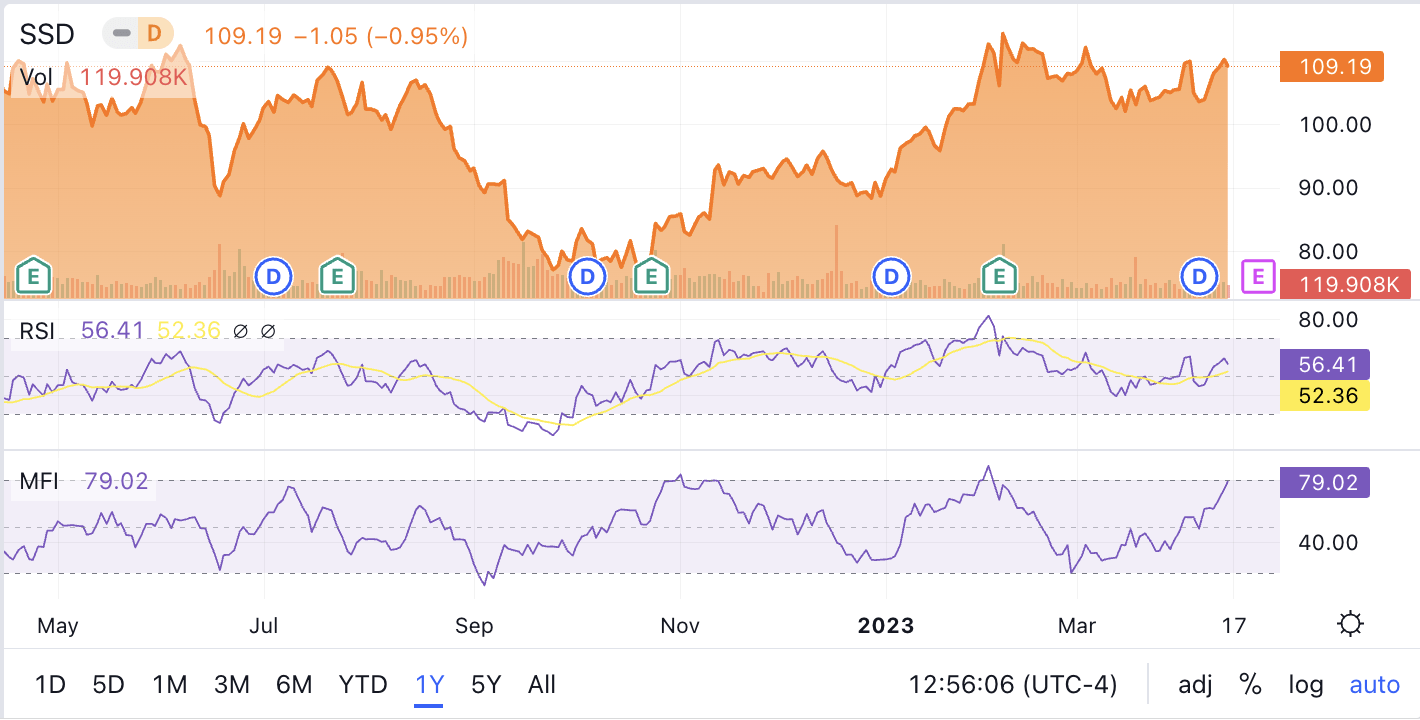
The company has benefitted from superior momentum in its stock over the past six months, increasing by 41%. The sector median over that same period was 14.6%. The stock has gained over 9.6% over the past three months compared to the sector’s median loss of 3.5%. The stock’s valuation, six-month solid momentum, and high RSI and MFI values indicate that the stock’s impressive run may be over. The stock's MFI technical indicator is at overbought levels, and the RSI indicator may have peaked and trended down (Exhibit 12) . But, investors should consider buying the stock on weakness, given the company’s good competitive position and long-term prospects.
Exhibit 12:
Simpson Manufacturing RSI and MFI Technical Indicators (Seeking Alpha)
Simpson Manufacturing has positioned itself as a market leader with a competitive moat and enjoys superior margins compared to others in the building products industry. The company carries low debt and enjoys excellent cash flow margins. But, it is fully valued based on the valuation metrics and a discounted cash flow model. Investors should buy the stock on any weakness.
For further details see:
Simpson Manufacturing Co.: Head And Shoulders Above The Rest