SSD - Simpson Manufacturing: Not Enough Margin Of Safety For This 'Wonderful' Company
2023-12-14 03:16:58 ET
Summary
- Simpson Manufacturing is a fundamentally sound company with improving returns resulting from both revenue growth and improving efficiencies. It is also financially sound.
- Growth was due to organic growth and acquisitions. Acquisitions accounted for a bigger part. This was from a high reinvestment rate that has to be reduced to a fundamental rate.
- Despite being a "wonderful" company, there is not enough margin of safety based on valuing SSD using a 2-stage growth model.
Investment Thesis
Simpson Manufacturing Co., Inc. ( SSD ) is a fundamentally sound company. Over the past 12 years, it has been able to improve its returns. Apart from growing revenue, there were improving operating efficiencies.
The company achieved growth mainly through acquisitions. I would expect this strategy to continue. The company is also financially sound with a good capital allocation plan. These will support its acquisition plans.
Unfortunately, there is not enough margin of safety even when valuing SSD using a 2-stage-growth model.
Thrust of my analysis
I am a long-term value investor looking for a mismatch between the market price and the intrinsic value of a company. The intrinsic value of a company is dependent on its free cash flows, growth rate, and cost of capital.
The free cash flows in turn are dependent on its earnings and Reinvestments.
I defined Reinvestments as CAPEX + Acquisitions - Depreciation & Amortization + Changes in Net Working Capital.
Growth rates are driven not just by organic growth but also by acquisitions. These will then depend on the reinvestments made.
Finally, the cost of capital will determine the discount rate used to determine the present value of the free cash flows. Apart from reflecting the time value of money, the cost of capital will also reflect the risk associated with the business. This includes the financial risks.
Given the above, you can understand why in my fundamental analysis of SSD, I focus on earnings, growth, and financial strengths.
Business background
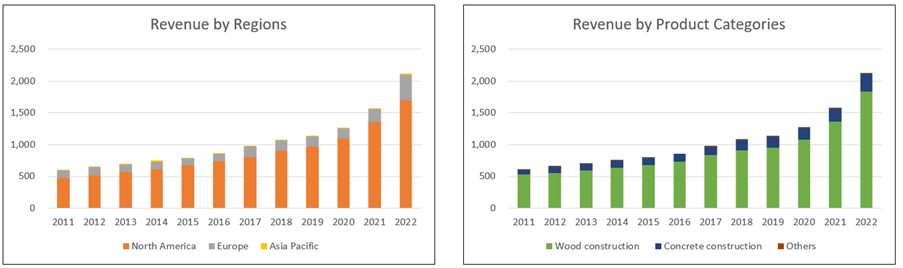
SSD is a leading manufacturer of high-quality wood and concrete construction products designed to make structures safer and more secure. I see it as being in the structural connector business.
While the company has two major product categories, the wood products accounted for the bulk of the revenue. Refer to the right part of Chart 1.
The company has 3 business segments:
- The North American segment includes operations in the U.S. and Canada.
- The Europe segment includes operations in the UK and several countries in the Eurozone region.
- The Asia/Pacific segment includes operations in Australia, New Zealand, China, Taiwan, and Vietnam.
These segments are similar in several ways, from the products and their applications to production processes, and distribution channels.
The North America segment accounted for the bulk of the revenue as can be seen from the left part of Chart 1.
Chart 1: Revenue profile (Author)
Before 2011, the company was in the venting and structural connector businesses. In 2010, SSD divested its venting business to focus on the structural connector one. As such, I analyzed SSD performance from 2011 onwards.
Operating trends
I looked at two groups of metrics to get a sense of how the company had performed over the past 12 years.
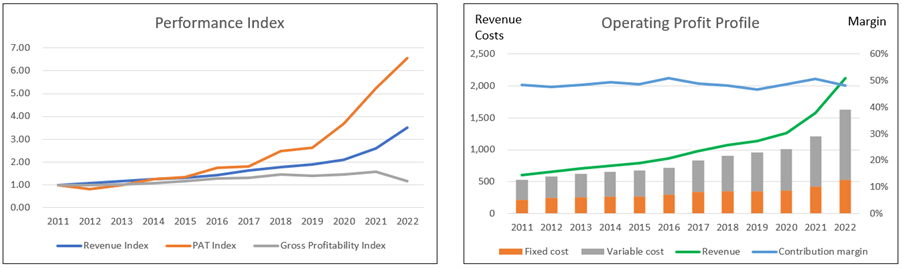
- Performance Indices for revenue, PAT, and gross profitability (gross profits / total assets). Refer to the left chart in Chart 2.
- Operating profits that are broken down into revenue, fixed costs, and variable costs. Refer to the right chart in Chart 2.
Over the past 12 years, revenue grew at 12.1 % CAGR. You can see a more significant growth rate post-2019.
The company was profitable every year. There was a higher profit growth rate post-2019. This was partly due to higher revenue, better gross profit margins, and lower Selling, General, and Admin ((SGA)) margins.
The other positive sign was the improvements in gross profitability. This indicated improving capital efficiency.
Chart 2: Operating Trends (Author)
a) Note to the Performance Index chart. To plot the various metrics on one chart, I have converted the various metrics into indices. The respective index was created by dividing the various annual values by the respective 2011 values.
b) Note to the Operating Profit chart. I broke down the operating profits into fixed costs and variable costs estimated as follows:
- Fixed cost = SGA, R&D, and Depreciation & Amortization.
- Variable cost = Cost of Sales - Depreciation & Amortization.
- Contribution = Revenue - Variable Cost.
- Contribution margin = Contribution/Revenue.
Returns
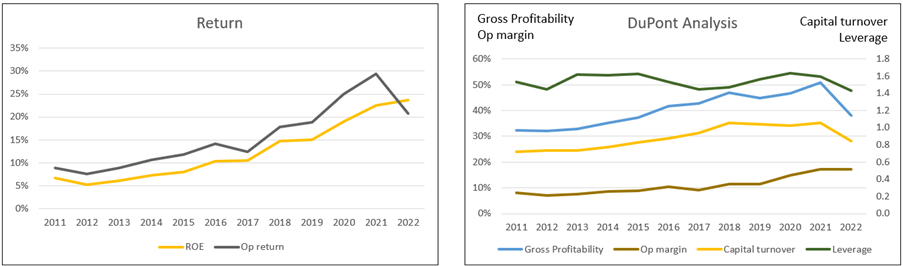
The improving profits led to improving returns. This can be seen in the left portion of Chart 3. Over the past 12 years,
- ROE ranged from 5.3 % to 23.6 % with an average of 12.4 %.
- Operating returns ranged from 7.6 % to 29.4 % with an average of 15.5 %.
Considering the 10.9 % WACC, this is a very good performance. The improvements were driven by better operating margins, capital turnover, and leverage. Refer to the DuPont Analysis.
Chart 3: Return and DuPont Analysis (Author)
Note to the Return chart. Operating return = EBIT(1-t) / TCE where TCE = Equity + Debt - Cash.
Growth
Revenue growth over the past 12 years was due to a combination of organic growth and acquisitions. The company did not provide a breakdown of its revenue growth into those due to acquisitions and organic growth. But I guesstimated that acquisition accounted for more than double the organic growth.
Over the past 12 years, the company spent USD 338 million billion on net CAPEX compared to USD 965 million on net acquisitions. Assuming a proportionate contribution to growth, you would expect acquisitions to account for more of the growth.
There were acquisitions almost every year over the past 12 years. This meant that without the acquisitions, SSD's annual organic growth was probably in the 3 % to 4% range. This is about the long-term US GDP growth rate.
In March of 2021, SSD unveiled its new, five-year Company Ambitions. Among them is to:
"…continue above-market growth relative to US housing starts..."
SSD would have to continue to acquire companies to achieve this "Company Ambition."
Growth drivers
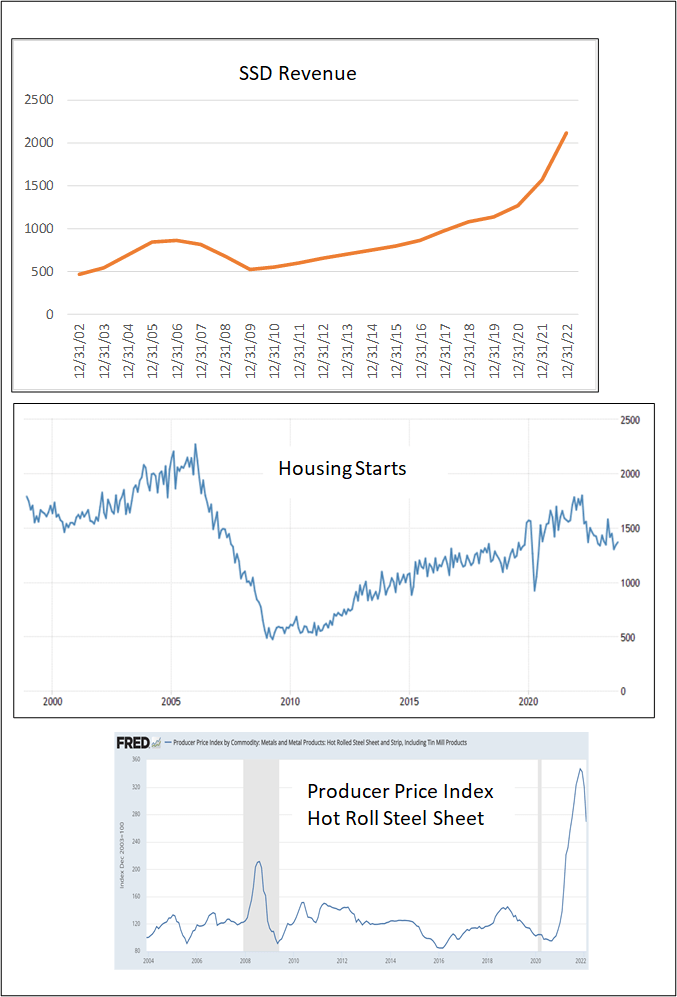
Apart from acquisitions, revenue growth over the past decade benefited from the uptrend in Housing Starts. Secondly, there were product price increases that benefited from the extraordinarily high steel prices over the past few years.
According to the company's 2022 Annual Report:
"…While we have continued to benefit from the US housing market, we now believe approximately 50% of our revenue is reliant on US housing starts…
…The principal raw material used by the Company is steel… Sales growth was…driven…by the product price increases we implemented… to offset rising raw material costs."
To illustrate the links between them, I have in Chart 4 "synchronized" SSD revenue with the US Housing Starts and FRED Hot Rolled Steel Price Index.
You can see SSD revenue moving in tandem with Housing Starts and the steel price spike in 2022.
The concern here is that SSD's high growth rate may be reduced when the Housing Starts go into the downtrend leg of the cycle. The expected decline in steel prices will also impact its high growth rate.
Chart 4: SSD Revenue vs Housing Starts vs Steel Prices (Author, Trading Economics, FRED)
Reinvestments
Growth needs to be funded and one metric for this is the Reinvestment rate. This is defined as:
Reinvestment rate = Reinvestment / after-tax EBIT.
Over the past 12 years, the company incurred USD 1.32 billion for Reinvestments compared to USD 1.54 billion after-tax EBIT. This resulted in an average Reinvestment rate of 86 %.
This is a very high rate that would reduce the free cash flow considerably. This is due to the amount spent on acquisitions. I believe that in the long run, this would have to reduce to a sustainable rate given by the fundamental growth equation where;
Growth = Return X Reinvestment rate
Return = EBIT(1-t) / Total Capital Employed.
I have used the fundamental growth equation in my valuation model.
In this context, the pace and/or size of the acquisitions would have to be scaled down to match the fundamental Reinvestment rate.
Financial position
I would rate SSD as financially sound based on the following rationales.
It has a 0.26 Debt Capital ratio as of the end of Sep 2023. As per the Damodaran Jan 2023 dataset, the Debt Capital ratio for the building materials sector was 0.22.
As of the end of Sep 2023, it had USD 571 million in cash. This was about 20 % of its total assets.
Over the past 12 years, it generated positive cash flow from operations every year. In total, it generated USD 1.74 billion cash flow from operations compared to the total PAT of USD 1.51 billion. This is a very good cash conversion ratio.
I had earlier mentioned that its returns were greater than the cost of capital. This indicated that it was able to create shareholders' value.
It had a good capital allocation plan as shown in Table 1. The cash flow from operations was sufficient to fund dividends, share buybacks, CAPEX, and part of the acquisitions.
Table 1: Source and Uses of Funds 2011 to 2022 (Author)
Valuation
Referring to the topmost chart in Chart 4, you can see that SSD revenue is cyclical. I would surmise that this is driven by some combined Housing Starts cycle and steel price cycle.
Aswath Damodoran has this to say about valuing cyclical companies:
Cyclical and commodity companies share a common feature, insofar as their value is often more dependent on the movement of a macro variable… than it is on firm-specific characteristics…the biggest problem we face in valuing companies…is that the earnings and cash flows reported in the most recent year are a function of where we are in the cycle, and extrapolating those numbers into the future can result in serious misvaluation."
To overcome the cyclical issue, we have to normalize the performance over the cycle. Damodaran suggested 2 ways to do this
- Take the average values over the cycle.
- Take the current revenue and determine the earnings by multiplying it with the normalized margins.
The challenge with the first approach for SSD is that the size of the company currently is far greater than that in 2011. I thus adopted the second approach when looking at its value over the cycle.
Furthermore, in valuing SSD, I also considered that it may continue with the double-digit growth rate and improve its operations.
I thus considered 3 Scenarios in my valuation
- Scenario 1. This is a conservative case where there is no further acquisition. The company will grow at the long-term GDP growth rate of 4%. I used a single-stage growth model here.
- Scenario 2. In this scenario, I assumed that the company would continue with double-digit growth rate and take 5 years to transition to the long-term growth rate. I used a 2-stage growth model here.
- Scenario 3. This is an optimistic one where in addition to the growth assumptions of Scenario 2, I assumed that there would be 5% improvements in the key operating metrics by year 5. I used a 2-stage growth model here.
The results of the valuations are shown in Table 2.
Table 2 Summary of valuation (Author)
In the 9 months ended Sep 2023, SSD revenue was 4% higher than that for the first 9 months of last year. Operating profit was 6% higher. The company attributed the better performance mainly due to a large acquisition in April of last year. This provided the 2023 performance with an additional quarter of sales in 2023.
This reinforces my point that without the acquisitions, the SSD growth rate would revert to the long-term GDP growth rate. In other words, Scenario 2 and 3 are the more realistic one.
Unfortunately, there is not enough margin of safety even under these 2 Scenarios. I would conclude that SSD is not an investment opportunity.
Single-stage valuation model
I valued SSD using the Free Cash Flow to the Firm (FCFF) model as represented by:
Value of firm = FCFF X (1+g) / (WACC - g)
FCFF = EBIT(1-t)
My valuation model is based on the operating profit model shown in Chart 2.
The key variables in my model are:
- Revenue. I assumed the 2022 revenue.
- Contribution margin. I based this on the 2011 to 2022 average.
- Fixed costs. I assumed this to be based on the 2021 and 2022 SGA and R&D expenses.
- Other costs. I assumed the average 2012 to 2022 of USD 3.6 million
If you want to see the details of the valuation model, I have provided a link to my worksheet. In the worksheet, you can do your sensitivity analysis by varying the various parameters
The WACC used in the model was derived based on the first page results of the Google search for the term "SSD WACC". Refer to Table 3.
Table 3: WACC (Various)
2-stage valuation model
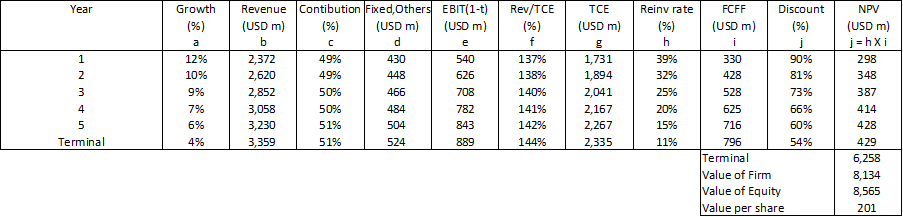
The model is illustrated in Table 4. The various parameters in the table are linked to an input table (not shown). This is a general model where you can vary many of the parameters. The link mentioned above will enable you to access the worksheet and carry out your sensitivity analysis.
Table 4: 2-stage valuation model (Author)
Notes to Table 4
a) Straight-line reduction.
b) Pegged to growth rate.
c) Straight-line improvement.
d) Assumed growth at the terminal rate.
e) Revenue X Net Margin and after accounting for Others expenses.
f) Straight-line improvement.
g) Revenue X (Revenue/TCE) ratio.
h) Based on the growth equation.
i) EBIT(1-t) X (1 - Reinvestment rate).
j) Assumed constant D/E ratio. If the Debt is reduced, the WACC would be higher due to the higher cost of equity.
Risks and limitations
There are 3 issues to consider when looking at my valuations:
- Reinvestment rate.
- High WACC.
- Cyclical performance.
I assumed that SSD would instantaneously achieve a Reinvestment rate based on the fundamental growth equation. To illustrate the issue:
- The average Reinvestment rate over the past 12 years was 86%.
- In my Scenario 1, I assumed a Reinvestment rate of 14 %.
With a Reinvestment rate of 86%, the intrinsic value of SSD under Scenario 1 would be USD 26 per share. My point is that my valuation is an optimistic one.
Balancing this is the high WACC of 10.9 %. This is based on the current high risk-free rate reflecting both the high-interest rate and the geopolitical situation.
When the interest rate declines, I would expect a reduction in the risk-free rate and a corresponding reduction in the WACC. This would increase the value of SSD. For example, a 10% reduction in the WACC would increase the value under Scenario 1 from USD 140 per share to USD 166 per share.
I took the 2011 to 2022 average values to represent the cyclical contribution margin. But looking at Chart 4, this is only the trough-to-peak part of the Housing Starts cycle. A better picture would be to have the average from the tough-to-trough part of the cycle.
However, I am constrained by the data available. The valuation assumed that the average values in the downtrend leg of the cycle would be the same as for the uptrend part. In many cases, this is not true as there are potential impairments in a prolonged downtrend.
I do not have a crystal ball to see how the future will unfold. I hope that by providing the link to my worksheets, you can carry out your sensitivity analysis.
Conclusion
I would rate SSD as fundamentally sound and consider it a "wonderful" company based on the following:
- It had been able to translate its high revenue growth into improving returns.
- The improving returns were driven by improving operating efficiencies. There were improvements in gross profitability, leverage, and capital turnover.
- It is financially sound with a good capital allocation track record.
The only concern is the high Reinvestment rate. Any reduction in this rate would have to come from improving returns as well as negotiating for a better acquisition price.
Unfortunately, despite being a "wonderful" company, there is not enough margin of safety. This is despite valuing it based on a 2-stage growth model.
I am a long-term value investor and my analysis and valuation are based on this perspective. This is not an analysis for those hoping to make money over the next quarter or so.
For further details see:
Simpson Manufacturing: Not Enough Margin Of Safety For This 'Wonderful' Company