SITC - SITE Centers: Holding Steady
2023-10-22 09:00:00 ET
Summary
- Strip Center REITs have slightly outperformed the average REIT YTD, despite a challenging year for REITs as a whole.
- Strip Center REITs benefit from near-zero new development of shopping centers, high occupancy rates, and double-digit rent growth spreads.
- SITC has a strong balance sheet, and is enjoying double-digit leasing spreads, but pays a below-average dividend and has significant indebtedness problems.
Strip Center REITs (also called Shopping Center REITs) have slightly outperformed the average REIT YTD (year to date), returning an average of (-7.49)%, compared to the Equity REIT Index return of (-9.48)%. It has not been a good year for REITs as a whole, as all of the major indexes have vastly outpaced REITs in total return.
Hoya Capital Income Builder
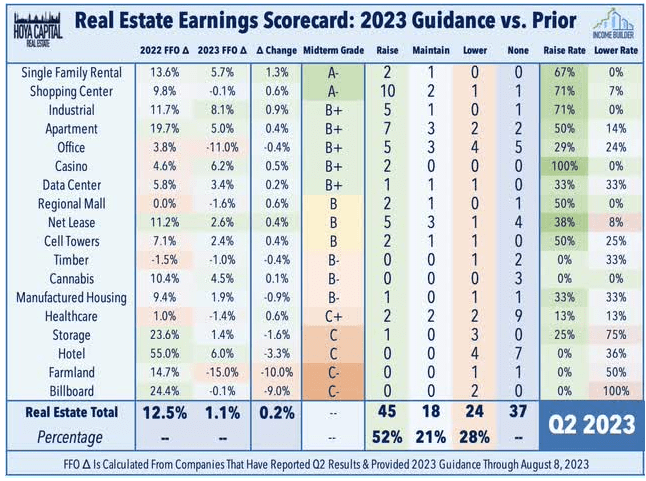
Sector fundamentals continue to be positive for Strip Center REITs. Consider the following three points, courtesy of Hoya Capital, the leading source for sector-level REIT analysis.
- Near-zero new development of Shopping Centers coming out of the pandemic, plus positive net store openings since 2021, has driven occupancy rates to record highs, giving Strip Center REITs some long-awaited pricing power.
- This favorable property-level supply/demand landscape has led to double-digit rent growth spreads since mid-2022 and the best earnings "beat rate" of any property sector during that time.
- Shopping Center REITs were notable standouts in Q2 earnings season. Of the 14 Shopping Center REITs, 10 of the companies (71%) raised guidance, and only one (7%) lowered. All in all, with a mid-term grade of A- from Hoya Capital Income Builder, Shopping Center REITs rank as the second-best performing of the 18 REIT sectors in Q2 earnings up to now.
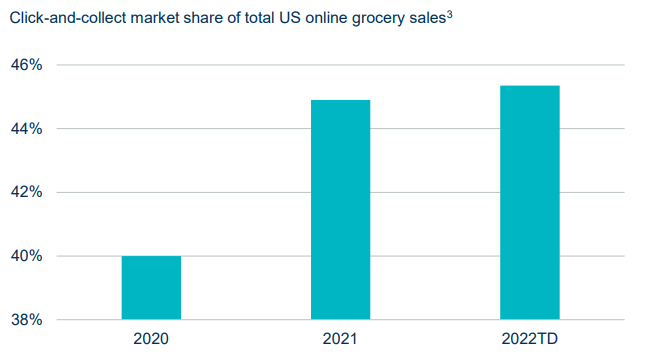
These are open-air shopping centers we are talking about, as opposed to Regional Malls. Strip Centers are closer to their customers, and enjoy higher trip frequency. Strip Centers are also benefitting from the WFH (work from home) trend, which drives more local shopping, and the BOPIS (buy online pickup in store) trend, both of which are here to stay.
That said, after a long COVID-induced winter, Regional Mall REITs have slightly outdistanced Strip Center REITs YTD, returning (-5.3)%, as shown in the first chart above.
Meet the company
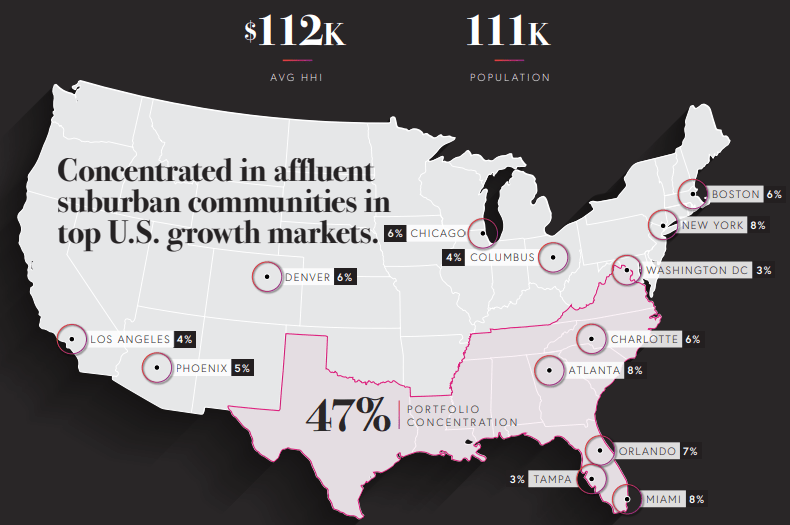
Founded in 1965 and headquartered in Beachwood, Ohio, SITE Centers ( SITC ) is a small cap, at $2.5 billion. The company owns and operates a portfolio of 105 wholly-owned strip centers, situated fortuitously in wealthy neighborhoods with an average household income of $112,000 per year, which ranks in the 90th percentile. These are among the wealthiest suburban areas in the country, and are well above-average in population density, with an average of 111,000 people within a 3-mile radius of SITC properties.
Nearly half the company's ABR (47%) comes from the Old South, with an additional 9% from the Sunbelt markets of Phoenix and Los Angeles.
SITC investor presentation
The geographic spread is healthy, with the largest concentration of assets (just 8%) in Atlanta, another 8% in Miami, and 7% in Orlando.
SITC investor presentation
SITC's leased rate has grown to 95.9%, and as of June 30, the TTM (trailing twelve month) new cash leasing spreads exceeded 29%. The company also has a $19 million pipeline of leases signed but not yet occupied, which should create a nice revenue growth tailwind over the next few years, for a company that currently has about $380 million in ABR (annual base rent).
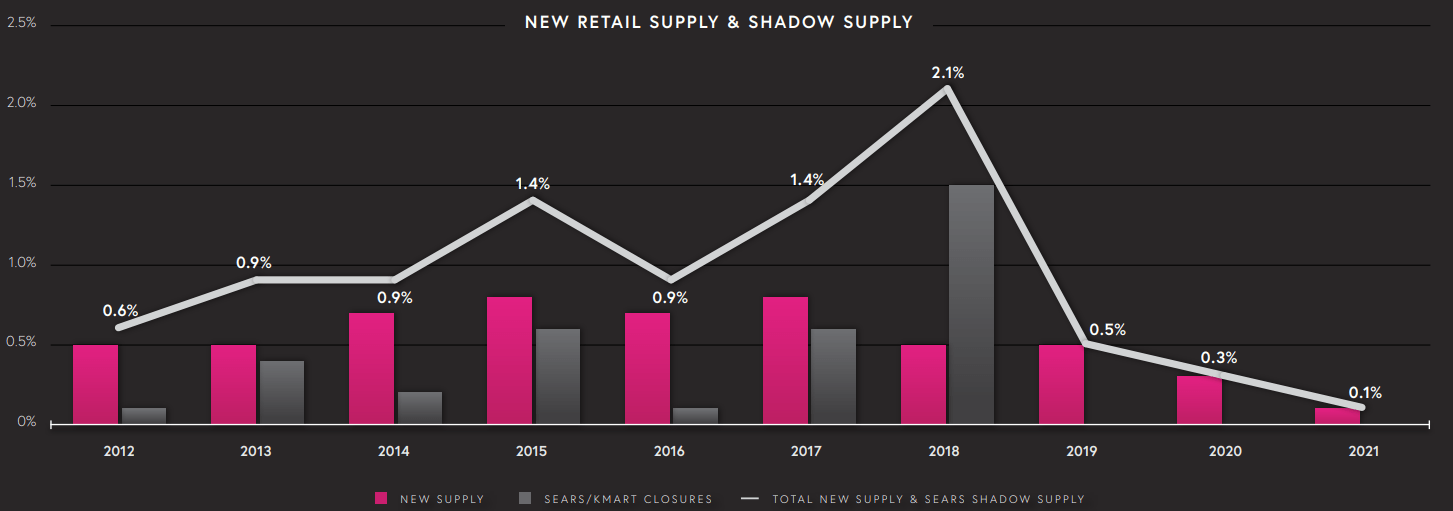
The company is also benefitting from historically low levels of new supply in their markets. As the chart below shows, new supply through 2021 had dropped to near-zero.
The vast majority (84%) of the companies that rent from SITC are national in scope, and 36% are publicly traded.
Of the 77 new anchor tenants signed since 2020, only 14% are grocers, with discounters (31%) and furniture stores (14%) leading the way, along with fitness centers (13%), and sporting goods retailers (11%).
SITC investor presentation
A representative sampling of those anchor tenants is shown below.
As of 6 months ago, Bed Bath and Beyond accounted for only 1.7% of ABR for SITC, and 15 of the 16 locations have been leased to new tenants.
Growth metrics
Here are the 3-year growth figures for FFO (funds from operations), and TCFO (total cash from operations).
| Metric |
| 2019 |
| 2020 |
| 2021 |
| 2022 |
| 3-year CAGR |
| FFO (millions) |
| $230 |
| $177 |
| $243 |
| $251 |
| -- |
| FFO Growth % |
| -- |
| (-23.0) |
| 37.3 |
| 3.3 |
| 2.96% |
| FFO per share |
| $1.27 |
| $0.99 |
| $1.17 |
| $1.18 |
| -- |
| FFO per share growth % |
| -- |
| (-22.0) |
| 18.2 |
| 0.9 |
| (-2.42)% |
| TCFO (millions) |
| $270 |
| $190 |
| $283 |
| $257 |
| -- |
| TCFO Growth % |
| -- |
| (-29.6) |
| 48.9 |
| (-9.2) |
| (-1.63)% |
Source: TD Ameritrade, Hoya Capital Income Builder, and author calculations
Like nearly every REIT on the planet, SITC took a big step back financially during the pandemic. In 2021, SITC regained all of its lost ground in revenues and cash flow, but not in FFO/share, which indicates that they financed their recovery at least in part with share issuance. In 2022, FFO continued to gain, but at a snail's pace, while FFO/share went nearly flat, and cash from operations slid a mildly alarming 9%.
The net effect is that while SITC's FFO has recovered beyond its pre-pandemic levels by a modest 2.96% per annum, FFO per share and cash from operations have not yet fully recovered, and are still in the red.
Meanwhile, here is how the stock price has done over the past 3 twelve-month periods, compared to the REIT average as represented by the Vanguard Real Estate ETF ( VNQ ).
| Metric |
| 2020 |
| 2021 |
| 2022 |
| 2023 |
| 3-yr CAGR |
| SITC share price Oct. 19 |
| $7.30 |
| $16.78 |
| $11.58 |
| $11.68 |
| -- |
| SITC share price Gain % |
| -- |
| 129.9 |
| (-69.0) |
| 0.9 |
| 17.0% |
| VNQ share price Oct. 19 |
| $79.56 |
| $106.70 |
| $77.88 |
| $72.84 |
| -- |
| VNQ share price Gain % |
| -- |
| 34.1 |
| (-27.0) |
| (-6.5) |
| (-2.9)% |
Source: MarketWatch.com and author calculations
SITC was among the top performers in all of REITdom, when it came to share price appreciation in 2021, rocketing upward almost 130%, then nosedived far worse than most in 2022, plummeting (-69.0)%. This year, it has leveled off, while the average REIT has taken a (-6.5)% battering. The net result is that, compared to this date 3 years ago, despite the volatility, investors who bought shares in SITC that day are sitting on 17.0% average annual price gains, while those who bought shares in the VNQ are "enjoying" an average annual loss of (-2.9)%.
Balance sheet metrics
Here are the key balance sheet metrics. SITC is rock solid, with an investment-grade balance sheet, low Debt/EBITDA (5.3), and slightly above-average liquidity (1.99), while its debt ratio of 33% is a little better than the average Strip Center REIT.
| Company |
| Liquidity Ratio |
| Debt Ratio |
| Debt/EBITDA |
| Bond Rating |
| SITC |
| 1.99 |
| 33% |
| 5.3 |
| BBB- |
Source: Hoya Capital Income Builder, TD Ameritrade, and author calculations
As of June 30, SITC was holding only $28 million in cash, and its payables outweighed its receivables by $92 million. Meanwhile, it has untapped reserves of $775 million in its revolver, according to its latest 10-Q . The interest rate on the revolver is 6.0%.
The weighted average interest rate on the company's $1.8 billion in long-term debt is 4.4%, up from 3.8% a year ago, and the weighted average maturity is just 2.8 years, meaning their debt is frontloaded. Perhaps this helps explain why I was unable to find a debt maturity schedule in their 10-Q and investor presentations.
Dividend metrics
At first blush, SITC appears to pay a solid, run-of-the-mill REIT dividend, but on closer inspection, the picture is not as favorable. Like most REITs, SITC was obliged to discontinue its dividend during the COVID lockdown. Although the company resumed paying dividends in December of 2020, the amount of the dividends still is nowhere near fully restored, thanks in part to SITC's very conservative 40% payout ratio, and its somewhat-too-safe Dividend Safety grade of B, as assigned by Seeking Alpha Premium. (I prefer a grade of C or C-, to indicate the company is balancing the shareholders' interest with their own.) Meanwhile, the average Strip Center REIT has all but restored its dividend entirely.
| Company |
| Div. Yield |
| 5-yr Div. Growth |
| Div. Score |
| Payout |
| Div. Safety |
| SITC |
| 4.45% |
| (-13.4)% |
| 2.89 |
| 40% |
| B |
Source: Hoya Capital Income Builder, TD Ameritrade, Seeking Alpha Premium
As a result of all this, SITC's status as a dividend payer is not as good as it appears at first blush, and the company earns a somewhat disappointing Dividend Score of just 2.89. Dividend Score projects the Yield three years from now, on shares bought today, assuming the Dividend Growth rate remains unchanged.
Valuation metrics
Appropriately, in light of its dividend problems, SITC is priced below the average Strip Center REIT, and well below the average REIT overall, and sells at a discount to NAV of over 30%, according to Hoya Capital Income Builder.
| Company |
| Div. Score |
| Price/FFO '23 |
| Premium to NAV |
| SITC |
| 2.89 |
| 10.2 |
| (-31.3)% |
Source: Hoya Capital Income Builder, TD Ameritrade, and author calculations
What could go wrong?
If e-commerce continues to take market share from brick-and-mortar retailers, then those retailers who do not re-imagine themselves as last-mile distribution points for e-commerce will be upwinded, at serious loss of revenue.
Unexpected disruptions, like civil war or another pandemic, could occur, and would have adverse consequences to all retailers.
SITC has $64 in debt for every dollar of cash it was holding as of June 30, and owes the equivalent of almost 5 years of its ABR, yet most of the debt is due and payable in about 3 years. Since their revenue will likely be insufficient to make the payments, they will likely have to refinance, probably at higher interest rates, or issue a lot of new shares, diluting shareholder value.
Investor's bottom line
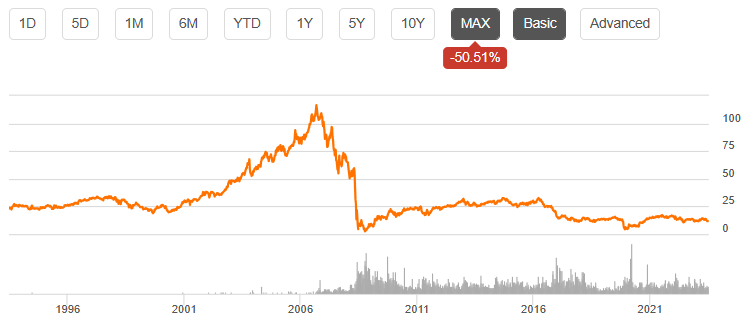
There does not seem to be any compelling reason to buy SITC, but on the other hand, with a steady balance sheet and strong leasing spreads, there does not seem to be any reason to sell it either. One more picture is instructive in this regard.
This shows that the long-term share price trend for SITC is slowly but relentlessly downward. The company has been in business for 58 years, yet is still a small cap, and its shares have lost 50% of their value over the last 30 years. The dividends paid have of course outweighed this loss of valuation. The point is, this is not a company you want to buy, expecting long-term appreciation in share price. It is a company you would buy, hoping for a stable flow of dividends only. And unfortunately, it does not really deliver on that either.
I believe REITs are nearing a bottom, and most of them will do well over the next year or two, including SITC. There are a lot of great bargains out there, but this isn't one of them. There are much better choices in the Strip Center sector alone, not to mention many REITs in other sectors. I rate SITC a Hold.
Seeking Alpha Premium
The Street, TipRanks, and Ford Equity Research all concur, as do 9 of the 14 analysts who cover the firm. Of the other 5, four rate the company a Strong Buy, and the other a Buy. Meanwhile, Zacks rates SITC a Sell.
As always, however, the opinion that matters most is yours.
For further details see:
SITE Centers: Holding Steady