TSLX - Sixth Street Specialty Lending: Outperforming Strong Earnings
2023-11-17 09:15:00 ET
Summary
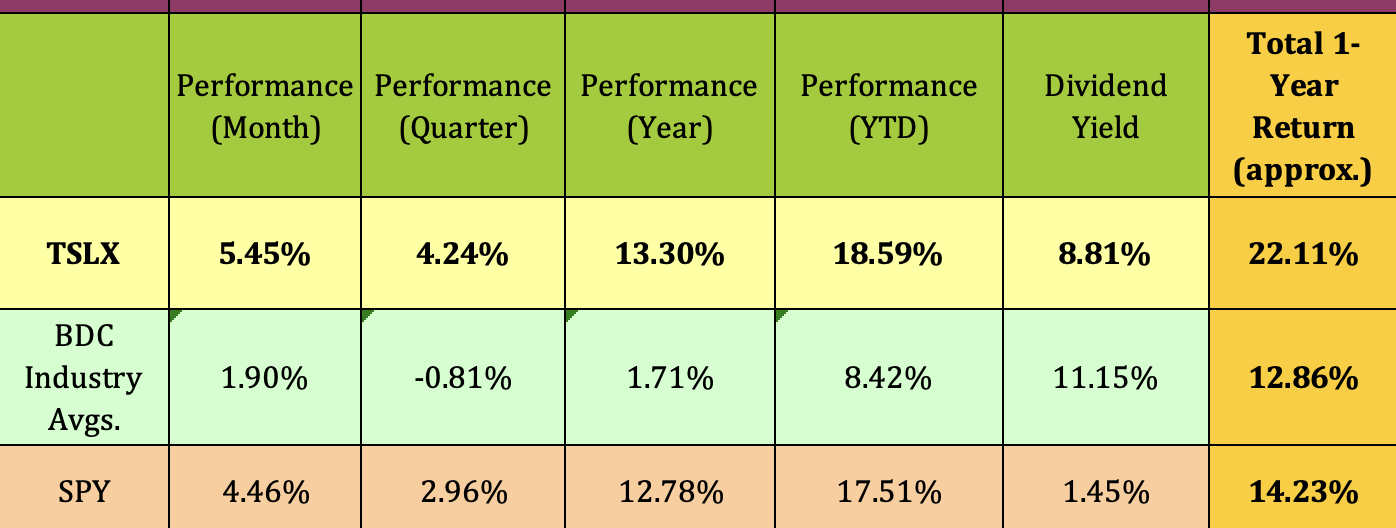
- TSLX has outperformed the BDC industry and the S&P 500 in 2023, with an 18.6% increase in its price.
- Unlike many other BDC's, TSLX has positive Realized Gains in 2023.
- TSLX yields 10% with strong dividend coverage.
Looking for market-leading business development companies? Many BDCs have soared in 2023 due to the earnings benefits of rising interest rates.
For example, Sixth Street Specialty Lending (TSLX) is up 18.6% so far in 2023, outperforming the BDC industry by over 1000 basis points, and also outperforming the S&P 500. TSLX has also outperformed over the past month, quarter and year:
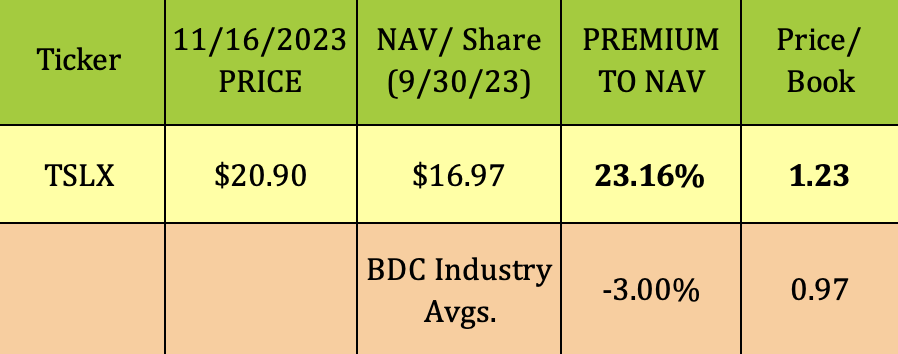
With that outperformance, it's not surprising that TSLX is selling at a much higher premium, 23.16%, to its Q3 '23 NAV/Share, vs. the BDC industry's overall average of -3%.
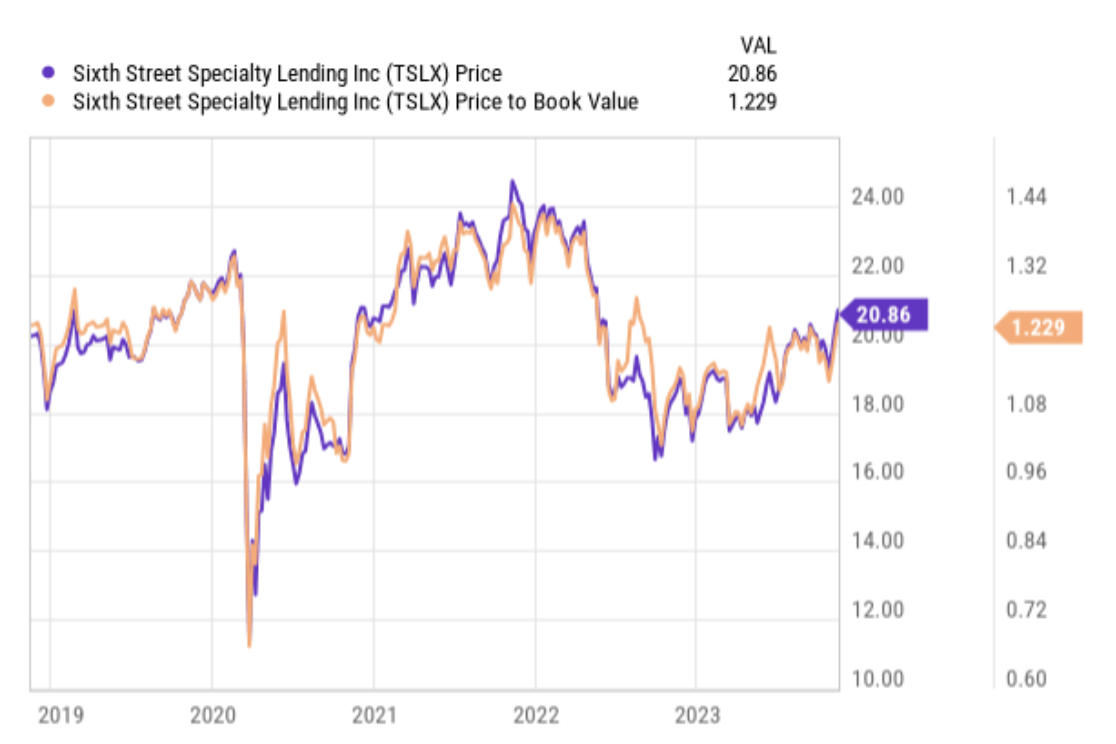
Premium pricing isn't a novelty for TSLX - it usually trades at a premium to NAV. Excepting the 2020 COVID pullback, when it briefly dove into deep negative territory, TSLX has mostly sold at a premium. It got as high as 1.44X-plus in late 2022, and has spent most of 2023 above 1X:
So, when should you buy a strong performer like TSLX, and how much of a premium are you willing to pay?
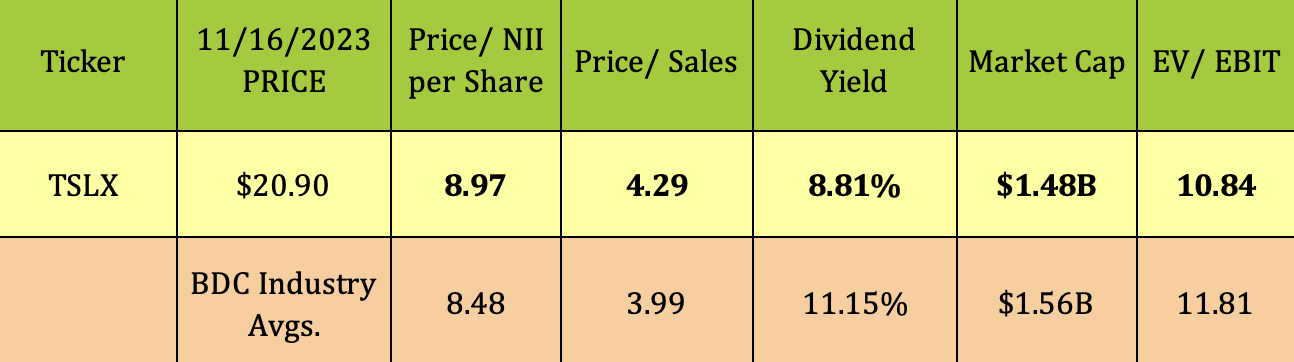
Our advice is to not base your decision solely on price/NAV, which can be affected by many issues, such as dividends, but to also consider a BDC's Price to Net Investment Income/Share, P/NII, multiple, which can give you a clearer picture of its relative value.
In TSLX's case, its P/NII of 8.97X is about 6% higher than the BDC industry average of 8.48X, not as much of a premium as its P/NAV. While its P/sales is a bit higher than average, its overall enterprise value to EBIT is actually lower than average, at 10.84X vs. the 11.81X industry average. The market also seems to be content with TSLX's lower base dividend yield.
Dividends:
Management declared a $.46 base dividend based on Q3 '23 earnings, which goes ex-dividend on 12/14/23, with a 12/30/23 pay date. They also declared a $.07 supplemental distribution, which goes ex-dividend on 11/29/23, with a 12/20/23 pay date.
TSLX'S base dividend is $.46/quarter. At its 11/16/23 intraday price of $20.89, its base yield is 8.81%. It has declared $.26/share in variable supplemental distributions in 2023, which adds 1.26%, for a total dividend yield of 10.05%:
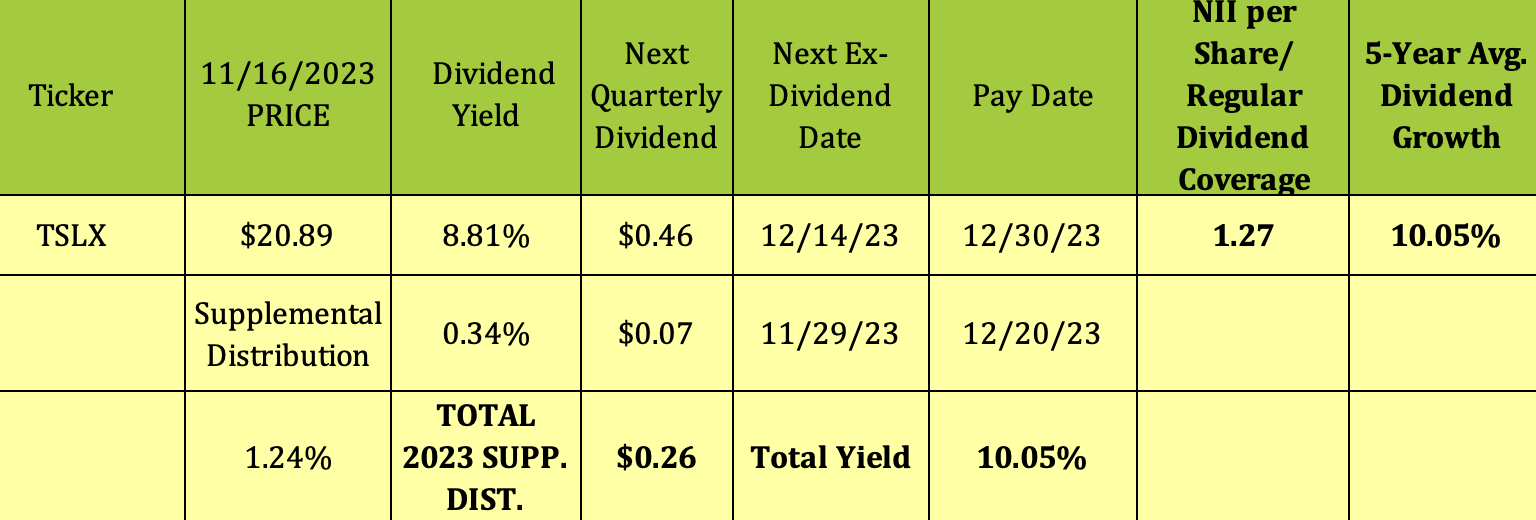
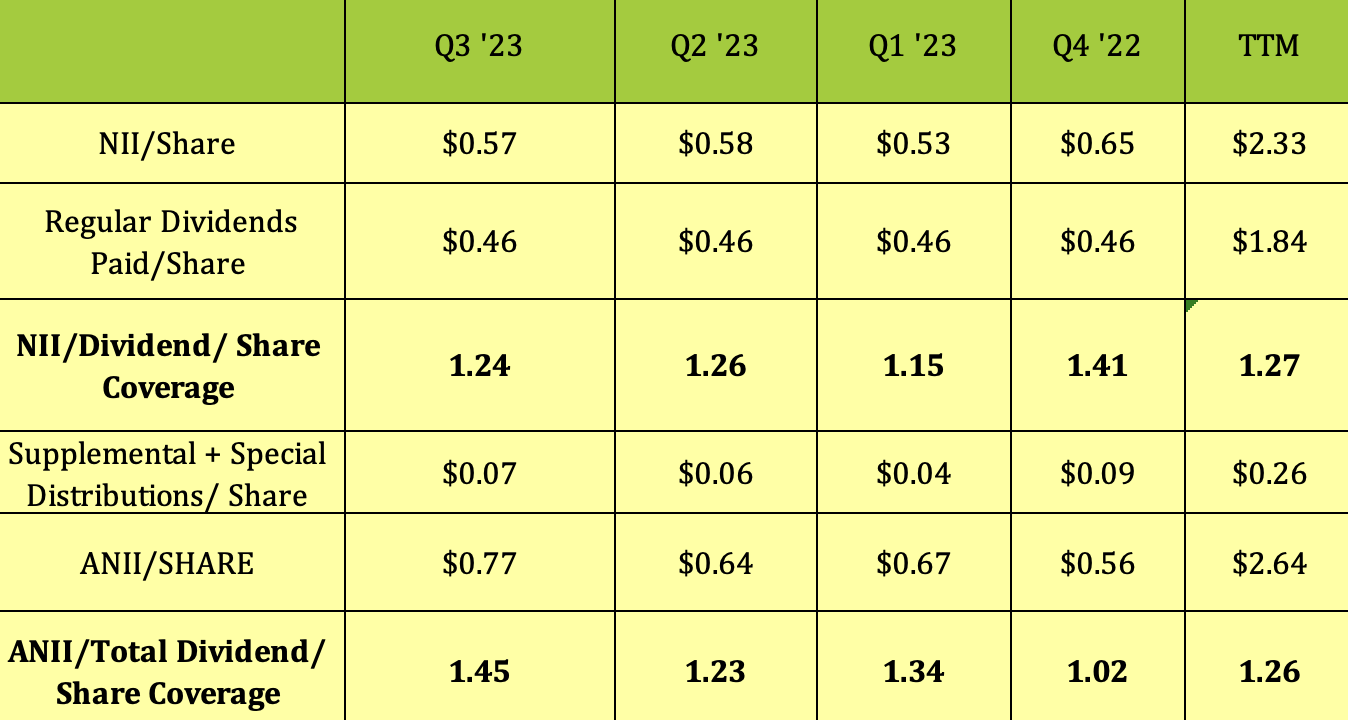
TSLX's NII/Share base dividend coverage was a strong 1.24X for Q3 '23, and has averaged 1.27X over the past four quarters. That's among the higher tier of dividend coverage figures in the BDC industry.
Management uses Adjusted Net Investment Income, ANII as a dividend coverage metric. The ANII/Total Dividends coverage factor, which includes the supplemental distributions was 1.45X for Q3 '23, and has averaged 1.26X for the last four quarters.
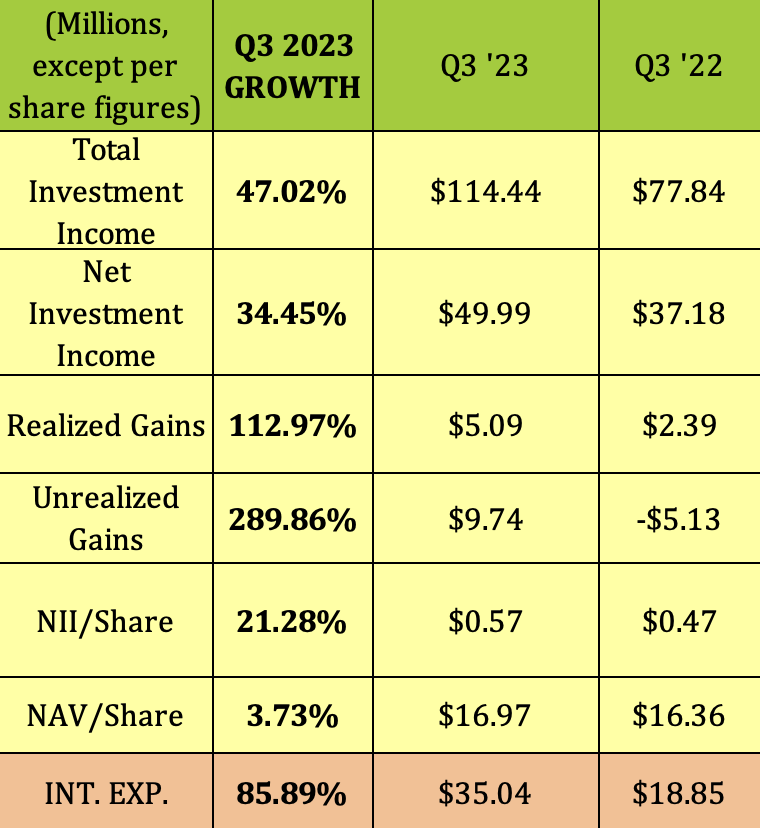
Rising rates have impacted BDCs' earnings in a positive way, but they've also put pressure on some of the underlying companies that BDCs invest in. This has caused higher realized and unrealized losses for many BDCs in 2023.
However, TSLX has avoided that trend so far in 2023 - it had $5M in Realized Gains and $9.74M in Unrealized Gains in Q3 '23, and $11.8M and $17.34M, respectively, in Q1-3 '23. Those positive figures are rather uncommon in the BDC industry in 2023. They helped TSLX's NAV/Share to rise 3.7%, to $16.97.
Q3 '23 also had 47% topline growth and 34% NII growth vs. Q3 '22, with NII outstripping a big 86% jump in interest expense.
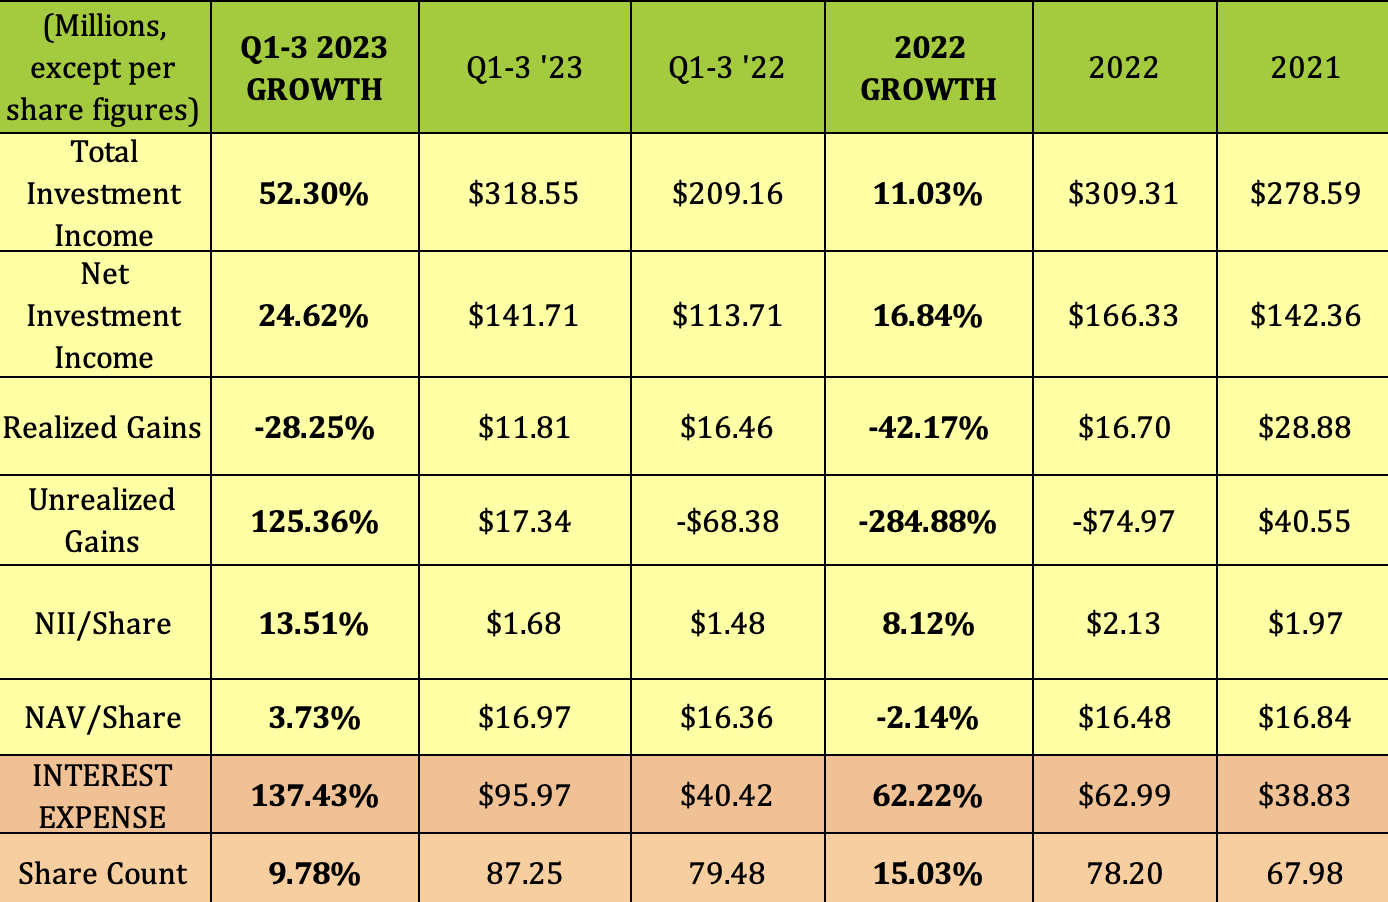
For Q1-3 '23, TSLX has had 52% growth in total investment income, 24.6% NII growth, and 13.5% NII/Share growth, with all three figures outperforming their 2022 growth. The positive Realized Gains performance has continued the trend from 2022, while the positive Unrealized Gains performance turned around 2022's negative performance.
During Q3 '23, management made $206M in new commitments and $152M in fundings. The fundings were across eight new and two increases to existing portfolio companies. New investments were primarily 1st lien loans across six diversified user industries. As seen elsewhere in the BDC industry, new commitments have been lower in 2023.
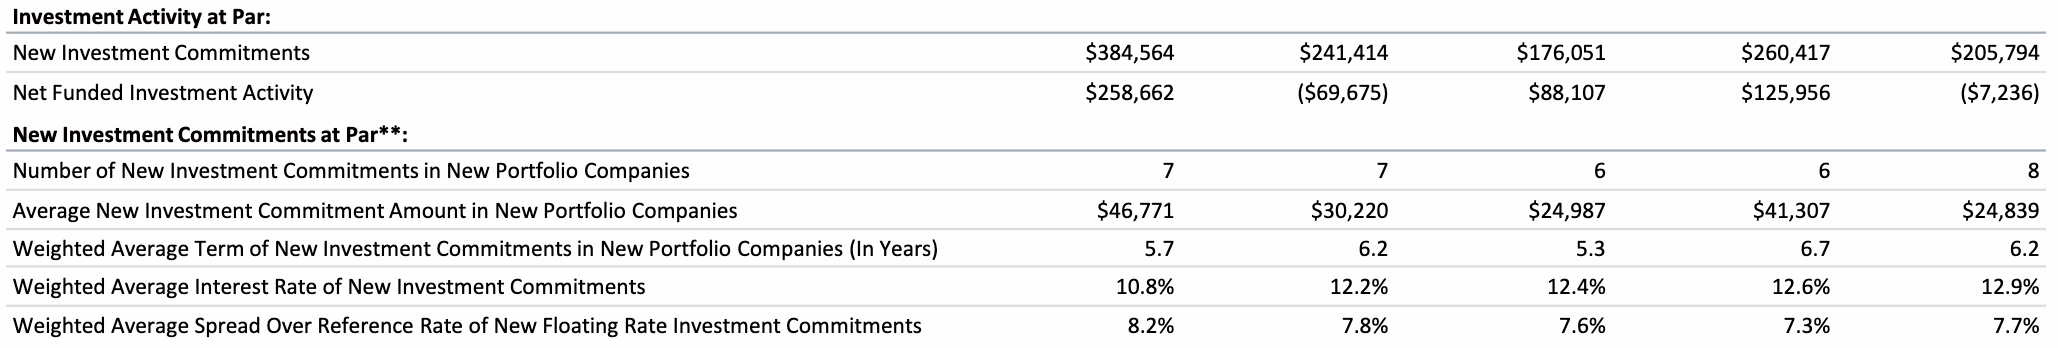
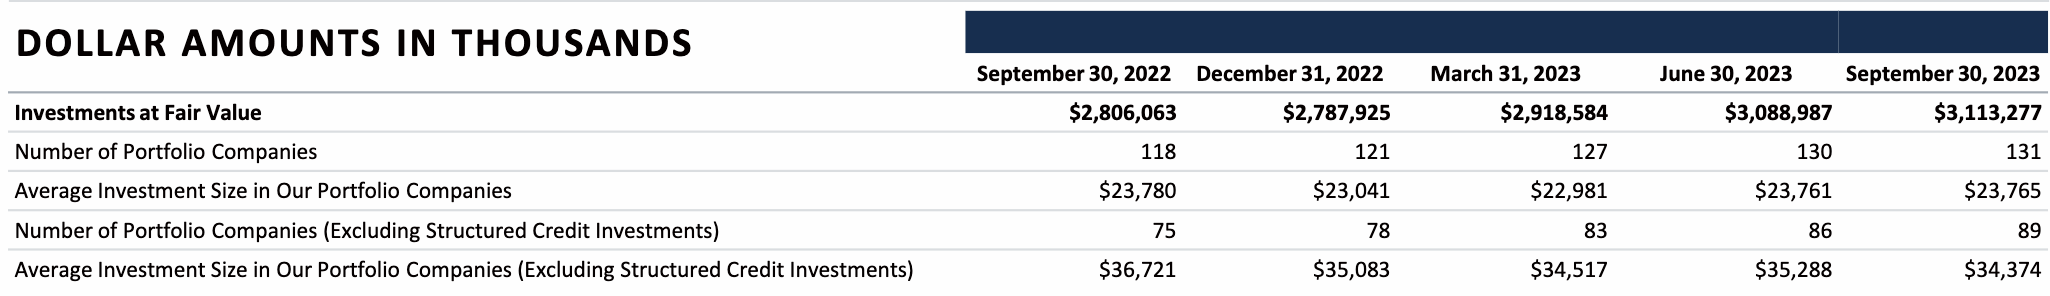
TSLX's portfolio has grown from $2.8B to $3.1B over the past year, with it holding investments in 131 companies as of 9/30/23, vs. 118 as of 9/30/22. 42 of the investments were via Structured Credit. The average investment size has been stable, at $23.7M.
99.7% of TSLX's debt investments are floating rate debt investments. TSLX's weighted average yield from its Debt and Income producing investments has risen from 12.2.% in Q3 '22 to 14.3% in Q3 '23.
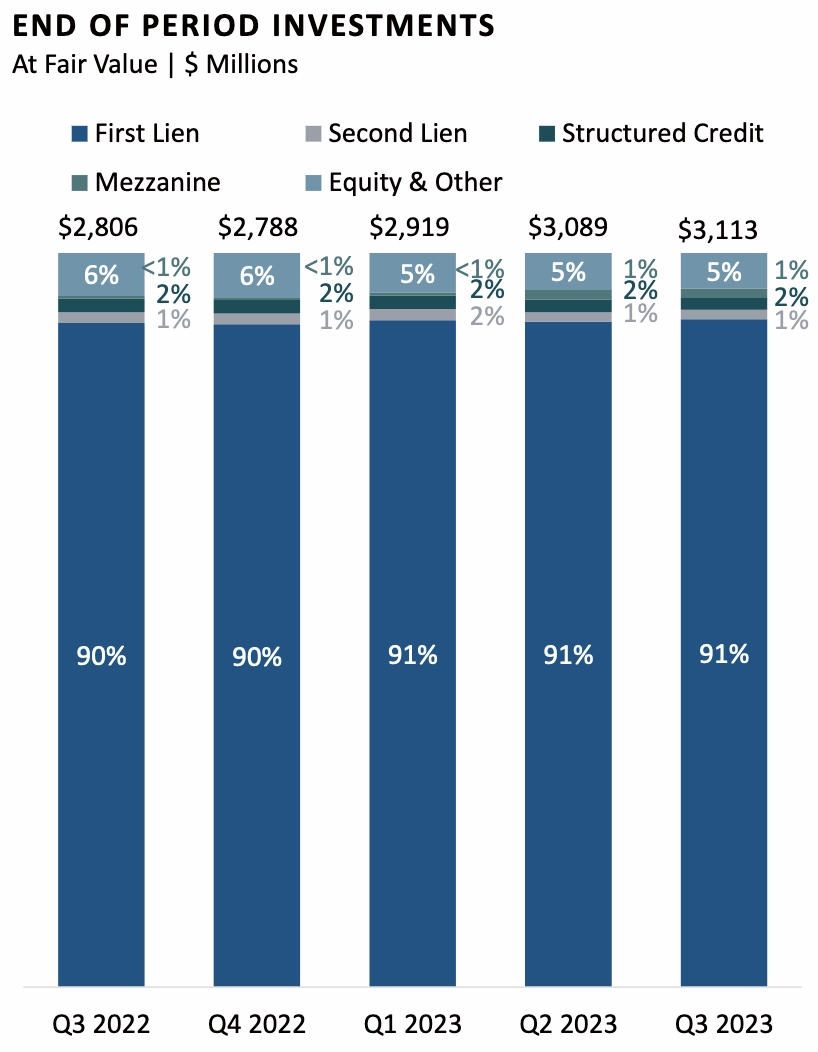
91% of its holdings were 1st Lien, and 5% were in Equity investments over the past three quarters, with additional 1%-2% amounts in Structured Credit and Mezzanine investments.
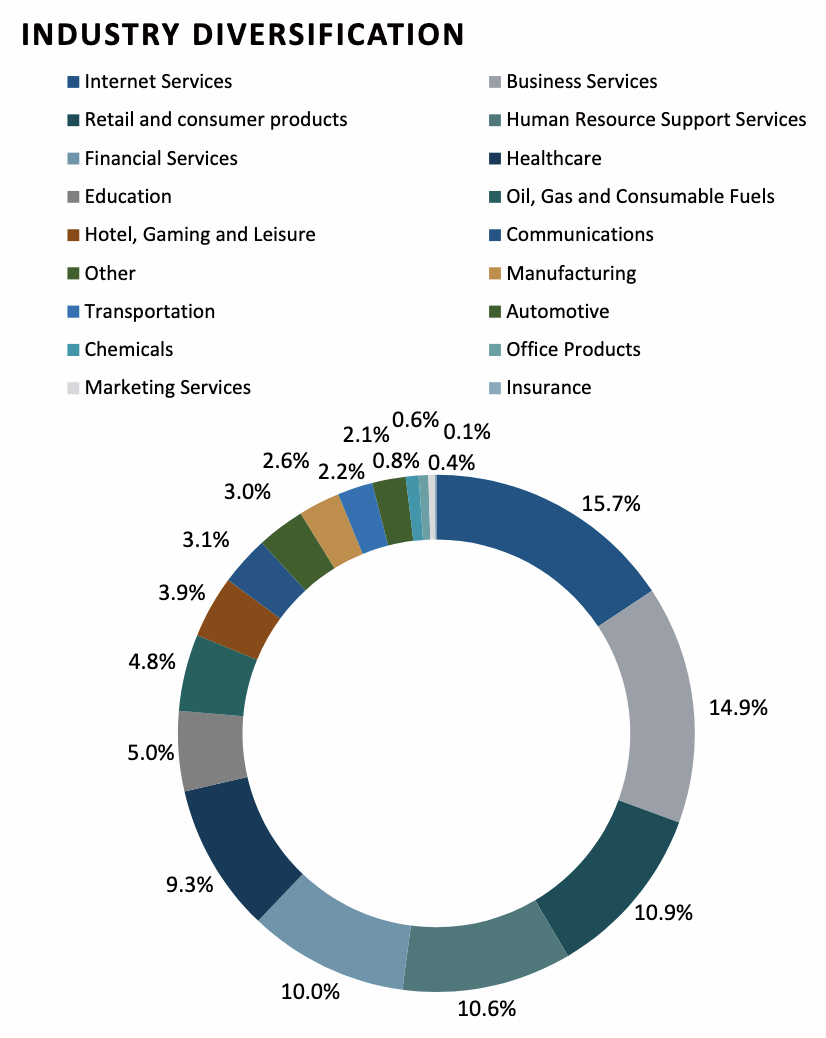
As of 9/30/23, Non-accrual investments represented 0.7% of the portfolio at fair value. Management noted on the Q3 '23 earnings call that, "our portfolio is generally insulated from consumer discretionary trends given the B2B nature of the majority of our portfolio companies."
TSLX's top two industry exposures remain Internet Services, which has increased slightly, from 15% to 15.7% over the past two quarters, and Business Services, which increased from 12.7% to 14.9%. Financial Services has decreased from 12.2% to 10.9%. The top six industry exposures make up ~71% of its portfolio:
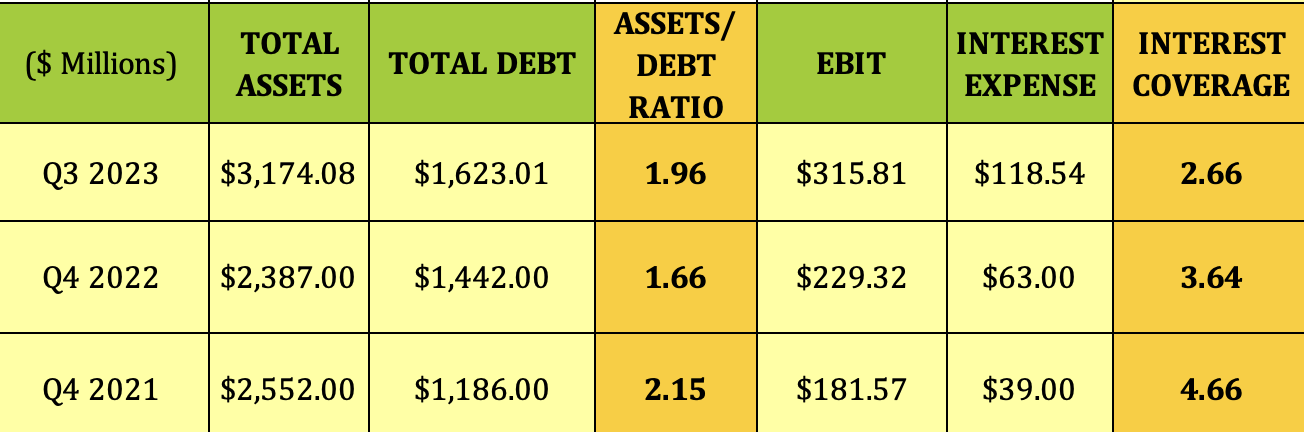
Looking at the flip side - liabilities, we see that, like many BDCs, TSLX ramped up its debt in 2022, and continued to do so in Q1-3 '23, in order to increase its portfolio. However, its assets/debt ratio improved in Q1-3 '23, rising from 1.66X to 1.96X. As seen with other BDCs, however, its EBIT/interest coverage was lower in Q1-3 '23, at 2.66X, vs. 3.64X in Q4 2022.
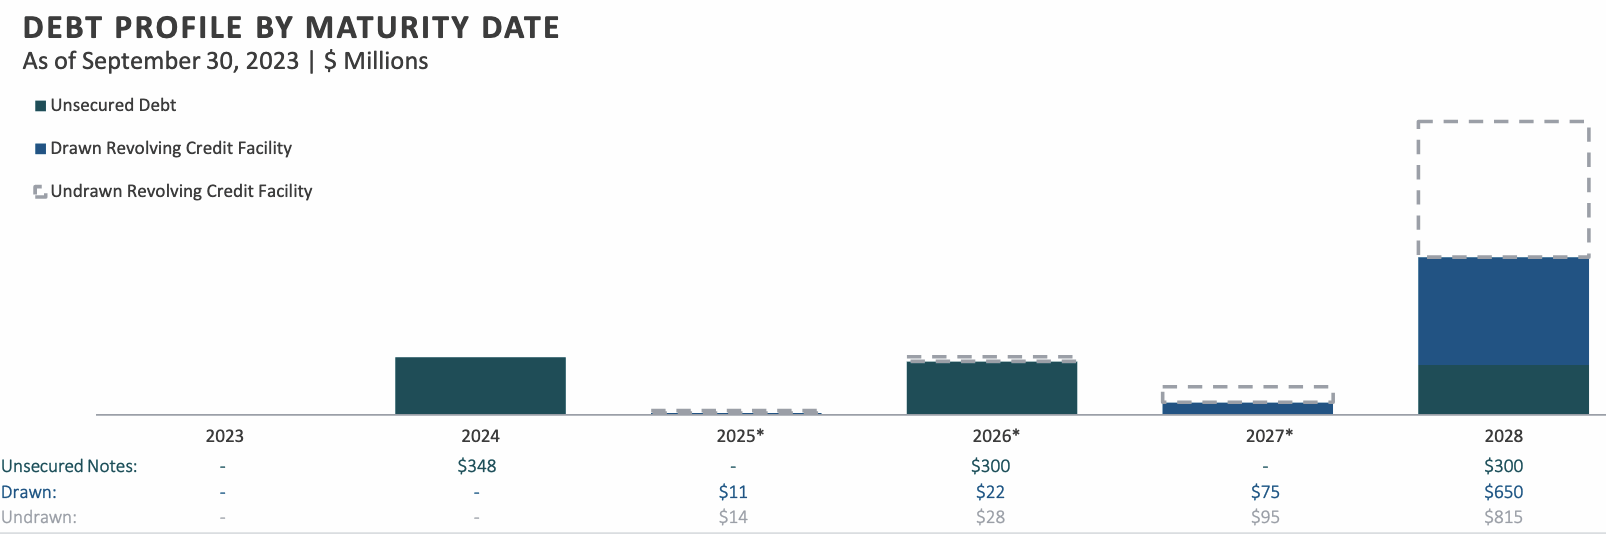
The earliest debt maturity is $348M in unsecured Notes maturing in November 2024, with another #400M in notes maturing in 2026 and 2028. The $1.7B credit revolver matures in June 2028.
TSLX had $952M of unfunded revolver capacity as of 9/30/23, vs. $197M of unfunded portfolio company commitments eligible to be drawn.
TSXL's debt is rated lower investment grade by Moody's, S&P and Fitch.
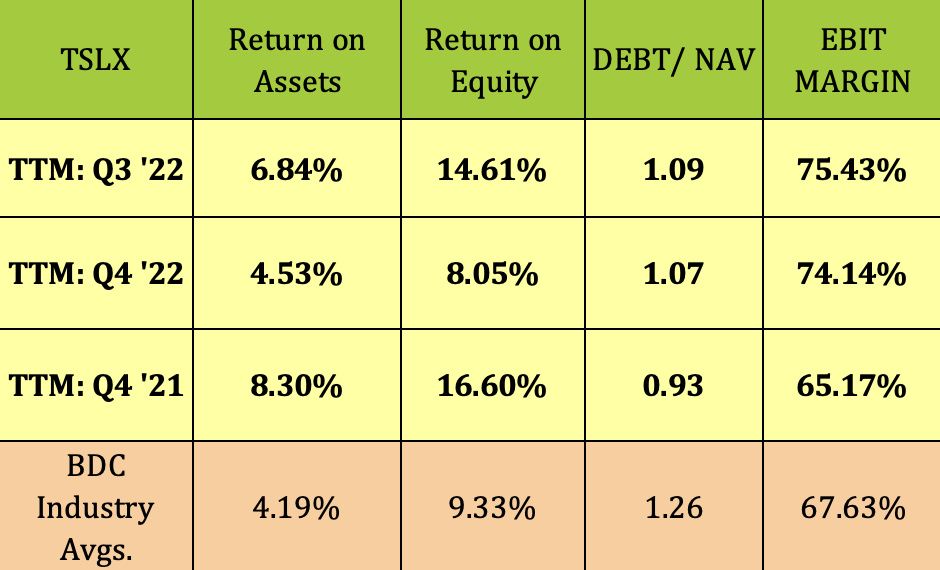
The debt leverage has been stable in 2023, ending the quarter at 1.09X. Profitability figures have all improved, especially ROE, which jumped from 8% to over 14%. TSLX's profitability and debt leverage were all superior to BDC industry averages.
Wrapping it up, we feel that TSLX is one of the stronger BDC's. Management is doing a good job of managing credit risk, borne out by the positive realized gains figures thus far in 2023 and in 2022.
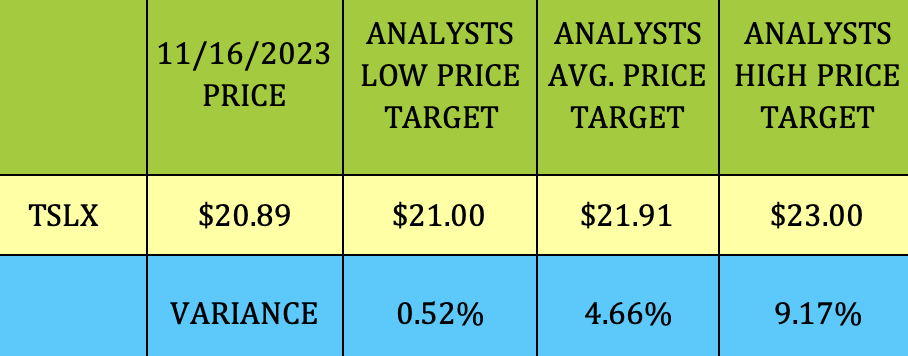
On the technical side, TSLX is oversold on its stochastic chart, and is only 1.6% below its 52-week high. At $20.89, it was ~even with Wall Street analysts' lowest price target of $21.00, and just 4.66% below their average price target of $21.91. Its most recent rating was a downgrade from B. Riley from Buy to Neutral, with a $22.00 price target.
We'd like to eventually add some more shares, but now is not the time. We rate TSLX a Hold for now - we'll wait for the next market pullback before buying more shares.
All tables furnished by Hidden Dividend Stocks Plus, unless otherwise noted.
For further details see:
Sixth Street Specialty Lending: Outperforming, Strong Earnings