CATC - SMDV: Dividend Growth ETF With A Bank Problem
2023-11-26 07:52:24 ET
Summary
- ProShares Russell 2000 Dividend Growers ETF implements an equal-weight methodology and a dividend growth strategy in small caps.
- SMDV looks attractive regarding long-term volatility, dividend growth and quality metrics, but there’s an issue: it is overweight in regional banks.
- Investors looking for the safety of dividend-growth and equal-weight investing styles should probably look elsewhere.
This article series aims at evaluating ETFs (exchange-traded funds) regarding past performance and portfolio metrics. Reviews with updated data are posted when necessary.
SMDV strategy and portfolio
ProShares Russell 2000 Dividend Growers ETF ( SMDV ) started investing operations on 02/03/2015 and tracks the Russell 2000 Dividend Growth Index. It has a portfolio of 101 stocks, a trailing 12-month distribution yield of 2.84% and a total expense ratio of 0.40%. Dividends are paid quarterly.
As described in the prospectus by ProShares , the fund invests in “ companies that are currently members of the Russell 2000 Index, have increased dividend payments each year for at least 10 consecutive years and meet certain market capitalization and liquidity requirements ”. Constituents are in equal weight with a maximum of 30% in any sector. The underlying index is reconstituted annually in June and rebalanced quarterly.
SMDV invests exclusively in U.S. companies, with 54% of assets in small caps and 46% in micro-cap companies. SMDV is more expensive than the parent index Russell 2000 ( IWM ) regarding price/earnings and price/cash flow ratios. However, it is a bit cheaper in price/book, as reported in the next table. Earnings growth (trailing 12 months) is inferior to the benchmark.
| SMDV |
| IWM |
| Price/Earnings |
| 12.94 |
| 11.47 |
| Price/Book |
| 1.34 |
| 1.61 |
| Price/Sales |
| 1.02 |
| 1 |
| Price/Cash Flow |
| 8.81 |
| 7.52 |
| Earnings growth |
| 11.80% |
| 21.09% |
The fund is overweight in financials, with 31% of asset value in this sector, and as much as 27% in banks. It is heavy also in industrials (23.1%) and to a lesser extent in utilities (17.8%). Other sectors are below 9% individually and 29% in aggregate. Compared to the Russell 2000 index, SMDV overweights the top 3 sectors listed above (especially utilities), along with materials and consumer staples. It massively underweights healthcare, technology, consumer discretionary, and completely ignores energy.
SMDV sectors (chart: author; data: ProShares, iShares)
Positions are in equal weights on rebalancing dates, but they drift with price action. The current top 10 holdings, representing 11.6% of asset value, are listed below with fundamental ratios. These are the constituents with the highest momentum since the last rebalancing. The largest holding weighs 1.22%, so risks related to individual stocks are low.
| Ticker |
| Name |
| Weight |
| EPS growth %TTM |
| P/E TTM |
| P/E fwd |
| Yield% |
| HNI Corp. |
| 1.22% |
| -66.06 |
| 42.08 |
| 15.93 |
| 3.27 |
| Kadant Inc. |
| 1.21% |
| -3.88 |
| 26.81 |
| 26.88 |
| 0.44 |
| Horace Mann Educators Corp. |
| 1.18% |
| -123.45 |
| N/A |
| 25.04 |
| 3.96 |
| Universal Corp. |
| 1.18% |
| 35.72 |
| 11.35 |
| N/A |
| 5.80 |
| Peoples Bancorp, Inc. (Ohio) |
| 1.16% |
| -5.06 |
| 8.55 |
| 7.15 |
| 5.30 |
| Insperity, Inc. |
| 1.14% |
| 26.83 |
| 22.93 |
| 21.03 |
| 2.01 |
| Cambridge Bancorp |
| 1.13% |
| -38.83 |
| 12.37 |
| 12.03 |
| 4.55 |
| United Bankshares, Inc. (West Virginia) |
| 1.13% |
| 8.96 |
| 11.70 |
| 12.05 |
| 4.42 |
| WD-40 Co. |
| 1.13% |
| -1.33 |
| 49.49 |
| 46.91 |
| 1.39 |
| Griffon Corp. |
| 1.12% |
| 124.09 |
| 33.14 |
| 10.80 |
| 1.30 |
Historical performance
Since 2/10/2015, SMDV has beaten IWM by about 8% in total return (see next table). The difference in annualized return is unimpressive (0.56 bps), but most importantly, it shows a significantly lower risk in drawdown and volatility, and a better risk-adjusted performance (Sharpe ratio).
| Total Return |
| Annual.Return |
| Drawdown |
| Sharpe ratio |
| Volatility |
| SMDV |
| 75.42% |
| 6.61% |
| -34.12% |
| 0.34 |
| 15.60% |
| IWM |
| 67.49% |
| 6.05% |
| -41.13% |
| 0.27 |
| 20.50% |
In previous articles, I have shown how three factors may help cut the risk in a dividend portfolio: Return on Assets , Piotroski F-score , and Altman Z-score .
The next table compares SMDV since 2/10/2015 with a subset of the S&P 500: stocks with above-average dividend yield and ROA, good Altman Z-score and Piotroski F-score, and a sustainable payout ratio. It is rebalanced annually to make it comparable with a passive index.
| Total Return |
| Annual.Return |
| Drawdown |
| Sharpe ratio |
| Volatility |
| SMDV |
| 75.42% |
| 6.61% |
| -34.12% |
| 0.34 |
| 15.60% |
| Dividend quality subset |
| 119.65% |
| 9.37% |
| -36.33% |
| 0.51 |
| 16.20% |
Past performance is not a guarantee of future returns. Data Source: Portfolio123
SMDV has lagged my dividend quality subset by a significant margin. However, ETF performance is real and the subset is simulated. My core portfolio holds 14 stocks selected in this subset (more info at the end of this post).
The annual sum of distributions has increased from $0.73 per share in 2015 to $1.54 in 2022, which represents a 111% increase in 7 years. In the same time, cumulative inflation has been about 25%, based on CPI. SMDV has beaten inflation by a wide margin
SMDV distribution history (Seeking Alpha)
SMDV vs. competitor
The next table compares characteristics of SMDV and its closest competitor: WisdomTree US SmallCap Quality Dividend Growth Fund ( DGRS ).
| SMDV |
| DGRS |
| Inception |
| 2/3/2015 |
| 7/25/2013 |
| Expense Ratio |
| 0.40% |
| 0.38% |
| AUM |
| $753.87M |
| $275.51M |
| Avg Daily Volume |
| $3.71M |
| $1.27M |
| Holdings |
| 103 |
| 281 |
| Assets in Top 10 |
| 11.52% |
| 17.01% |
| Turnover |
| 33.00% |
| 51.00% |
| Dividend Yield ((TTM)) |
| 2.84% |
| 2.77% |
| Dividend Growth 5 Yr (annualized) |
| 9.98% |
| 6.64% |
| Dividend Frequency |
| Quarterly |
| Monthly |
Expense ratios and dividend yields are similar. SMDV is larger in AUM (assets under management) and more liquid in daily dollar volume. It has a smaller number of holdings, but is less concentrated due to its equal-weight methodology. It clearly beats DGRS in dividend growth, the theme of both funds. The only advantage of DGRS is a monthly distribution.
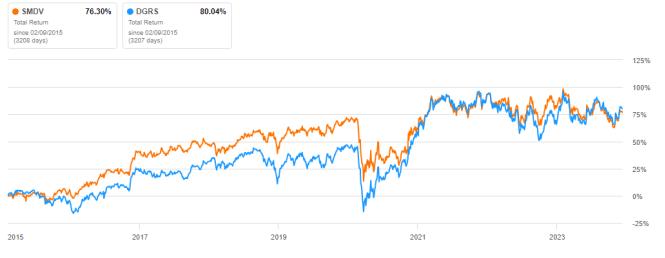
Since 2/9/2015, SMDV is shortly behind its peer regarding total return. Nevertheless, the difference in annualized return is below 0.5%.
SMDV vs DGRS since 2/9/2015 (Seeking Alpha)
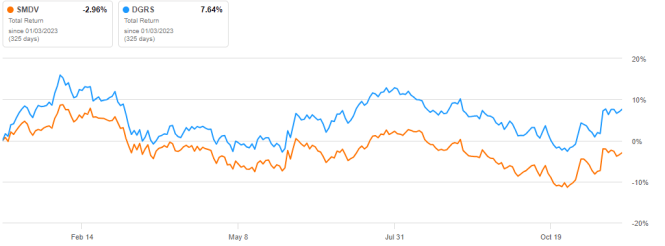
In fact, SMDV has outperformed DGRS until 2020, then it started lagging. It has underperformed its peer by about 10% in 2023 to date.
SMDV vs DGRS year-to-date (Seeking Alpha)
Portfolio quality
I have scanned holdings with my quality metrics, considering that risky stocks are companies with at least 2 red flags among: bad Piotroski score, negative ROA, unsustainable payout ratio, bad or dubious Altman Z-score, excluding financials and real estate where these metrics are less relevant. With these assumptions, 12 holdings are risky and they weigh 11.5% of asset value, which is acceptable.
Based on my calculation of aggregate metrics reported in the next table, SMDV is significantly superior to its parent index regarding portfolio quality.
| SMDV |
| IWM |
| Altman Z-score |
| 2.97 |
| 2.32 |
| Piotroski F-score |
| 5.44 |
| 4.61 |
| ROA % TTM |
| 4.45 |
| -0.24 |
Takeaway
ProShares Russell 2000 Dividend Growers ETF ((SMDV)) implements an equal-weight methodology and a dividend growth strategy in small caps. It is well-diversified across holdings, but overweight in financials. SMDV looks attractive regarding long-term volatility, dividend growth and quality metrics, but there’s an issue: banks represent about 27% of asset value. In March 2023, three small-to-mid size U.S. banks failed in five days. I don’t make predictions about what may happen next in the regional bank industry, but these events are clues of its fragility. SMDV may be a good choice for investors seeking exposure to regional banks, but those looking for the relative safety of a dividend-growth investing style should probably look elsewhere.
For further details see:
SMDV: Dividend Growth ETF With A Bank Problem