XSD - SMH: Biggest Is Also Best For Hedged Play In Semis
2023-05-10 23:47:52 ET
Summary
- The semiconductor space has exhibited high returns over the last decade, albeit with a high standard deviation.
- There are five adequately large, liquid, and non-leveraged semiconductor ETFs available.
- More complicated stock selection and weighting schemes haven't produced any benefits in performance.
- The VanEck Semiconductor ETF dominates in terms of options available and can be leveraged to produce a high-probability hedged trade using LEAPS.
In the realm of semiconductor sector-specific ETFs, there are five non-leveraged choices for investors that have assets over $500 million. These include, in order of size, the VanEck Semiconductor ETF ( SMH ), iShares Semiconductor ETF ( SOXX ), SPDR S&P Semiconductor ETF ( XSD ), First Trust Nasdaq Semiconductor ETF ( FTXL ), and Invesco Dynamic Semiconductors ETF ( PSI ).
ETF Overview
VanEck's Semiconductor ETF is the largest on the list with $7.48B in assets. It uses market capitalization for both the selection and weighting of 25 holdings. Given a lack of weight capping, it also has the highest concentration and includes both US and foreign stocks, with the latter's most notable being Taiwan Semi ( TSM ) as its second-largest holding.
The iShares Semiconductor ETF is similar to SMH in that both use market capitalization for stock selection and weighting, but SOXX differs in placing weighting caps on individual holdings and adds 5 holdings for a total of 30. The top 5 holdings cannot exceed 8% and the rest cannot exceed 4%. There is also a portfolio-wide 10% cap on ADRs. As is the case with SMH, Nvidia ( NVDA ) is the top holding.
The SPDR S&P Semiconductor ETF also uses market capitalization for stock selection but is an equal-weighted fund. It is the only equal-weighted choice on the list and it has the lowest concentration. You won't find ADRs in its 38 holdings as it focuses on US companies. Nvidia again finds itself in the top spot.
First Trust's Nasdaq Semiconductor ETF uses liquidity as a means to screen for eligible stocks to fill 30 holdings and focuses on US companies. Multiple factors including value, volatility, and growth are then used to weigh each holding. Price to cash flow is used for value. Volatility includes the historical volatility over one year and growth uses averaged price returns over 3, 6, 9, and 12-month periods. The top 5 stock weights are capped at 8% with the rest capped at 4%. Intel ( INTC ) is the top holding.
Invesco's Dynamic Semiconductors ETF is the smallest fund with $510.37M in assets. It's the most complicated on the list, using proprietary quantitative methodology to select and weigh stocks. The fund focuses on price and earnings momentum, quality, value, and management to fill out 30 holdings. Despite having some interesting choices in the top 10, NVIDIA still ends up at the top spot. The fund focuses on US companies.
All of the funds are passively managed.
Comparative Analysis
These funds are all highly correlated as would be expected, with the daily one-day return correlation over the last year all virtually at 1. They all provide concentrated semiconductor-specific exposure as intended.
Semis ETF 1 Year Daily Return Correlation (Michael Thomas)
When it comes to keeping expenses in check, lower is better. The three largest ETFs all share the same expense ratio of 0.35%. That forms a pretty strong baseline. An exception might be made when a higher expense ratio brings better performance along with it. The following table shows each fund's assets and expense ratios.
Semi ETF AUM & Expense Ratio (Michael Thomas)
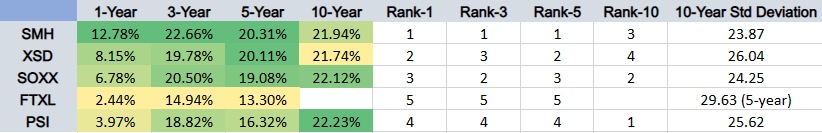
First Trust's FTXL ETF comes with the highest expense ratio and lowest performance across all three trailing return periods available for it and just goes to show that charging higher expenses doesn't correlate to better performance. In short, you shouldn't pay more for a passive fund that has a few extra filters in its passive screening process. As it turns out, the lowest expense ratio funds have produced the highest returns on average. VanEck's SMH ETF has had the strongest performance overall considering both short and long-term returns. The following table gives trailing returns for 1-year, 3-year, 5-year, and 10-year periods along with the 10-year standard deviation (sourced from Morningstar).
Morningstar Trailing Return & Standard Deviation (Michael Thomas)
It's interesting to note that SMH has the best overall performance and also has the lowest portfolio turnover at 22%. It exhibits the best average multi-period returns and the lowest long-term standard deviation. Invesco's PSI ETF did perform well over the 10-year period but begins lagging in shorter periods, culminating in very poor relative performance over the last year. It also happens to have the highest turnover of the bunch at 84%. First Trust's FTXL has the second-highest turnover at 58% and the worst performance with the highest risk as measured by standard deviation, albeit for a 5-year period. It seems a trend might exist between high turnover and lower performance. Both SOXX and XSD have turnovers of 32% and 36%, respectively. This again shows a trend in lower turnover and better overall performance.
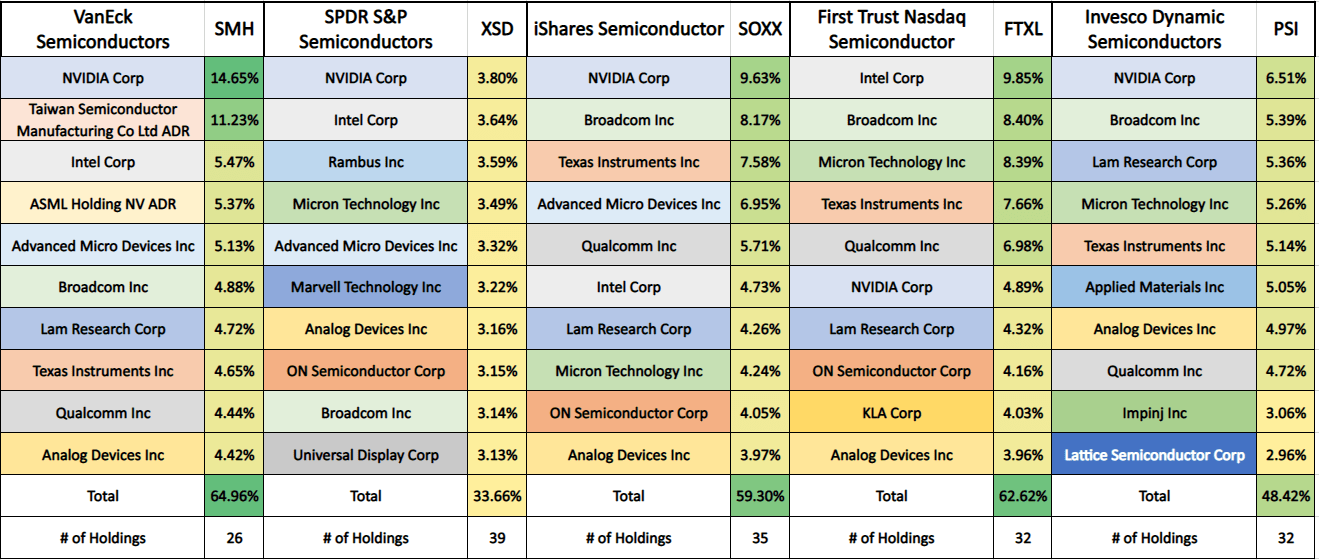
The top 10 holdings in each ETF share many of the same names but have a few outliers. SMH, SOXX, and FTXL all have relatively high concentrations in the top 10 holdings at 60-65%. This has proved beneficial in the case of SMH and SOXX's market cap-weighing schemes, but detrimental in FTXL's multi-factor scheme.
Semi ETF Top 10 Holdings Matrix (Michael Thomas)
There are plenty of differences in the top 10 holdings between funds, but the representation is largely dominated by NVIDIA, Broadcom ( AVGO ), Intel, Micron ( MU ), and Texas Instruments ( TXN ).
Liquidity is very important and is often rated by average daily volume but I view the average bid-ask spread to be a better gauge, though the two are obviously correlated. According to FactSet data, SMH has the lowest average spread of 0.02% and FTXL has the highest at 0.21%. SOXX has a low spread of 0.02%. XSD and PSI both have spreads of 0.10%. All of these are good and well below the 0.52% average of over 2,900 ETFs on the market . SMH and SOXX are great.
A final key consideration for some investors, myself included, when choosing ETFs is the breadth of available options markets. The following table show whether options are available and if they include weeklies and/or LEAPS.
Options Availability (Michael Thomas)
It's clear that SMH is the best all-around semiconductor ETF, combining the highest average returns over multiple periods, lowest long-term standard deviation, lowest bid-ask spreads, and most complete options market. The only negative is its high concentration, which has actually been a positive for performance.
Hedged LEAPS Option Trade Opportunity
We can use the high return characteristics of the semiconductor sector to create a high probability trade targeting annualized returns of 10%+ with significant downside protection. Since LEAPS options are a critical component of the trade setup, SMH fits perfectly. I consider the trade high probability because out of 2,265 daily one-year return periods over the last 10 years, SMH has returned more than 10% in 78% of the periods.
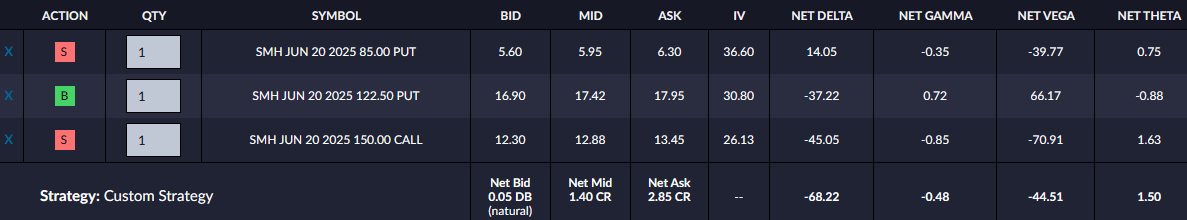
The setup involves owning 100 shares of SMH to write a covered call and use the proceeds to pay for a bear put spread using LEAPS options. This is a zero-cost hedge. With SMH currently trading at $123, you sell a Jun20 2025 150C covered call and buy a Jun20 2025 122.5P/85P bear put spread as shown in the example below.
LEAPS Order Setup (Michael Thomas)
This setup will provide 30.9% downside protection in return for capping potential price gains at 21.9%, or an annualized return of 9.8% + dividends. A current dividend yield of 0.97% pushes the annualized return over 10%. This is a lot less than the 20%+ average returns SMH has achieved over the last 10 years, but the goal isn't to match returns. The goal is to leverage the return potential into a shifted risk-reward spectrum. SMH is just the vehicle to accomplish this goal.
I have several hedged trades open at the moment utilizing many different ETFs. I have two SMH positions, one with LEAPS expiring Jan17 2025, and one with LEAPS expiring Jun20 2025.
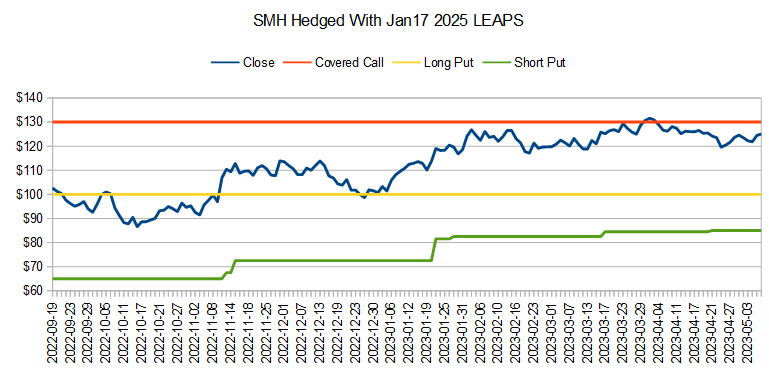
The following chart shows the progression of one SMH trade opened on 9/19/2022, which currently has an annualized return potential of over 13%. The higher potential of this trade over the example setup is largely due to the higher volatility present when the trade was opened and the net premium collected from continually rolling the short put option up in response to positive price action.
Jan17 2025 SMH Hedged LEAPS Position (Michael Thomas)
The current annualized return when considering the LEAPS expiration as the end date is 10.62%, which means I'm a little over 2/3rds of the way to my maximum profit potential.
Takeaway
In terms of base performance and ETF characteristics, SMH is my top pick for a sector-specific play. What could be viewed as a negative with higher concentration has served as beneficial. It has great liquidity and a broad options market, which allows a great deal of flexibility in tailoring risk-reward outcomes to individual preferences.
For further details see:
SMH: Biggest Is Also Best For Hedged Play In Semis