SMFTF - Smurfit Kappa: Leveraging Its Track Record To Create Value From The Proposed WestRock Acquisition
2023-11-28 10:11:15 ET
Summary
- Smurfit Kappa Group is fundamentally sound with improving operating efficiencies and returns greater than its cost of funds.
- The proposed acquisition of WestRock Company would more than double the size of SKG and potentially provide a margin of safety if SKG can improve WestRock's operations.
- There is an investment opportunity for SKG. WestRock shareholders should consider accepting SKG's offer rather than selling for cash.
Investment Thesis
Smurfit Kappa Group Plc (SMFTF) ( SMFKY ) (herein after referred to as SKG in this article) is fundamentally sound. Its returns are greater than its cost of funds and there are signs of improving operating efficiencies.
The challenge is that there is not enough margin of safety at the current price. But this is based on the view that the future would be similar to the past. This is set to change with the proposed acquisition of WestRock Company ( WRK ).
The acquisition would more than double the size of SKG. WestRock's historical return is about half of that of SKG. There would be a margin of safety if SKG could improve WestRock's operations making SKG an investment opportunity.
At the same time, I believe it is better for WestRock shareholders to accept SKG's offer rather than sell it for cash given the potential to improve the WestRock operations.
Business background
SKG is one of the leading providers of paper-based packaging solutions in the world.
Its products include containerboard, corrugated containers, and other paper-based packaging products. SKG has two reportable segments – Europe and Americas.
The Europe and the Americas segments are each highly integrated. They include a system of mills and plants that primarily produce a full line of containerboard that is converted into corrugated containers within each segment.
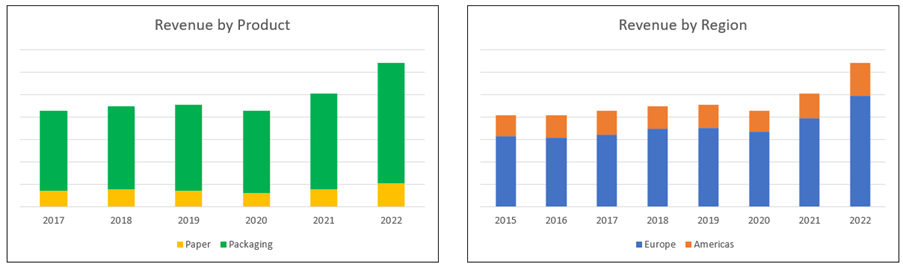
- In 2022, Europe accounted for about ¾ of its total revenue. The Group currently has facilities in 23 countries in Europe.
- The Americas segment includes operations in a number of Latin American countries, the United States and Canada. This segment also comprises forestry.
SKG derives its revenue from 2 major product lines – paper and packaging. As can be seen from Chart 1, packaging accounted for more than 4/5 of the total revenue.
Chart 1: Revenue profile (Author)
Note to Chart 1: The company provided the breakdown by product only from 2017.
My main interest in SKG is because of its planned reverse takeover of WestRock Company, a US packaging company that was formed in 2015.
Note the following in my analysis:
- For consistency with my WestRock analysis, I adopted the same analytical template with the analysis of SKG starting from 2015.
- WestRock financial year end is Sep 2023 whereas SKG financial year end is Dec. WestRock had already reported its FYE 2023 results. To provide the 2023 picture for SKG, I used the LTM results.
- In SKG’s Annual Reports, the financials were reported in Euro. As such I carried out my valuation in Euro and converted the final value into USD based on 1 Euro = USD 1.09.
Operating trends
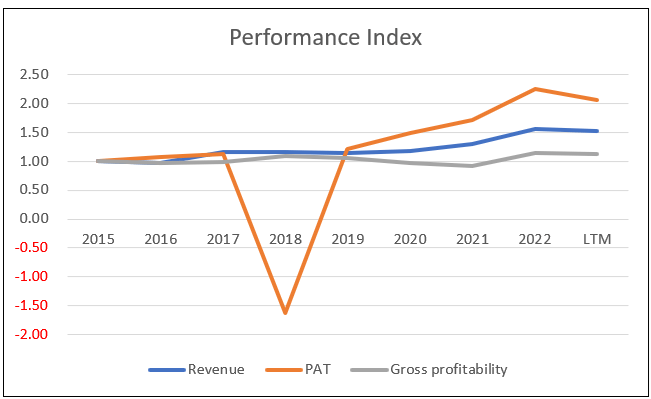
I looked at 3 metrics to get an overview of the overall performance – revenue, PAT, and gross profitability (gross profits / total assets). Refer to Chart 2.
Over the past 9 years revenue only grew at 5.4 % CAGR while PAT grew at 9.5 % CAGR.
The losses in 2018 were due to a Euro 1.3 billion write-off for the deconsolidation of its Venezuela business. The followed the “takeover” of the operations and business by the government of Venezuela. Without this, the PAT in 2028 would have grown compared to that in 2017.
The only concern that I have is the low growth in gross profitability of 1.5 % CAGR over the past 9 years.
Chart 2: Performance Index (Author)
Note to Chart 2. To plot the various metrics on one chart, I have converted the various metrics into indices. The respective index was created by dividing the various annual values by the respective 2015 values.
Operating returns
The growth in the PAT corresponded with improving operating returns. I defined this as after-tax operating profit divided by Total capital employed or TCE.
TCE = Equity + Debt – Cash.
From 2015 to LTM 2023, the return ranged from 9.7 % to 13.2 % with an average of 11.7 %. This is a good return when compared to its WACC of 7.8 %. Essentially this meant that SKG created shareholders’ value.
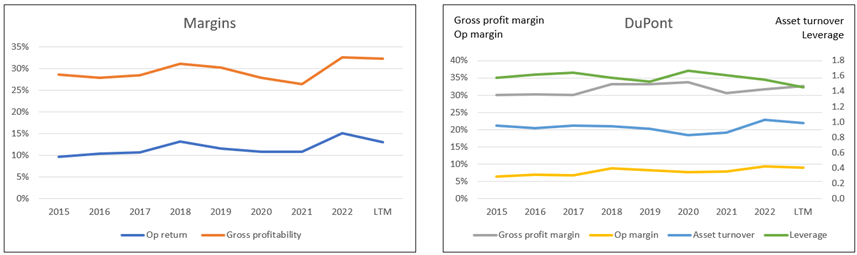
I also conducted a DuPont Analysis based on this return as shown in Chart 3.
- The operating margin accounted for the bulk of the variability of the return.
- There were marginal improvements in the asset turnover and leverage. Together with the gross profitability, I would conclude that there was some improvement in capital efficiency.
I was a bit disappointed in the smallish improvement in efficiency. Efficiency was one item mentioned many times in all the various Annual Reports and I expected better improvement rates.
Chart 3: Returns and DuPont Analysis (Author)
Note to Chart 3: The after-tax operating profit for 2018 was based on the average tax rate of 27% as the actual tax rate was negative.
Operating profit
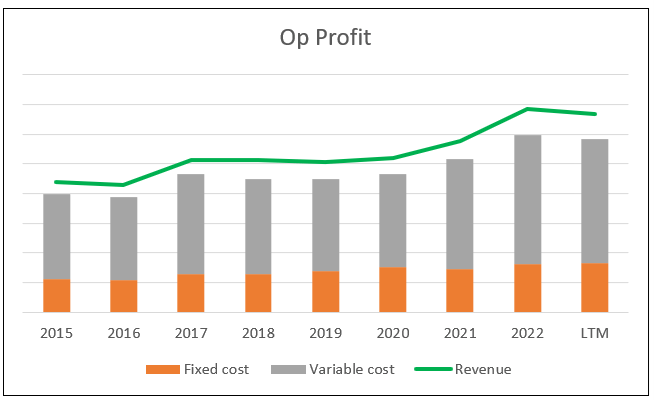
To understand the operating return better, I broke down the operating profits into fixed costs and variable costs.
Fixed cost = Selling, General and Administration expenses + Depreciation & Amortization.
Variable cost = Cost of Sales – Depreciation & Amortization.
Contribution = Revenue – Variable Cost.
Operating profit = Contribution – Fixed cost.
Contribution margin = Contribution / Revenue.
Chart 4 summarizes the past 9 years' performance.
- Contribution margin has improved over the past 9 years.
- Fixed cost ranged from 27 % to 33% of the total cost. This meant that higher sales will lead to disproportionately higher operating profits.
Chart 4: Operating profit analysis (Author)
Note to Chart 4: There is an operating profit if the Revenue is above the combined Fixed costs and Variable costs.
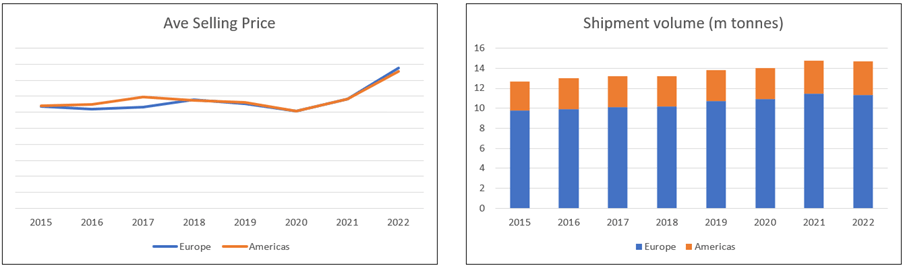
Volume vs Price
In my WestRock article , I had pointed out that there were extraordinarily high product prices over the past 2 to 3 years. SKG seemed to have the same experience as shown in Chart 4.
The difference with SKG was that there was both price and volume growth over the past 2 to 3 years.
From 2015 to 2023 LTM, shipment volume grew at 2.1 % CAGR while average selling price grew at 4.5 % CAGR.
Note that the shipment volume is a very rough estimate as it was based on the volume data presented in the “overview” section of the Annual Report. But I hope it gives you a sense that volume growth was about half of that due to price growth.
Chart 5: Volume and Price Trends (Author)
9 Months ended Sep 2023
For the 9 months ended Sep 2023 of this year, revenue and operating profit declined by 12 % and 10% respectively.
While the company did not give details on the decline, you should not be surprised. I suspect that the revenue decline was in line with the decline in the product prices.
I am looking at long-term trends and I have already accounted for this when looking at the 2023 LTM performance.
Growth
As mentioned earlier, revenue grew at 5.4 % CAGR over the past 9 years. This came from a combination of organic growth and acquisitions that benefited from the price trends.
There were acquisitions every year. The company did not provide a breakdown of its revenue growth into those due to acquisitions and organic growth.
But I deduced that organic growth played a bigger role.
Over the past 9 years, the company spent Euro 5.3 billion on net CAPEX and intangibles compared to Euro 1.6 billion on acquisitions. Assuming a proportionate contribution to growth, you would expect organic growth to account for more.
Industry growth
The global packaging industry is not a high-growth one as reported by various market researchers.
“The Packaging Market size is expected to grow… at a CAGR of 3.89% during the forecast period (2023-2028).” Mordor Intelligence
“The global packaging market… estimated annual growth rate during 2021–2026 is on average +4%.” Metsa
“… between 2018 and 2028 the global packaging market is set to expand by almost 3% per annum…” Source: Smithers
These results suggest that the company cannot rely on organic growth to grow significantly. You should not be surprised by the proposed acquisition of WestRock Company as this would more than double the size of SKG in terms of revenue and total assets.
Reinvestments
Growth needs to be funded and one metric for this is the Reinvestment rate. This is defined as:
Reinvestment with acquisitions = CAPEX & Acquisitions – Depreciation & Amortization + Net Changes in Working Capital.
I then determined the Reinvestment rate = Reinvestment / after-tax EBIT.
Acquisitions are an integral growth driver for the company. As such I have included the annual acquisition expenditure as part of the CAPEX.
From 2015 to 2023 LTM, SKG incurred Euro 3.8 billion for reinvestments. During the same period, it generated Euro 7.0 billion after-tax EBIT. This is equal to a 54 % Reinvestment rate.
There is another perspective on the Reinvestment rate that is derived from the fundamental growth equation.
Growth = Return X Reinvestment Rate.
Return = EBIT(1-t) / TCE.
I estimated the annual return on this basis. The average return from 2015 to 2023 LTM came to 11.7 %.
Taking the historical growth as 5.4 % and the Return as 11.7 %, the fundamental Reinvestment rate = 5.4 / 11.7 = 46 %.
Comparing the historical 54 % and the 46 %, I would conclude that management achieved a sustainable reinvestment rate.
Financial position
I would rate SKG's financial position as acceptable.
The negative side of its financial position can be summarized as follows:
- It has a 0.41 Debt Capital ratio as of the end of Jun 2023. As per the Damodaran Jan 2023 dataset, the Debt Capital ratio for the packaging and container sector was 0.38. It was 0.30 for the paper/forest products sector.
- As of the end of Jun 2023, it had Euro 615 million in cash. This was about 5.0 % of its total assets.
But this is more than offset by the positive side.
It is a cash cow. Over the past 9 years, it generated positive cash flow from operations every year. It generated about Euro 9.7 billion in cash flow from operations compared to its PAT of Euro 4.2 billion. This is a good cash conversion ratio.
Its interest expenses over the past 9 years averaged about 20 % of the operating profit.
It has a good capital allocation plan. Over the past 9 years, it generated about Euro 9.7 billion of funds from cash flow from operations. Refer to Table 1.
You can see that the cash flow from operations was more than sufficient to fund the dividends & buybacks, CAPEX and acquisitions.
Table 1: Sources and Uses of Funds (Author)
Valuation
What are the key takeaways from the above analysis to consider when valuing SKG?
- This is not a high-growth sector despite the acquisitions. It may be more appropriate to value SKG based on the single-stage model.
- I will ignore the Venezuela impairments.
- I should model revenue based on shipment volume and average selling price. This will enable me to take into account the extraordinary high prices over the past 2 years.
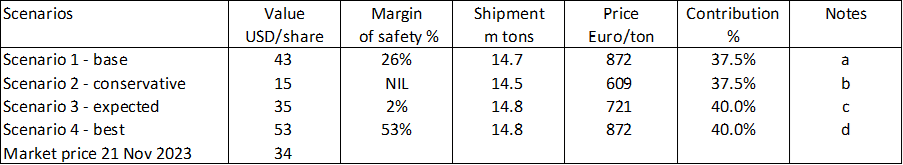
I considered 4 Scenarios in my valuation.
- Scenario 1 - base. This is based on the 2022 volume and average selling price. I do not consider this realistic as I expect the current selling price to come down.
- Scenario 2 - conservative. The volume was based on the past 4 years' average while the selling price was based on the 2020 value.
- Scenario 3 - expected. This assumes that the company can achieve the best past 4 years’ performance for the volume. But the selling price is an average of the past 3 years. This assumes that the current high prices would decline.
- Scenario 4 – best. This assumed that the volume, selling price, and contribution were from the respective past 4 years' best. I do not expect this to be achieved.
The results of the valuations are shown in Table 2. It shows some margin of safety for 3 Scenarios.
- While there is a 26 % margin of safety under Scenario 1, I do not expect this to be realistic as I expect prices to decline.
- There is not enough margin of safety in the expected Scenario 3 given my 30% target margin of safety.
- You can only get more than a 30% margin of safety in Scenario 4 where the parameters are unlikely to be achieved.
You could conclude that SKG is not an investment opportunity based on this. The valuation here is based on the view that the future is very much similar to the past.
But this is set to change significantly with the proposed acquisition of WestRock. So I suggest that you hold your judgement of the investment opportunity until you read the full article.
Table 2 Summary of valuation (Author)
Notes to Table 2.
a) Shipment and price based on 2022. Contribution was based on 2020 to 2023 average.
b) Shipment based on 2020 to 2022 average. Contribution based on 2020 to 2023 average. Selling price based on 2020.
c) Shipment based on best of 2020 to 2022. Contribution based of best of 2020 to 2023. Selling price based on 2020 to 2022 average.
d) All based on the respective best of 2020 to 2022/23.
Valuation model
I valued SKG using the Free Cash Flow to the Firm (FCFF) model as represented by:
Value of firm = FCFF X (1+g) / (WACC - g)
Value of equity = Value of firm - Debt - Minority Interests + Cash & Non-Operating Assets.
FCFF = EBIT(1-t) X (1 – Reinvestment rate).
My valuation model is based on the operating profit model shown in Chart 4.
- Revenue is broken down into volume X selling price.
- EBIT = Contribution – Fixed costs.
- Contribution = Revenue X Contribution margin
The key variables in my model are:
- Volume. This was based on the total tonnage data for all the segments.
- Price. This was the average selling price. I derived this by dividing the total segment Revenue by the total shipment tonnage.
- Contribution margin. I derived the annual margin by dividing the annual Contribution by the respective annual Revenue.
- Fixed costs. I assumed this to be based on the 2020 to 2023 average of Euro 2,728 million.
- Other costs. The bulk of these are impairments. I assumed the average 2015 to 2023 of Euro million. Note that I excluded the Venezuela impairments.
- Reinvestment rate. I assumed this to be 50%.
- Forex. I Euro = USD 1.09 as of 25 Nov 2023.
If you want to see the details of the valuation model, I have provided a link to my valuation worksheet . In this worksheet, you can carry out your sensitivity analysis by varying the 7 parameters listed above.
WACC
The WACC was derived from a Google search of the term “SKG WACC” as shown in the Table 3. Note that the WACC for the various sources were based on the financials stated in Euro.
Table 3: Deriving the WACC based on Euro (Various)
Risks and limitations
There are 2 concerns here:
- No improvements in the operations.
- No change in the product mix.
In my valuation, I have taken a conservative approach assuming that there is no improvement in the operating returns. Based on my analysis, there is likelihood that this can be improved.
Any improvement in the operating returns will translate into lower Reinvestment rate. In my model, I assumed a 50% rate based on the average of the historical rate and the one based on the growth equation.
If the Reinvestment rate is reduced to 40%, the margin of safety would increase from 2 % to 24 %. I would treat this as another margin of safety.
The other weakness of my model is that I took an overall picture of the products. SKG reported its product volume by product types. These include Kraftliner, containerboards, other paper and board, corrugated, solid board packaging, and other paper-based packaging.
The volume of each product types changes yearly. While the company has not provided the selling prices of each product type, I suspect that they are not the same. But in my analysis, I have aggregated the volume for all the products to derive an overall average selling price.
You can see that there will be changes to the selling prices if there are changes in the product mix. One way to mitigate this is to rely on the margin of safety.
Conclusion
There are 2 key conclusions that can be drawn from the analysis and valuation:
- Is SKG an investment opportunity?
- From a WestRock shareholders perspective, is the SKG offer a good one?
Investment opportunity
SKG is fundamentally sound based on the following:
- It has improving operating returns. Its average returns are greater than its cost of funds.
- It has a good capital allocation plan.
- Over the past 2 to 3 years, it not only benefitted from the high product price tailwinds, but managed to grow its shipment volume.
- While the packaging sector is a mature one, it has managed to grow via acquisitions based on a sustainable Reinvestment rate.
- While the Debt to Capital ratio is on the high side by sector standards, the interest expense is only about 20 % of its after-tax operating profit. Besides it is a cash cow.
The only negative issue is that my valuation showed that there is not enough margin of safety. But this is because I have taken a conservative approach assuming that there will not be improvements in the operating returns.
More importantly, I assumed that the future is not going to be different from what happened in the past. This is of course not true if the WestRock acquisition is completed.
So wait till you read the following sections before you come to any conclusion about the investment opportunity in SKG.
WestRock shareholders perspective
Under the offer, for every one WestRock share, the WestRock shareholder will receive one share of SKG plus USD 5 in cash.
One simple to view the offer is to consider that both WestRock and SKG share price reflected their business value. This is on the basis that there is no margin of safety for both companies based on their respective Scenarios 3.
- SKG market price is USD 34 per share.
- WestRock market price is USD 37 per share.
WestRock shareholder will receive cash of USD 5 per share plus one SKG share. Altogether the WestRock shareholder will receive an equivalent of USD 34 + 5 = 39 per share for his WestRock share that is priced at USD 37 per share. Don't you think this is a fair exchange?
Again, wait till you read the next section.
Smurfit WestRock
We know that SKG will be a much larger entity following the completion of the WestRock acquisition. The "new" entity - Smurfit WestRock - combined revenue and total assets would be about 3 times larger than those of just SKG.
At the same time, there is the potential of SKG improving the returns of WestRock. Table 4 give you some sense of the differences between them.
Table 4: Comparative performance (Author)
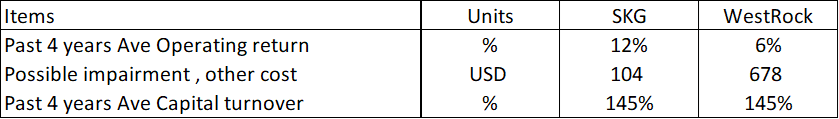
If SKG could improve the business operations of WestRock, the value of the combined Smurfit WestRock would go up. I will illustrate this with the impairment example.
In my valuation of WestRock, I had assumed that there will be future impairments. If this can be avoided due to better business operations, there would be additional value.
I carried out a simple analysis assuming the following under Scenario 3 for both companies.
- The WestRock impairment would be reduced to be the same value as that for SKG. This would result in additional USD 10.07 billion intrinsic value.
- But the cash under Smurfit WestRock would be reduced by USD 1.28 billion. This is due to the USD 5 per share paid for the 256 million shares of WestRock.
Based on the above, there would be a net gain to Smurfit WestRock of USD 8.79 billion.
The total number of shares in Smurfit WestRock would be 514 million based on a simple addition of the number of shares of the 2 companies. This works out to be an additional intrinsic value of USD 17 per share to the shareholders of Smurfit WestRock.
Viewed from this perspective, the offer is a good deal for both the shareholders of SKG and WestRock.
- For SKG, the margin of safety under the expected Scenario 3 increases to 51 %. This is now an investment opportunity.
- For the shareholders of WestRock, it is better to accept SKG offer rather than sell the shares for cash.
Note that while SKG carried out acquisitions every year, they averaged about Euro 200 million per acquisition. In contrast, the WestRock acquisition would be equal to about Euro 10 billion. I have assumed that SKG would still be able to improve WestRock operations despite being a much bigger acquisition.
The crux of my thesis is that given SKG track record, it would be in a better position to improve WestRock operations compared to WestRock management. I hope I have made a case for this in this article as well as in my previous WestRock article.
It may take some time for the value to be realized. But I am a long-term value investor holding onto stocks for 5 years or more. I hope you can understand why I think that this is a win-win proposal for both the shareholders of SKG and WestRock.
Of course there is completion risk to worry about. But I do not have the expertise to assess this.
Editor's Note : This article was submitted as part of Seeking Alpha's Top 2024 Long/Short Pick investment competition , which runs through December 31. With cash prizes, this competition -- open to all contributors -- is one you don't want to miss. If you are interested in becoming a contributor and taking part in the competition, click here to find out more and submit your article today!
For further details see:
Smurfit Kappa: Leveraging Its Track Record To Create Value From The Proposed WestRock Acquisition