OWL - Snowball Your Passive Income With These 2 High-Growth Dividend Stocks
2023-06-23 08:05:00 ET
Summary
- Dividend growth stocks plus time can be the formula to generate a huge snowball of passive income.
- Such stock buying opportunities are today abundant.
- We highlight two of our favorite dividend growth opportunities today.
Co-produced by Austin Rogers
Many investors assume that achieving strong total returns is the only worthwhile goal in stock investing.
And it is true that total returns are always a worthy metric to consider.
But it isn't the only worthwhile goal investors can pursue. Sometimes, the investment community and financial media make it seem as if beating the S&P 500 ( SPY ) is the "be all, end all" of investing, and if you aren't beating the S&P 500 or at least trying to, you might as well just invest in the index and accept market returns.
Don't get us wrong. For those who don't wish to pay any attention to the stock market, buying a broad-based index is perfectly fine.
But at High Yield Investor, we would make two important contentions:
- Total returns, while important, are not the only worthy goal in investing.
- Putting your money into the S&P 500 only makes sense if your sole goal is to achieve solid but average total returns.
Another worthwhile goal in stock investing that can't easily be achieved via the S&P 500 is a large and rapidly growing passive income stream .
Some ETFs are designed with this goal in mind. Take, for example, three of the biggest and most popular dividend ETFs:
- Schwab US Dividend Equity ETF ( SCHD ).
- Vanguard Dividend Appreciation ETF ( VIG ).
- iShares Core High Dividend ETF ( HDV ).
These ETFs are, of course, merely collections of dividend stocks. The quarterly dividends of the ETFs can only grow insofar as the dividends of their underlying stock holdings grow.
And grow they have. Here's each ETF's total dividend growth since the beginning of 2012:
If you had put $100,000 into each of these three ETFs at their prices at the beginning of 2012...
- SCHD: $26.20.
- VIG: $54.65.
- HDV: $55.50.
...your invested dollars would today be worth much more:
| Invested Dollars in 2012 |
| Market Value Today |
| SCHD |
| $100,000 |
| $271,200 |
| VIG |
| $100,000 |
| $283,600 |
| HDV |
| $100,000 |
| $180,200 |
But what about passive income? Here is where the magic of dividend growth comes into play.
In this hypothetical scenario, the $300,000 invested into these three ETFs in 2012 yielded a fairly standard ~3%. But because of the dividend growth seen in the chart above, your hypothetical yield-on-cost (or dividend yield on invested dollars) would have surged to 5.5% to 10%!
| 2012 Dividends |
| 2012 Dividend Yield |
| TTM Dividends |
| Today's Yield-on-Cost |
| SCHD |
| $0.82 |
| 3.1% |
| $2.64 |
| 10.1% |
| VIG |
| $1.41 |
| 2.6% |
| $3.03 |
| 5.5% |
| HDV |
| $2.10 |
| 3.8% |
| $3.98 |
| 7.2% |
In 2012, your $300,000 would have yielded a total of $9,510 in dividends.
Over the last 12 months, the same amount of invested dollars would have generated $22,800 in dividends.
And that doesn't even include the additional dividends that would have been generated if you reinvested your dividend income!
This example shows why many investors choose to make their primary investing goal a large and growing dividend income stream , rather than total returns.
A total returns strategy implies that stocks will be sold eventually in order to cash in on the stock price appreciation. But many dividend growth investors ("DGIers") would like to retire someday on dividend income alone without needing to sell any of the principal.
At High Yield Investor, we find this a perfectly reasonable investment strategy and goal. But we also think that DGIers can do much better than simply investing in a dividend ETF.
When you invest in an ETF, you are basically buying all of its holdings (the overvalued and the undervalued), and your performance is by definition the average of all those holdings. If all of your money is in an ETF, you forego the opportunity to buy the dip in any particular stock that may or may not be in that index.
Let's look at two examples of great dip-buying opportunities in the world of dividend growth stocks that have the potential to outperform.
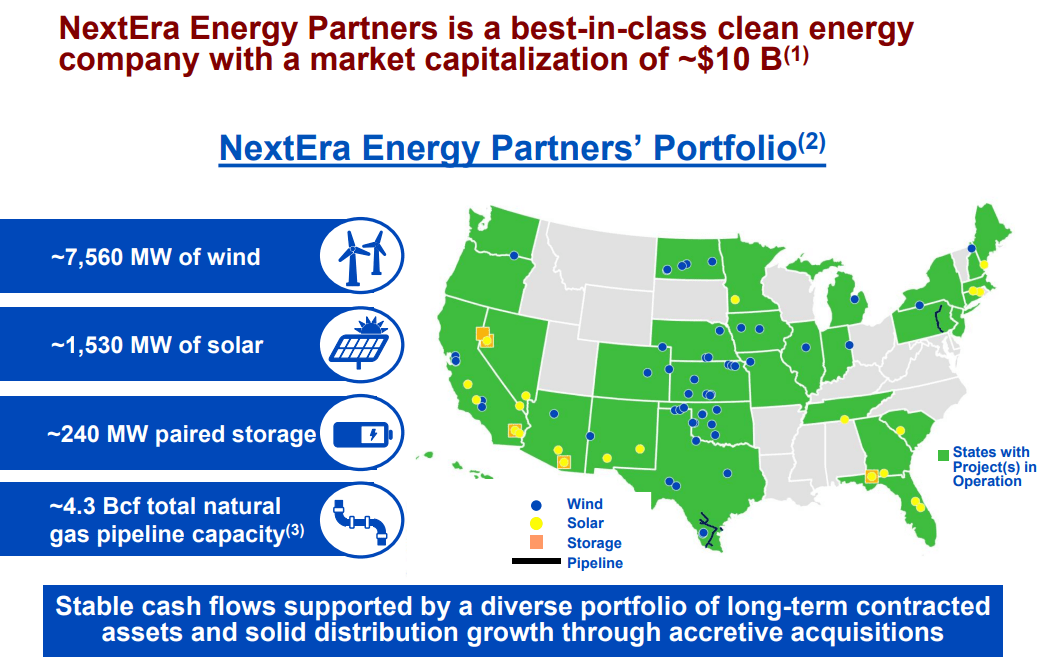
NextEra Energy Partners ( NEP )
NEP owns and operates a 9+ gigawatt portfolio of renewable energy assets and natural gas pipelines, although the company recently announced plans to divest of its gas assets to become a 100% pure-play renewables player.
(Brief explanatory note: Though NEP has "partners" in its title, the company is structured to avoid issuing a K-1 form).
NEP is sponsored and externally managed by NextEra Energy Inc. ( NEE ), the largest developer of wind and solar power generation facilities in the nation. Having such a powerful sponsor is what has given NEP the ability to rapidly grow its power generation portfolio from ~990 megawatts at its IPO in mid-2014 to 9.3 GW in Q1 2023 -- almost a 10x increase in less than 10 years!
Despite the external management agreement, the managers at NEE have demonstrated remarkable alignment with NEP shareholders over the years.
Last year, management made the decision to freeze incentive distribution rights ("IDR") fees so that further portfolio growth at NEP would flow more to the bottom line.
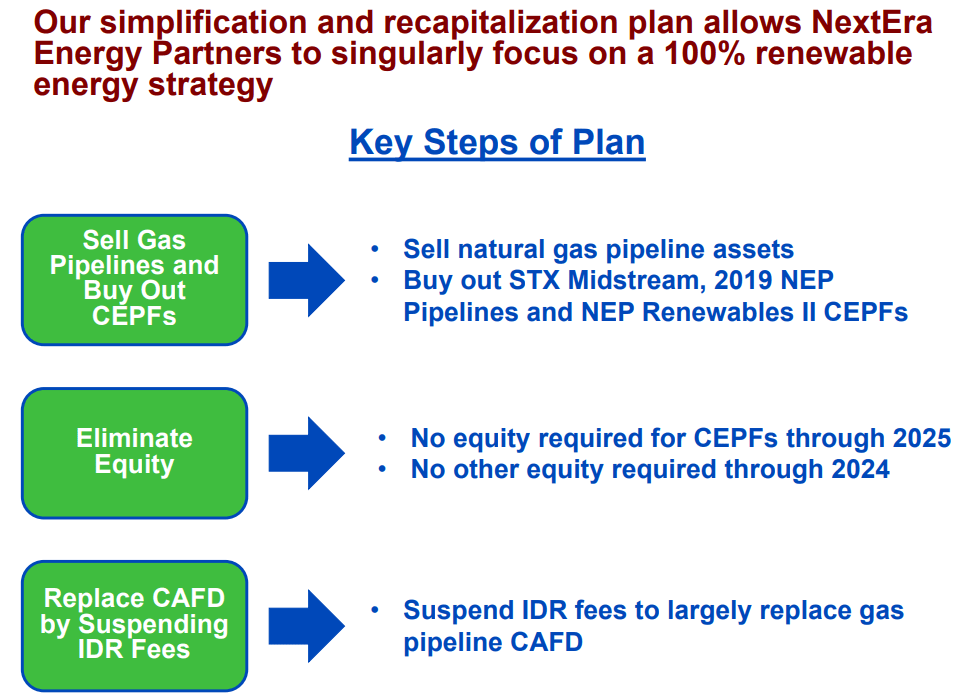
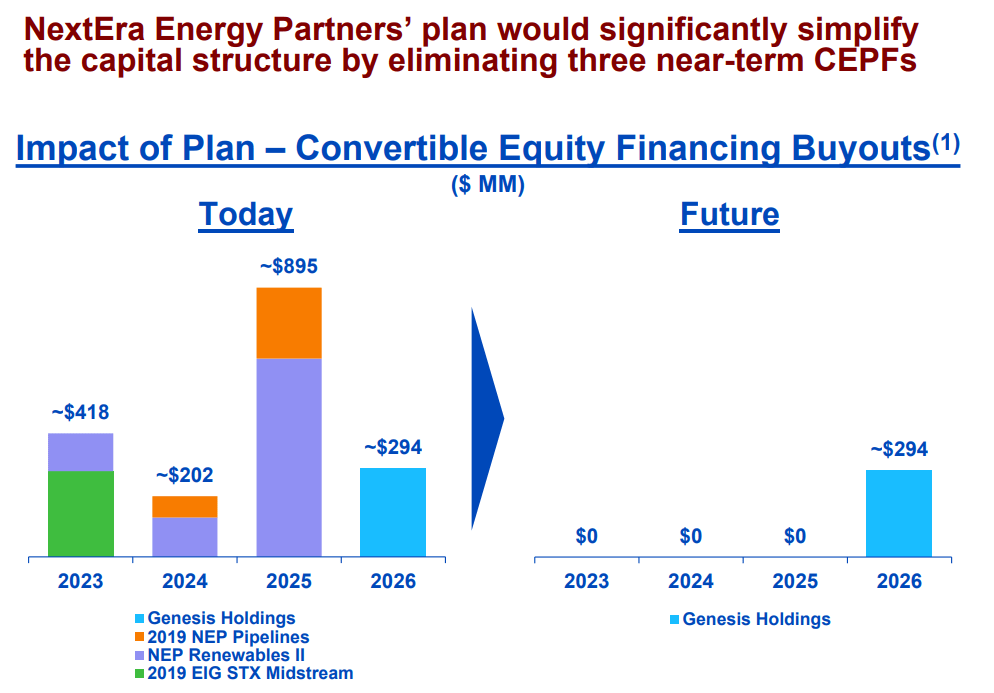
And now, this year, faced with a wall of convertible equity maturities in the next few years, management has suspended IDRs entirely through 2026 and announced a plan to sell NEP's natural gas assets (~20% of revenue) in order to buy out the convertible equity.
This move does a few significant things for shareholders.
- Eliminates the need for equity issuance until 2025 at the earliest.
- Mostly replaces lost cash flows from the natural gas pipelines by eliminating IDR fees.
- Makes NEP a 100% pure-play renewable power producer.
- Buys out all convertible equity through 2025.
Moreover, management has made clear that "NextEra Energy Partners currently has no plans to issue incremental convertible equity portfolio financings," which means that management likely will not be using this riskier and potentially dilutive form of financing in the future.
As long as interest rates remained ultra-low and NEP's stock price kept rising higher and higher, convertible equity worked out well for shareholders. But in lieu of those things, it is a huge burden. While it is unfortunate that NEP has to sell assets in order to eliminate the convertible equity, the end result will be a simpler and more streamlined balance sheet.
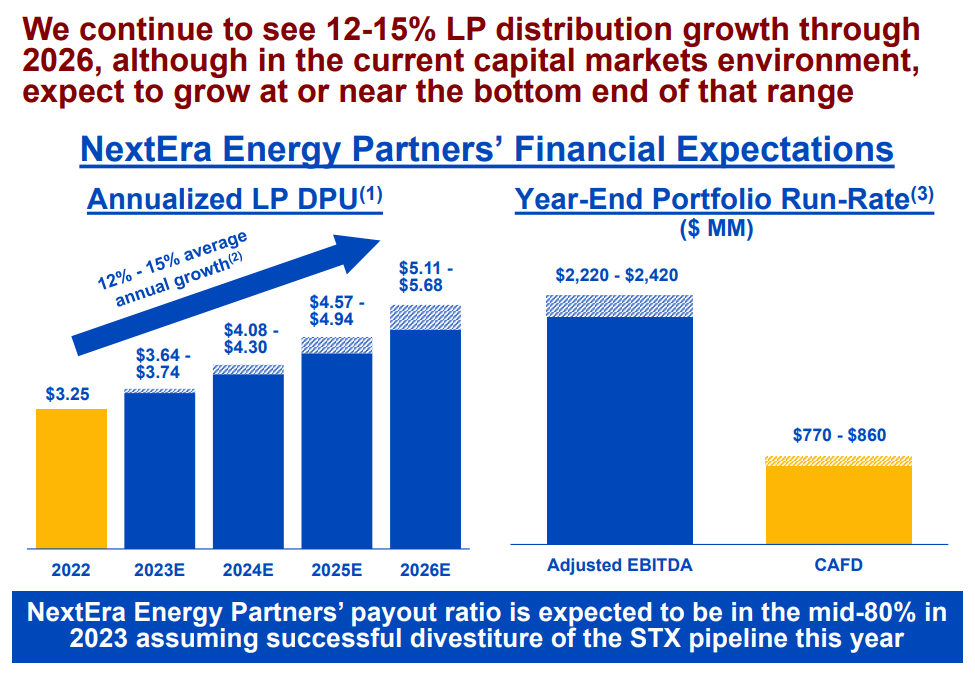
The move will also allow NEP to continue achieving its target dividend per share growth of 12-15% annually through 2026, although management attests that the current capital markets environment will cause dividend growth to come in at the lower end of this range.
If NEP does achieve this target dividend growth, buying NEP at its current share price of around $60 will result in a yield-on-cost of 9% by 2026.
While not the lowest risk investment, NEP with its 5.6% dividend yield is certainly one of the most compelling dividend growth opportunities in the market today.
Blue Owl Capital ( OWL )
In a March 2023 article , we discussed the fast-growing world of alternative assets and alternative asset managers. These types of assets are basically anything outside the realm of publicly traded stocks and bonds. The list includes commercial real estate, infrastructure, private equity, private credit, venture capital, hedge funds, art, fine wine, etc. As we stated in that article:
Alternative assets under management is projected to grow fourfold from 2010's level to $17.2 trillion in 2025, driven almost entirely by investments from institutions and high net worth individuals. Another estimate from analytics firm Preqin puts the total alternatives AUM at $18.3 trillion by 2026, nearly two times the $9.3 trillion under management at the beginning of 2022.
In order to diversify their investments and generate adequate returns, institutional investors like pension funds, endowments, and life insurance companies are investing heavily in alternatives. This is creating lots of opportunities for fast-growing alternative asset managers.
One of our favorite alternative asset managers is called Blue Owl Capital. It's relatively under the radar, because the firm was established only recently by the merger of Owl Rock and Dyal Capital. The company went public in 2021.
It turns out that 2021 was the ideal environment for asset managers because of low interest rates, ample fiscal stimulus, and the beginnings of the post-COVID economic rebound. But since then, all three of these tailwinds have turned into headwinds, hence the poor performance of OWL along with fellow asset managers Blackstone ( BX ) and Apollo Global Management ( APO ).
What do all three of these asset managers have in common? Substantial exposure to commercial real estate.
But CRE is only one of OWL's three primary investment strategies:
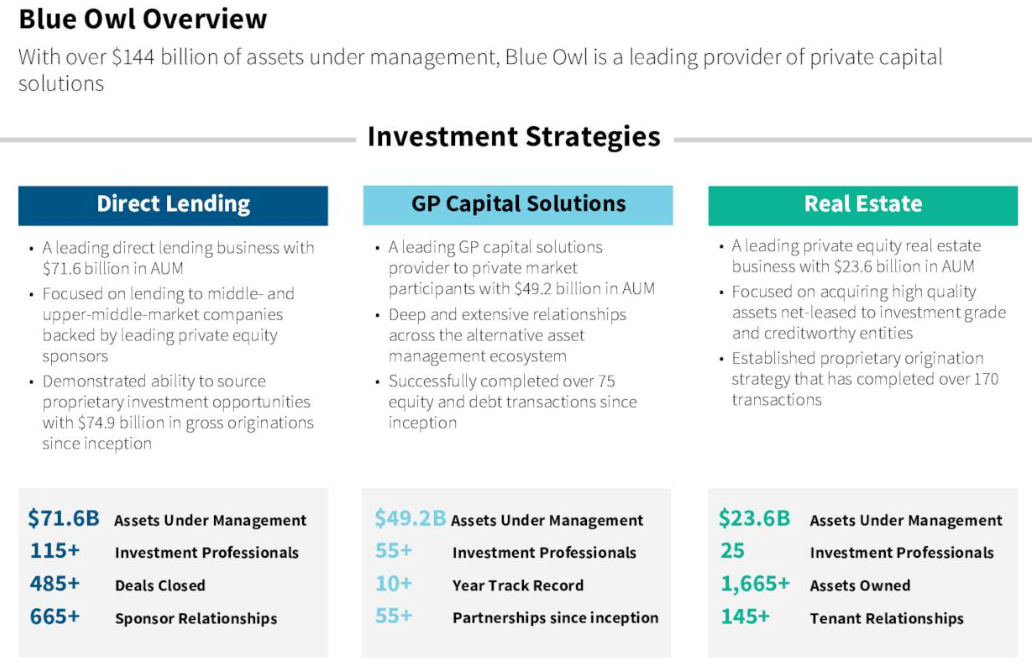
Notably, slightly under half of OWL's real estate exposure is in the form of the recently acquired STORE Capital, a provider of net lease sale-leasebacks to middle-market companies with single-tenant real estate.
The Direct Lending segment makes loans to middle-market businesses that are backed by private equity sponsors, and the GP Capital Solutions segment makes various kinds of investments in the general partners of alternative asset businesses.
Over the last two years, OWL has exhibited extraordinary growth in assets under management, fundraising, earnings, and dividends.
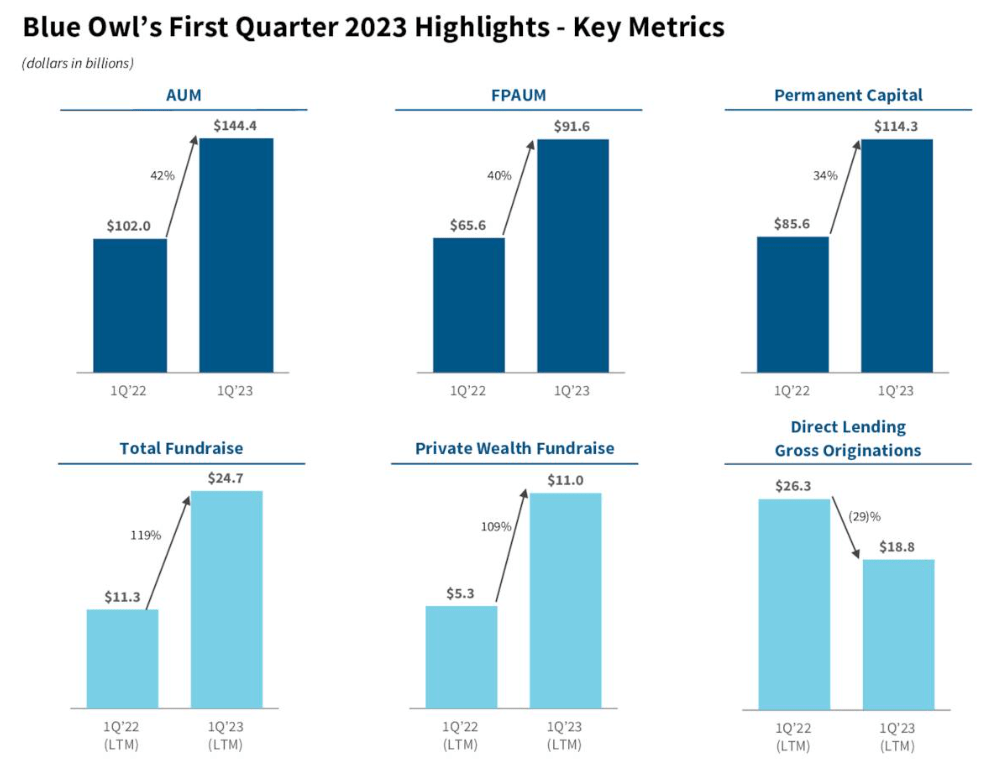
Notice from the above chart that permanent capital (funds invested with no termination date) makes up the majority (79%) of total AUM, which makes the fees generated from this AUM very stable and predictable.
Moreover, like all other asset managers, the vast majority of OWL's investable capital comes from AUM. Compared to $144 billion in AUM, OWL carries only $1.8 billion in debt.
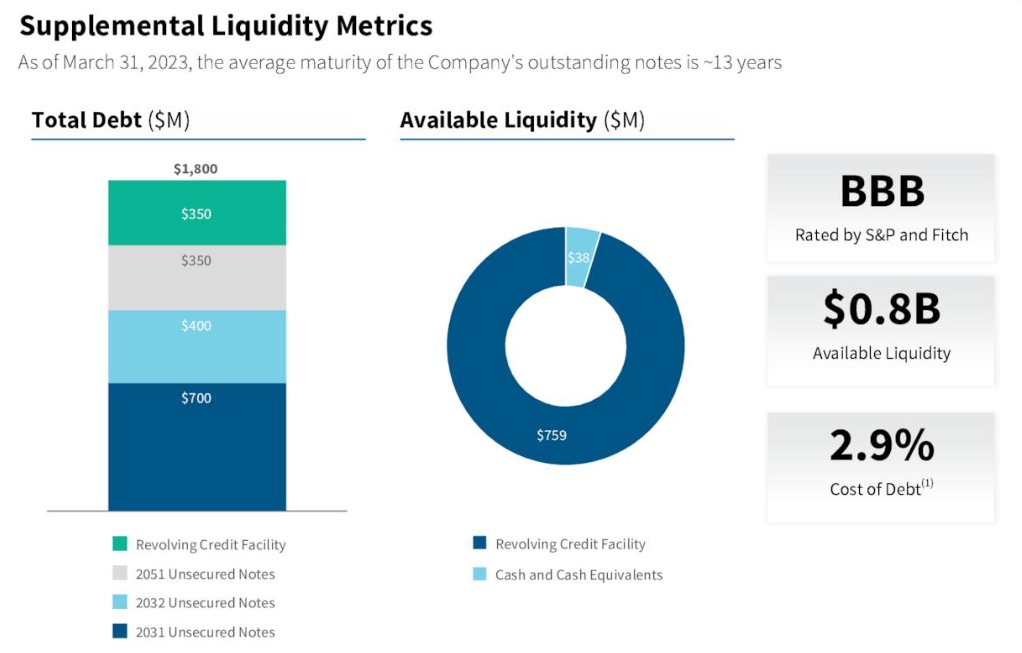
This debt is mostly very long-term in nature, with the earliest maturity not until 2031 and the latest in 2051. These unsecured notes were locked in at very attractive interest rates of 2.9%, in part due to OWL's investment grade credit rating of BBB.
Also like other asset managers, OWL's stable and capital-light model allows the company to pay out almost all of its distributable earnings as dividends. In Q1 2023, for example, OWL had a payout ratio of 93% after a 7.7% dividend hike. That's up from an 81% payout ratio for full-year 2022, but OWL's distributable EPS should grow over the course of this year, bringing the payout ratio back down into the 80% range.
Given just the dividend increases already announced, OWL is set to increase its dividend in 2023 by at least 28%.
That's pretty strong for a relatively low-risk company yielding 5.5%!
Bottom Line
There are ample attractive dividend growth opportunities in the market today. We happily admit that there are more solid buying opportunities available than we have the money to buy!
But when investable dollars become scarce, one must choose only the best and most opportunistic options.
Right now, NEP and OWL are two of the best buying opportunities we can think of for dividend growth investors. Between their 5.5% dividend yields and double-digit dividend growth potential, both should generously reward long-term shareholders from here.
For further details see:
Snowball Your Passive Income With These 2 High-Growth Dividend Stocks