TAN - Solar Edge: Pessimism Priced In Spotting Key Price Levels Ahead Of Q3 Earnings
2023-10-16 15:45:32 ET
Summary
- Solar stocks have suffered due to rising interest rates and oversupply in the industry.
- SolarEdge Technologies is a leading global power electronics company, but its stock has been negatively impacted by soft earnings and inventory issues.
- The valuation of SEDG is attractive, but the technical situation is precarious, and there are risks related to interest rates and geopolitical conflicts.
- I highlight important areas on the chart to watch over the coming weeks.
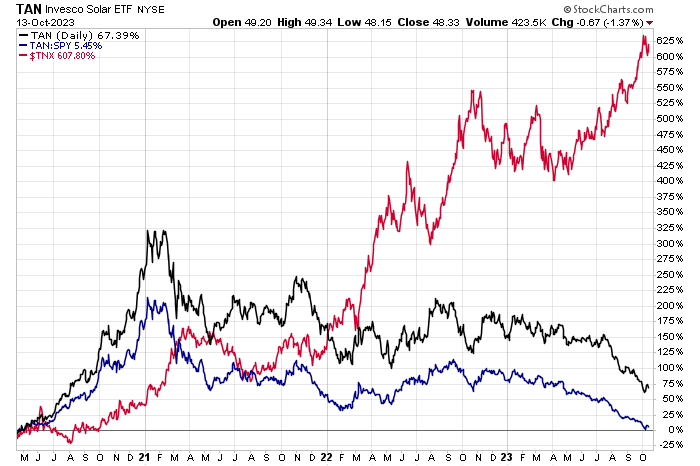
Solar stocks have been battered as the clean energy investment theme has come undone. Rising interest rates crimp key development projects while the industry is oversupplied. The Invesco Solar ETF (TAN) peaked in early 2021 – right when the “blue wave” took office. The Inflation Reduction Act, passed more than a year ago, offered a ray of hope for the embattled group, but surging costs of capital have overshadowed the bullish investment backdrop.
I reiterate my hold rating on shares of SolarEdge ((SEDG)). I see the valuation as attractive, but the technical situation is precarious, and I will highlight key price levels to watch ahead of company earnings due out next month. Moreover, unease in Israel is another key risk for this international firm.
Solar Stocks Suffer Amid Surging Interest Rates
According to Bank of America Global Research, SolarEdge Technologies (SEDG) is a leading global power electronics company headquartered in Israel. SEDG designs and sells semiconductor-based DC-optimized inverter and battery systems - comprising of DC optimizers to regulate output at module level, a string inverter to convert DC electricity to AC, and a DC-coupled battery to store electricity. SEDG sells its products to solar installers, EPCs, and distributors globally, with the largest focus on North America and Europe.
The Israel-based Semiconductor Materials & Equipment industry company within the Information Technology sector trades at a near-market 23.1 trailing 12-month GAAP price-to-earnings ratio and does not pay a dividend. Ahead of earnings slated for early November, the stock trades with a high implied volatility percentage of 77%, and short interest is elevated at 12.2% as of October 13, 2023.
Back in August, SEDG reported Q2 2023 operating EPS of $2.79, topping estimates by $0.23, while revenue of $991 million narrowly missed the consensus. What hurt the stock was a soft Q3 guide , and the downtrend has only accelerated since early August. Shares plunged more than 11% shortly after the report despite the 36% year-on-year climb in net sales, with particularly strong solar segment numbers. Its gross margin ticked up 0.1 ppt to 32.7%, but a new top-line guidance range of $880-$920 million was well short of the $1.05 billion estimate.
Ongoing inventory issues were a problem spot in Q2, and expect to hear more details on that front in the upcoming Q3 release. Product mix changes and lower sales in 3-phase storage may hurt margins, as well as weaker US sales. A 30.5% gross margin is forecasted by the management team. Higher interest rates and a drop in home investments amid weaker consumer spending are key risks today.
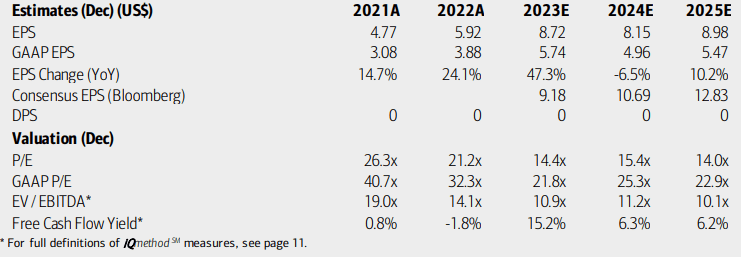
On valuation , analysts at BofA see earnings rising sharply this year but then backing off in 2024. Per-share profits in 2025 are seen as recovering, but the future is highly uncertain given SEDG’s volatile industry and ongoing geopolitical conflicts in Israel. The Bloomberg consensus outlook is more sanguine, but we have seen a slew of EPS downgrades recently, and I fear more may be to come post-earnings in a few weeks.
Still, there’s ample pessimism priced in today. SEDG’s forward P/E multiple, per Seeking Alpha, is in the low teens, while sales growth is seen as climbing at a rate of around 20%. Moreover, the firm is free cash flow positive even if we assume BofA’s dour forecast.
SolarEdge: Earnings, Valuation, Free Cash Flow Forecasts
If we apply a steeply discounted 20x multiple, compared to SEDG’s 5-year history and closer to the sector median, on normalized operating earnings of $8.50, then shares should be near $170, making the company a buy. You will also see that nearly all other valuation metrics are attractive on a relative basis, and many on an absolute basis.
Remarkably, Solar Edge sells for about 1.8x sales – almost 70% under its 5-year average. The stock has the hallmarks of a value or a value trap, so we must also weigh the technical picture, which I will outline later.
SEDG: Compelling Valuation Metrics
Seeking Alpha
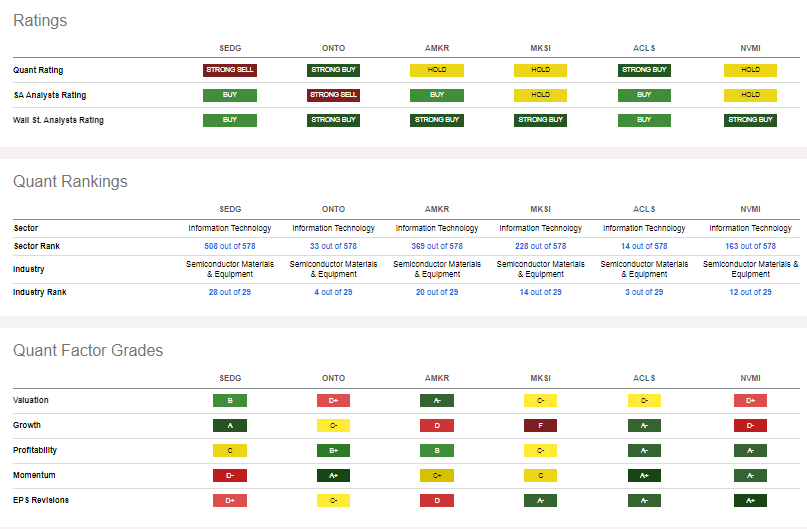
Compared to its peers , SEDG features a strong valuation given its low earnings multiple and price-to-sales figures. With a history of generating sizable free cash flow , the growth rating is also robust, though 2024 estimates may turn worse given the steep rise recently in interest rates and the calamity in Israel that analysts have not yet caught up to in their SEDG estimates. Stock price momentum is dreadful and EPS revisions are in free-fall, to put it bluntly.
Competitor Analysis
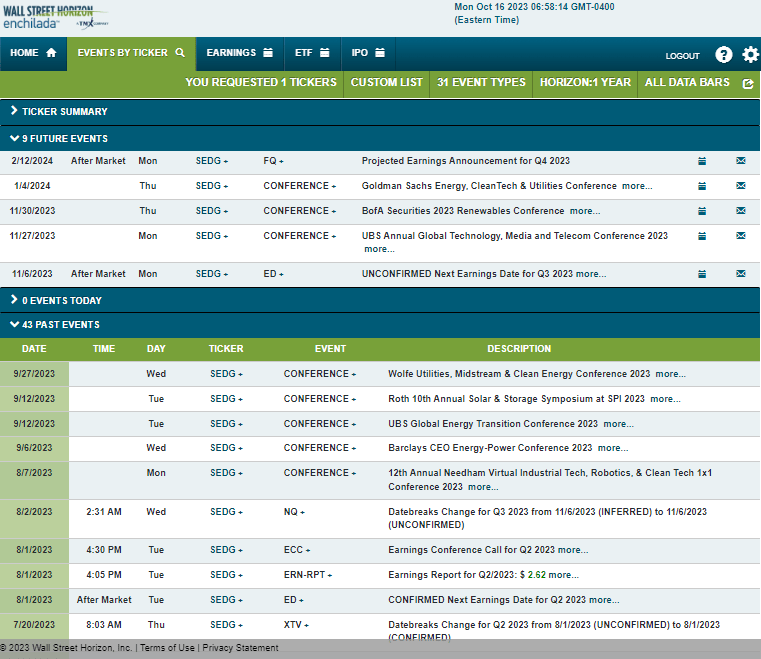
Looking ahead, corporate event data provided by Wall Street Horizon show an unconfirmed Q3 2023 earnings date of Monday, November 6 AMC. The management team is also slated to speak at a trio of industry conferences from late November through early January, which could bring about volatility.
Corporate Event Risk Calendar
The Technical Take
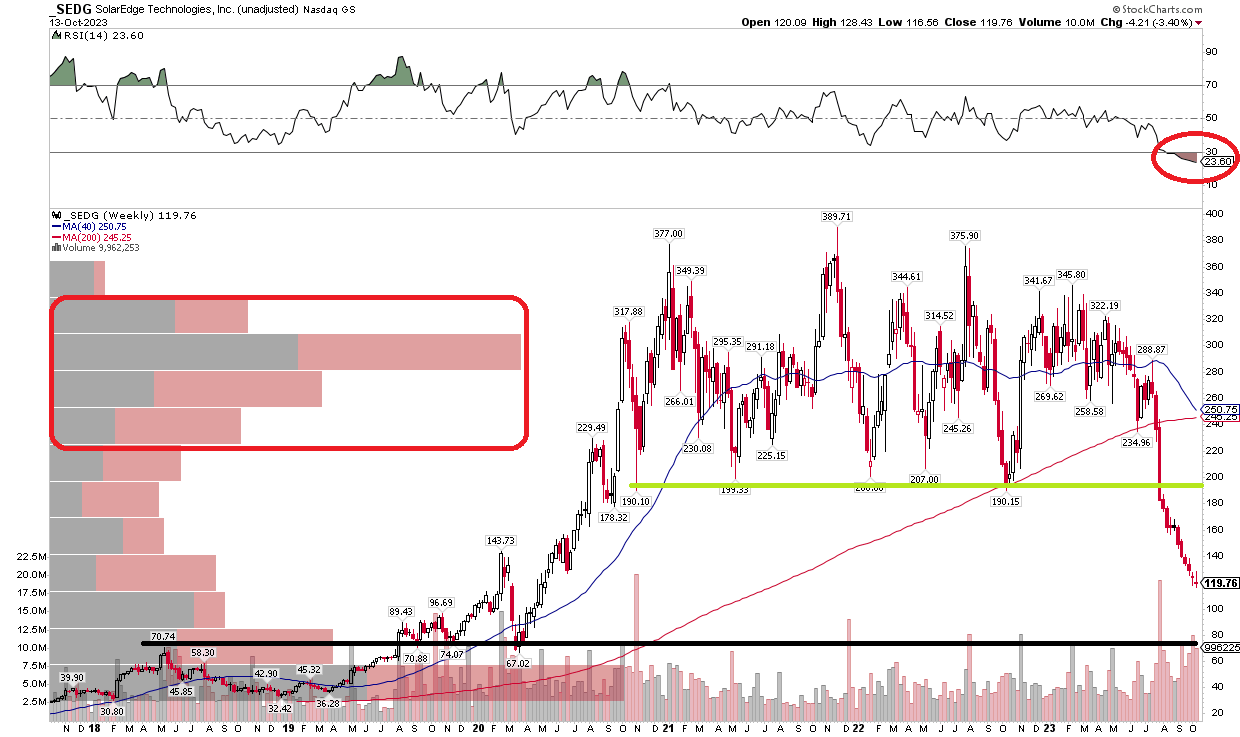
SEDG is down in 12 of the last 13 weeks. The solar stock is in a remarkable downtrend after breaking support under the $190 to $200 zone , a range I detailed when I last reviewed shares late last year. Notice in the chart below that SEDG has next apparent support in the $67 to $70 area – a previous bull/bear battle zone from mid-2018 through the March 2020 low. The stock is about as technically oversold as one can get, but a very low RSI momentum indicator in itself does not mean a bounce is due. In fact, oversold conditions can persist (and have with SEDG) for extended periods.
Buyers might not step up in earnest until shares fall further, in my view, according to the trends. Also problematic for the bulls is a high amount of volume by price beginning at $190 – all those shares traded from late 2010 through this past quarter will look to get back to even if SEDG stages a big up move. In terms of trends, the 40-week moving average is steeply negatively sloped, indicating the bears are in control while the long-term 200-week moving average is flattening with a bearish crossover between the two about to commence.
Buying on a capitulation event under $100 with a stop under the March 2020 low could work, but this is a classic falling knife right now after losing $190 support earlier this year.
SEDG: Plunging Stock Price, Support Under $100
The Bottom Line
I reiterate my hold rating on SEDG. The valuation is enticing, but the technicals and momentum are bearish, as both industry and regional uncertainties are exceedingly high heading into its Q3 earnings report.
For further details see:
Solar Edge: Pessimism Priced In, Spotting Key Price Levels Ahead Of Q3 Earnings