CSWC - Solid 10% Yield From Gladstone Capital And Gladstone Investment
2023-07-26 11:50:40 ET
Summary
- This article discusses dividend coverage for two BDCs currently yielding around 10% including supplemental dividends.
- I own both of these for the reasons discussed below including dividend increases and recently announced supplemental dividends.
- One of the largest mistakes that BDC investors make is focusing on historical dividend coverage instead of projected dividend coverage.
- Below I discuss many of the drivers used for projecting dividend coverage for these two BDCs.
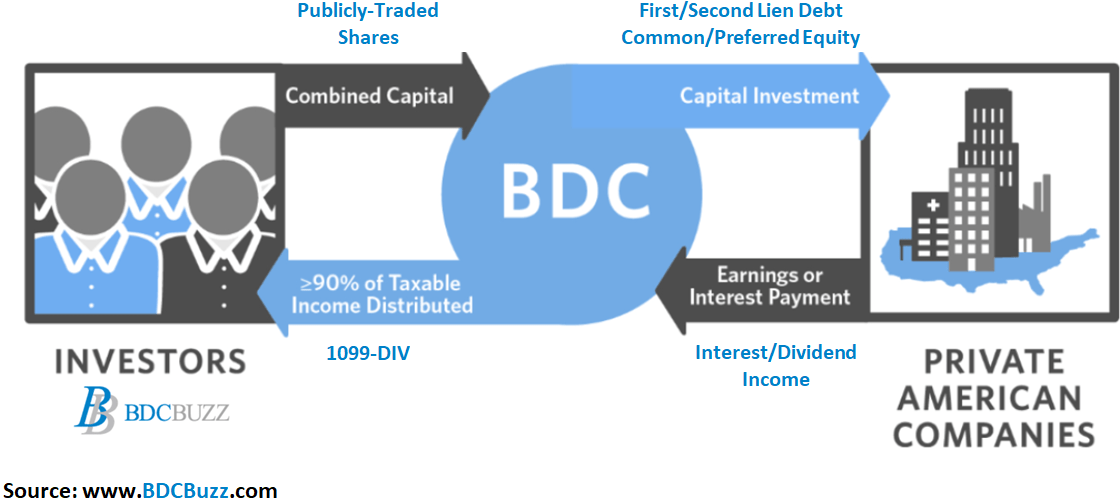
Quick Introduction To Business Development Companies
Business development companies ("BDCs") invest shareholder capital in privately-owned, small- and medium-sized U.S. companies generating income from secured loans and capital gains from equity positions, much like venture capital or private equity funds. Anyone can invest in BDCs as they're public companies traded on major stock exchanges.
The three biggest mistakes that new BDC investors make are:
- Focusing on historical dividend coverage instead of projected dividend coverage which is heavily reliant on portfolio credit quality.
- Not taking the time to dig into portfolio credit quality and assess which investments could potentially have a negative impact on earnings and NAV per share.
- Not understanding why BDCs trade at different prices and thinking that price-to-NAV is the only measure to find a "good deal." Please see the end of this article for a quick discussion of how BDCs are valued.
This article discusses dividend coverage for two BDCs that I currently own, Gladstone Investment ( GAIN ) and Gladstone Capital ( GLAD ), both of which are managed by Gladstone Management Corporation. Also, many BDCs have investment grade ("IG") bonds/notes for lower-risk investors building a balanced 60/40 portfolio (composed of 60% to 70% stocks/equities and 30% to 40% bonds or other fixed-income offerings). These notes were previously overpriced, but prices have declined and are now at attractive levels. Both GAIN and GLAD have bonds/notes that are currently yielding around 7% to 8% as discussed earlier this month in " Introduction To BDC Google Sheets ."
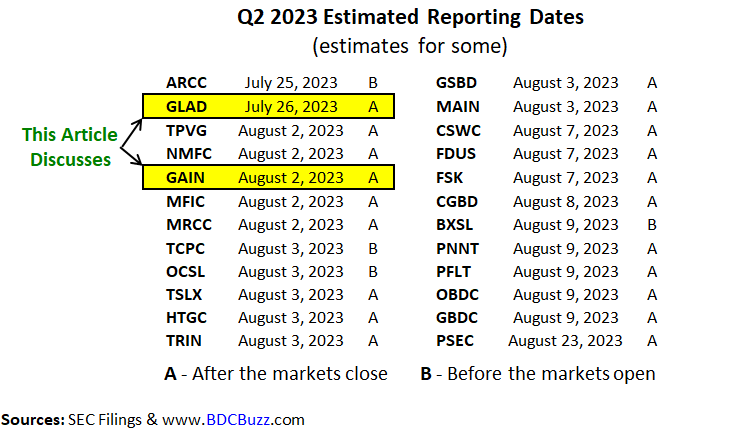
As mentioned earlier this week (in the article linked below), there's a good chance that BDC prices have recently headed higher as investors are trying to front-run the upcoming Q2 2023 earnings season which will likely be strong, similar to the previous three quarters. As shown below, GLAD will be reporting after the close of the markets today followed by GAIN next week.
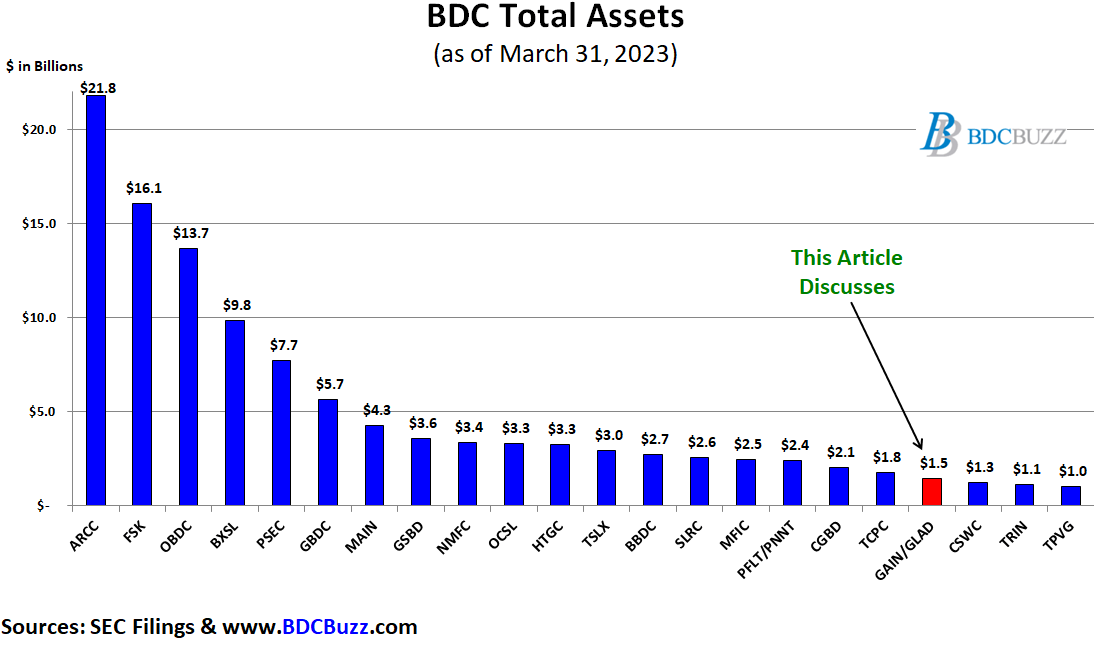
The BDCs in the chart below account for around 90% of the total assets and market capitalization for the sector.
Over the last six weeks, we discussed the portfolio credit quality and/or dividend coverage for many of them including Ares Capital ( ARCC ), FS KKR Capital ( FSK ), Prospect Capital ( PSEC ), Goldman Sachs BDC ( GSBD ), New Mountain Finance ( NMFC ), Oaktree Specialty Lending ( OCSL ), Hercules Capital ( HTGC ), PennantPark Floating Rate Capital ( PFLT ), PennantPark Investment ( PNNT ), TriplePoint Venture Growth ( TPVG ), Monroe Capital ( MRCC ), and BlackRock TCP Capital ( TCPC ) in the following articles:
- Ares Capital: Assessing Dividend Coverage For Its 10% Yield
- Oaktree or New Mountain For Solid 11% Yield?
- Better High-Yield Buy: FSK or PSEC?
- PennantPark: Big Win From Dominion/Fox Settlement
- Venture Debt Opportunity Yielding 13% To 14%: HTGC or TPVG?
- BlackRock Or PennantPark For Solid 12% Yield?
- Safer 12% Yield: Goldman Sachs BDC or Monroe Capital
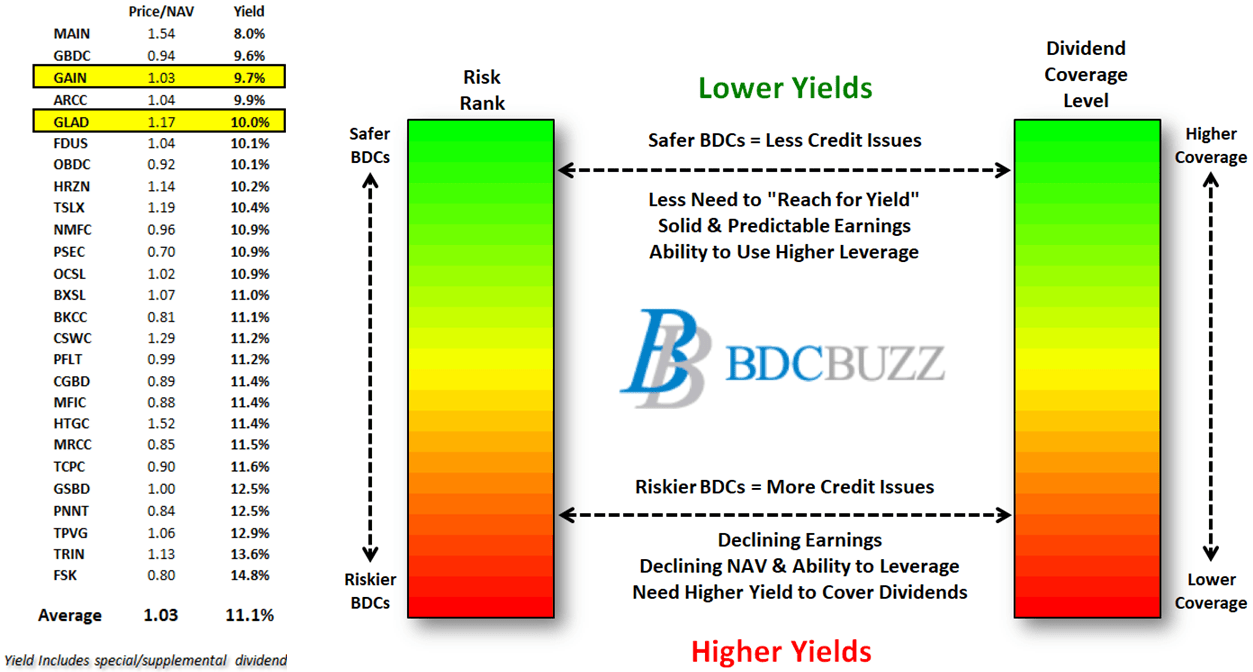
As shown below, many of these BDCs are among the highest yielding:
BDC Buzz & SEC Filings
Comparing Dividend Coverage
As mentioned earlier, one of the largest mistakes that BDC investors make is focusing on historical dividend coverage instead of projected dividend coverage which is heavily reliant on portfolio credit quality. Each quarter I update the financial projections for each BDC with base, best, and worst-case scenarios to test the sustainability and/or changes to the current dividends. Below I discuss many of the drivers used for projecting dividend coverage including the base, best, and worst-case projections similar to what we provided in the "Ares Capital: Assessing Dividend Coverage For Its 10% Yield" article linked earlier.
My worst-case scenarios include increased portfolio credit issues, lower NAV per share, declining portfolio yields ( potentially from lower interest rates ), higher borrowing rates and operating expenses, slower portfolio growth (or portfolio declines/repayments), and lower amounts of non-interest income (from fees and dividends). Basically, the worst case is assuming a deeper and extended recessionary environment coupled with declining interest rates. If you're not getting this level of detail for each of your BDC investments, please consider taking a more detailed approach to due diligence each quarter.
GAIN
Gladstone Investment ( GAIN )
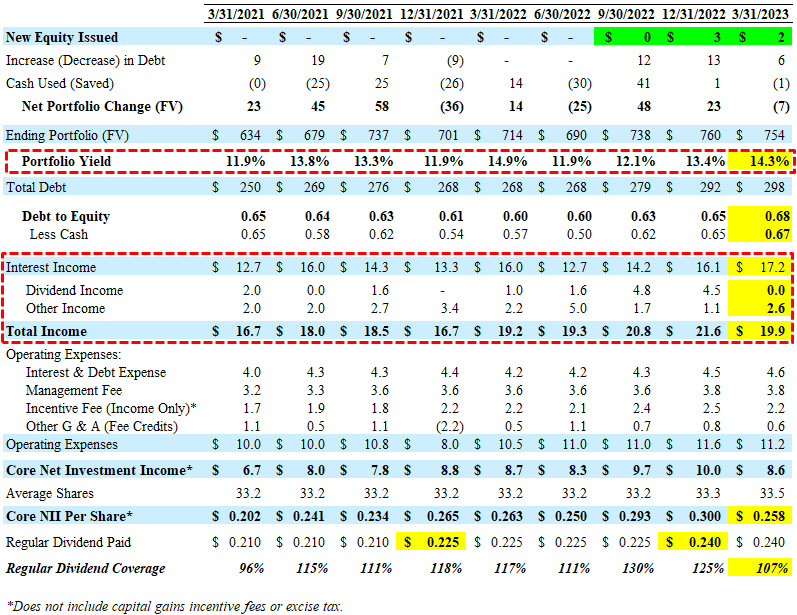
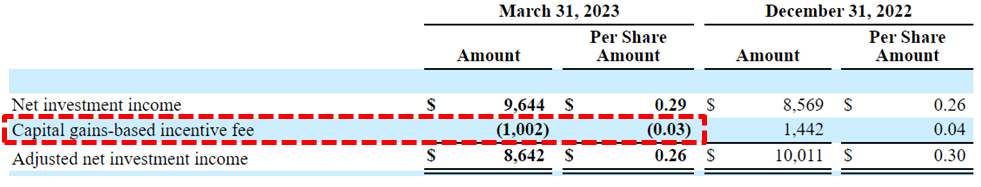
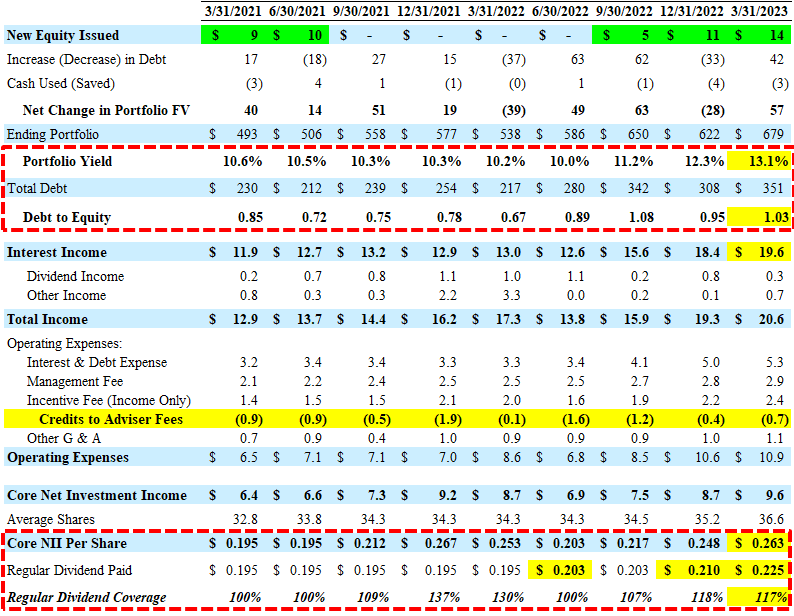
For calendar Q1 2023, GAIN reported between its base and best-case projections, with another meaningful increase in its portfolio yield from 13.4% to 14.3% partially offset by no dividend income during the quarter .
"Core NII" takes into account incentive fees related to capital gains:
Its leverage remains the lowest in the sector with a debt-to-equity of 0.67 (net of cash) and during calendar Q1 2023, GAIN sold 144,504 shares through its equity ATM Program at a weighted-average gross price of $14.04 per share (above NAV) raising approximately $2 million in net proceeds with a slight accretive impact to its NAV per share.
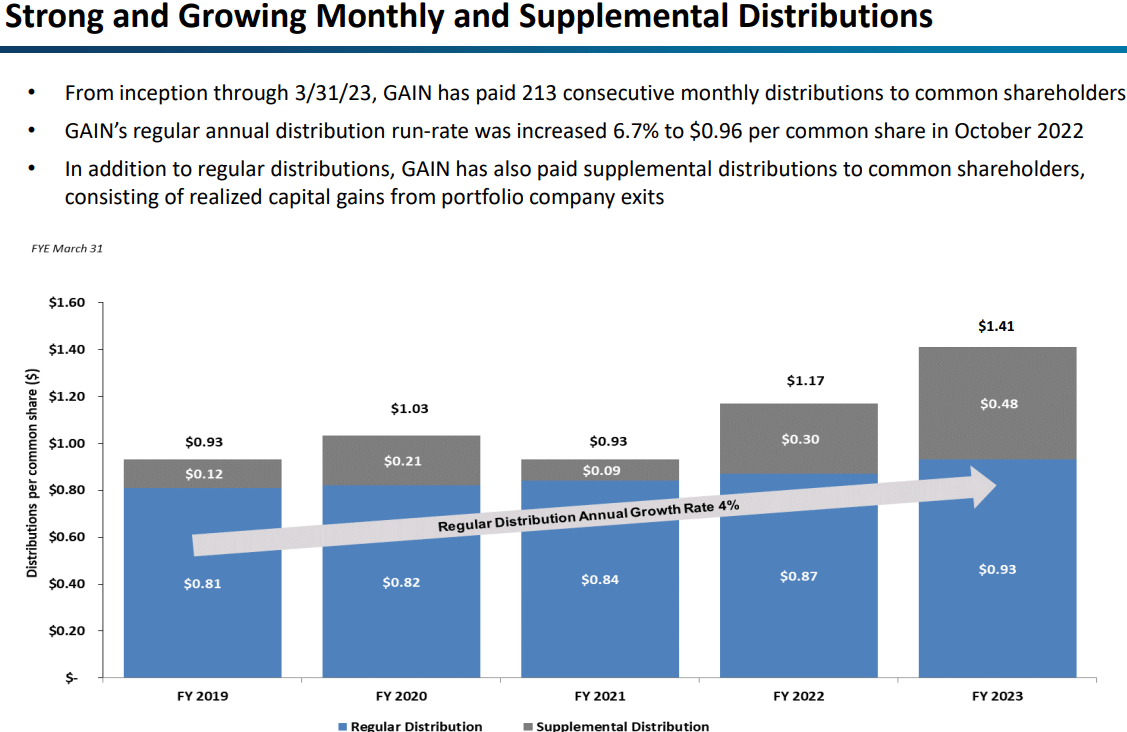
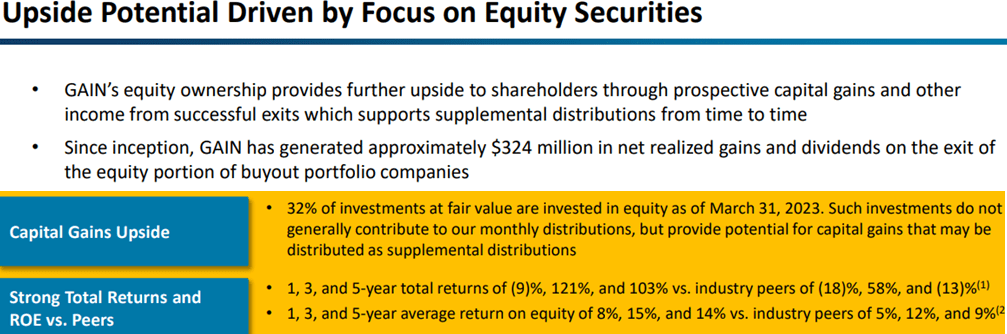
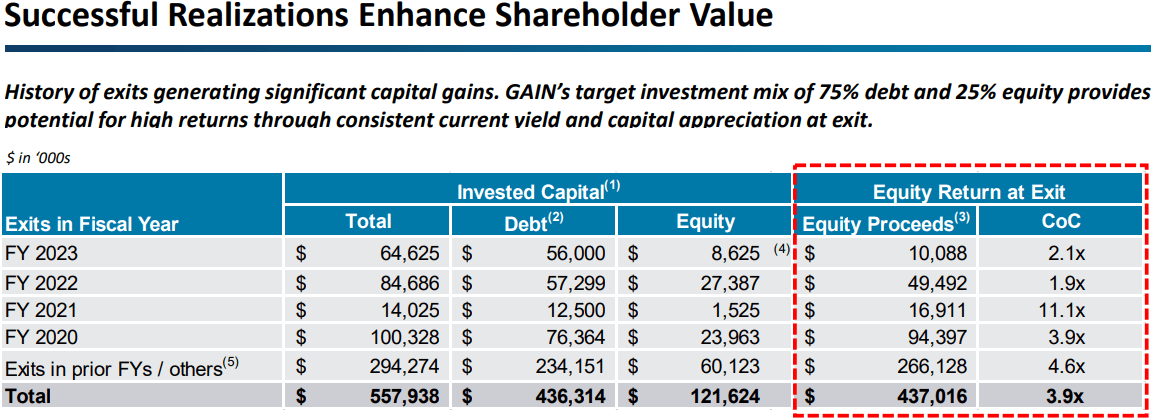
Over the last six years, GAIN has increased its dividend 7 times while paying supplemental dividends and growing its NAV per share. GAIN’s target prices take into account its history of providing superior returns (as shown earlier), very low leverage with the ability for additional increases in the regular dividends, and/or pay additional supplemental dividends supported by continued realized gains from equity positions.
GAIN paid a supplemental distribution of $0.24 per share for March 2023 and $0.12 per share for June 2023. Please note that GAIN previously increased its regular dividend by 7% (in October 2022).
“During the year, we were able to increase our monthly dividend, approximately 6.7% to $0.08 per share, which was up from $0.075 per share per month for an annual run rate of $0.96 per share. We paid an aggregate of $0.48 per share in supplemental distributions and that included a $0.24 per share supplemental distribution was paid in the most recent quarter, March 2023. In April, we declared an additional $0.12 per share supplemental distribution to be paid in June 2023. Using the monthly distribution run rate of $0.96 per share per year and $0.48 per share in supplemental distributions paid during the fiscal year of 2023, our aggregate fiscal year distributions would total $1.44 per common share or a yield of about 10.7% using yesterday's closing price of $13.45.”
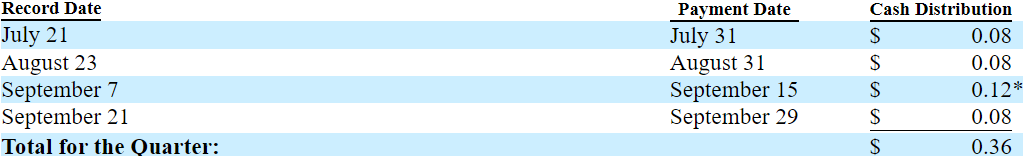
Earlier this month, GAIN announced a supplemental distribution of $0.12 per share for September 2023 and reaffirmed its monthly dividend of $0.08 per share:
There's a good chance that the company will continue to increase the amount of total dividends paid to shareholders due to higher NAV per share, relatively low leverage providing plenty of capacity to grow the portfolio, upcoming lower non-accruals, dividend, and other income from equity investments, maintaining a higher portfolio yield, and continued realized gains all of which are discussed in this report.
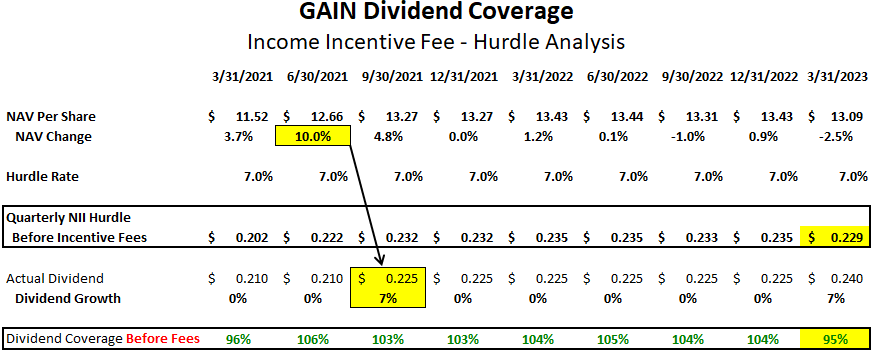
One of the primary reasons for the previous dividend increases is the continued increase in NAV per share combined with the incentive fee hurdle rate of 7% as discussed next, as well as by management in a previous call:
This is in large part due to the continued recovery of the values of our equity portions of our holdings , which obviously is very important to us and which actually make up about 26% currently of our portfolio at cost. So as a result and subsequent to the quarter end, we did increase our monthly distribution to shareholders by 7% .”
The company will earn around $0.229 per share each quarter covering 95% of the current regular monthly dividend (see following table), which is basically "math" driven by an annual hurdle rate of 7% on equity before paying management incentive fees . It's important to note that the company could earn less than $0.229 per share, but management will not be paid incentive fees, as shown in the previous projections.
The income-based incentive fee rewards the Adviser if our quarterly net investment income (before giving effect to any incentive fee) exceeds 1.75% (quarterly) of our net assets, adjusted appropriately for any share issuances or repurchases during the period (the “Hurdle Rate”). No incentive fee in any calendar quarter in which our pre-incentive fee net investment income does not exceed the Hurdle Rate (7.0% annualized).
Most dividend coverage measures for BDCs use net investment income (“NII”) which is basically a measure of earnings. However, some BDCs achieve incremental returns with equity investments that are sold for realized gains often used to pay supplemental/special dividends.
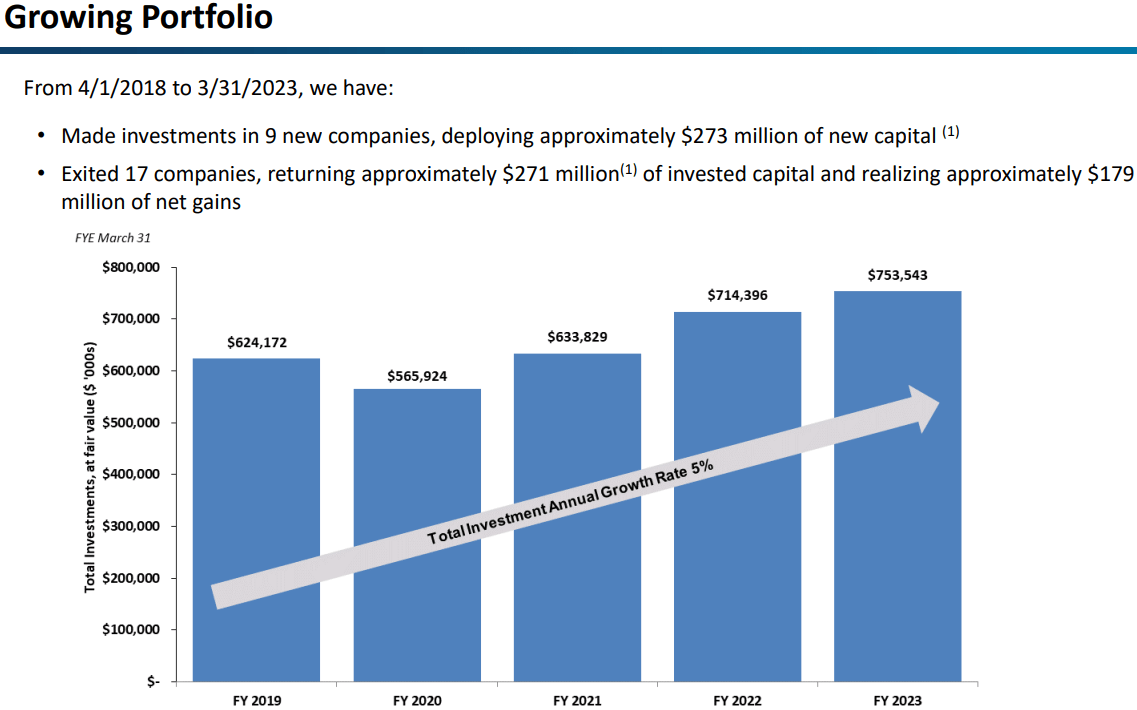
We currently anticipate being able to fund future supplemental distributions as we do recognize realized capital gains on the equity portion of future exits and potentially from other recapitalizations, although we cannot guarantee the timing of capital gains on exits or obviously supplement reductions. Since inception in 2005 for this fund and through this fiscal year-end 3/31/2023. We have invested in 56 buyout portfolio companies for an aggregate of approximately $1.6 billion, exited 29 of these companies when generating approximately $260 million in net realized gains and over $40 million now that income on these exits.”
Previous call: “And our plan is to be able to continue as we harvest companies by exit, whether in the case of a supplemental coming from, say the Old World, which again is not going to happen all that frequently, these dividend recaps, frankly. But when we exit a business, we will probably have a couple of exits this year, that’s our plan. We want to be able to do that, so we can provide the supplementals .”
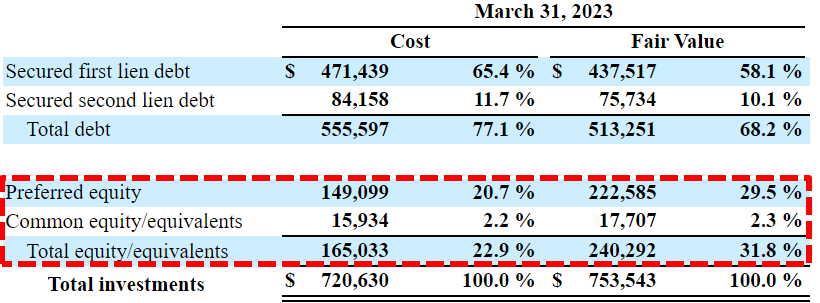
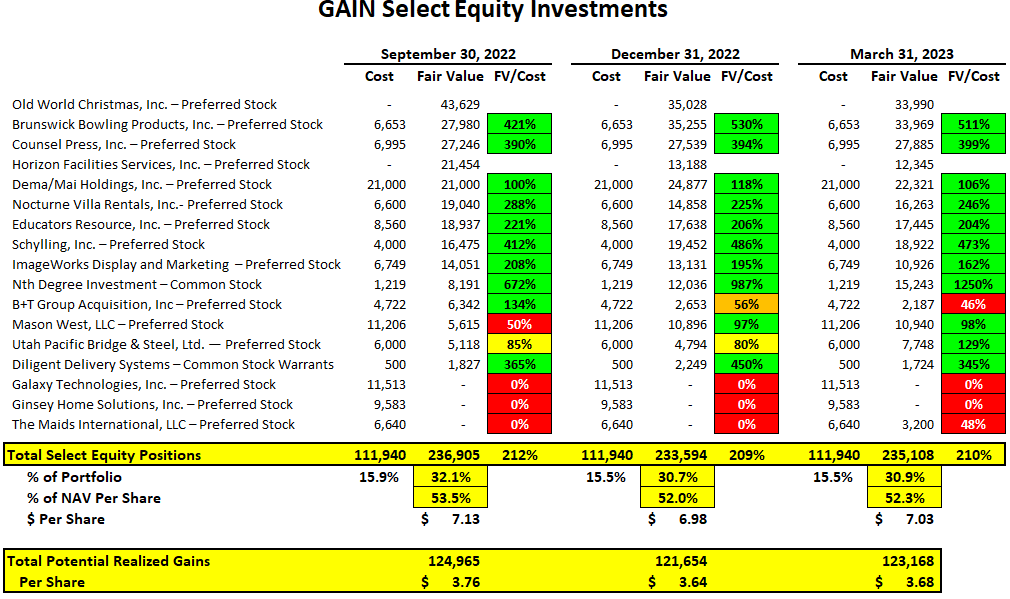
Over the last five quarters, the amount of preferred/common equity has increased from 28% to 32% of the portfolio, mostly due to marking up Dema/Mai Holdings, Brunswick Bowling Products, Nth Degree , and Nocturne Villa Rentals .
As shown in the following table, GAIN has significant unrealized gains in many of its preferred stock positions that will likely continue to drive additional realized gains over the coming quarters to support additional supplemental dividends. If GAIN exited these investments at their March 31, 2023, fair values, it would result in over $123 million, or $3.68 per share of additional realized gains . However, there are other investments valued below cost and management is taking a careful approach to exiting these investments.
Management discussed many of these investments on a previous call:
“Brunswick Bowling, Mason West, Dema, which is one of our more recent investments, Nth Degree, which we still now have an interesting investment in, Schilling, which is consumer, somewhat related, PSI Molded Plastics. All of those had increases fundamentally as a result of EBITDA appreciation, while there was a slight decline on multiples, which of course, we don’t create those that’s given to us. So, net-net, in those companies, as an example, we saw an ability as a result of the EBITDA increases to offset any sort of multiple decline, so to speak. And then when you look at some of the others, Horizon, we mentioned that had a bit of a slight EBITDA decline and a multiple decline as well. Some of the others, Educators Resource, which is a very good company had a similar dynamic, B&T acquisition, similar dynamic. So, overall, I would say, the obvious question is, we have 25 companies in our portfolio, excuse me, which is down from 26 companies, because of the – we have exited one company, as I mentioned that we have had in the portfolio for some time. So, overall, I think the balance in the portfolio is very solid with the nature of the companies we have in the various industries that we are in. And as I look forward, obviously, hopefully, we will start seeing – I suspect we will see generally EBITDA for arguments sake just kind of continuing on a trailing 12 basis, which is obviously how we do our valuations. We will probably stay relatively stable. I would expect we might see a few increases, but nothing on a negative side necessarily, and then multiples, who knows what that’s going to look like as we go through the end of this quarter. I would anticipate multiples would be probably, again, relatively stable, maybe slightly down.”
GLAD
Gladstone Capital ( GLAD )
For calendar Q1 2023, GLAD reported slightly above its base case projections covering its monthly dividends by 117% with another increase in its portfolio yield from 12.3% to 13.1%, higher-than-expected portfolio growth (due to only $9.8 million of repayments) and other income partially offset by lower-than-expected credits to adviser fees.
Total investment income increased by $1.3 million, or 6.6%, for the quarter ended March 31, 2023, compared to the prior quarter ended December 31, 2022, primarily due to a $1.2 million increase in interest income. The increase in interest income was driven by increases in both the weighted average yield and weighted average principal balance of our interest-bearing investments.”
The amount of payment-in-kind (“PIK”) income has declined from 9.6% in Q3 2023 to 3.8% in Q1 2023 as a % of total income partially due to the repayment of R2i Holdings .
Our PIK income on the portfolio is very low today. It's under 5% of our interest income. So if we were seeing stress, the logical scenario for this growth business portfolio would be to accrue some income. Our PIK has not even gone up. It's, in fact, going down at the moment.”
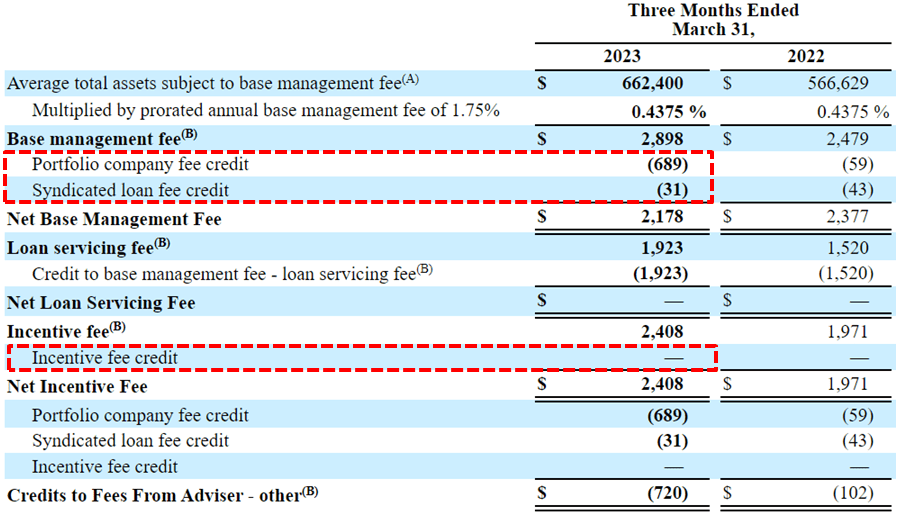
GLAD’s advisor credits have historically included the following three components:
- Credits to reduce the management fee on syndicated credits to 0.50% which is declining as a percentage of the overall portfolio and will become immaterial soon.
- Credits for closing deal fees paid directly to the manager, of which there should always be some, and this eliminates any conflicts in pushing fees over yield on investments.
- Incentive fee credits for 100% coverage of the dividend .
There will likely continue to be credits related to the first two categories, and the company is becoming less reliant on the incentive fee credit, which should continue to improve due to:
- Maintained/increased leverage/portfolio growth
- Increased portfolio yield and/or fee income
- Higher NAV per share
During calendar Q1 2023, GLAD issued almost 1.4 million shares at a weighted-average price of $10.21 per share (11% premium to previous NAV per share), through its at-the-market equity program, generating net proceeds of $13.8 million. As of March 31, 2023, the company had a remaining capacity to sell up to an additional $23 million of common stock. The company issued another ~260,000 shares through May 1, 2023, which has likely continued as the stock is trading at a meaningful premium to its NAV per share.
We continue to actively manage our balance sheet leverage within our modest leverage target range and market conditions permitting, plan to continue to issue equity under our ATM program to support further growth of our investment portfolio. We're continuing to see attractive investment opportunities within the lower middle market and expect follow-on investments within our portfolio will continue. And in total, these should outpace repayments and support further growth of our investment portfolio.”
The following subsequent events have been taken into account with the updated projections:
- On May 31, 2023, GLAD announced a continuous public offering of up to 6 million shares of its 6.25% Series A Cumulative Redeemable Preferred Stock. The company expects to receive up to $150 million in gross proceeds and approximately $131 million in net proceeds .
- In April 2023, GLAD invested $25.0 million in Technical Resource Management , through secured first lien debt and equity and extended a $3.0 million line of credit commitment and a $2.5 million delayed draw term loan commitment, each of which were unfunded at close.
- In April 2023, its debt investment in HH-Inspire Acquisition was refinanced and the existing debt investment totaling $35.5 million was repaid at par, plus a $0.2 million prepayment fee , and GLAD invested a total of $16.8 million in Inspire through new secured first lien debt and equity and extended Inspire a $1.8 million line of credit commitment, which was unfunded at close.
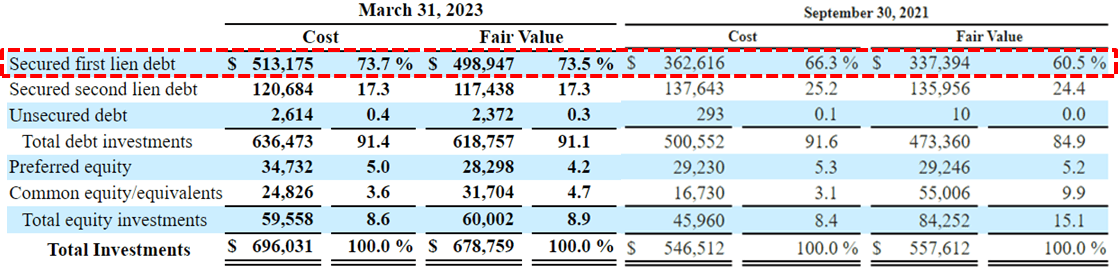
GLAD’s leverage (debt-to-equity) remains relatively low partially due to the 31% increase of its NAV per share over the last three years mostly related to appreciation from its equity positions that still account for around 9% of the portfolio. The amount of first-lien debt has grown from 60% to 74% of the portfolio fair value over the last six quarters.
“Based on the cumulative asset growth of the past year, we've elevated our balance sheet leverage to the target range of 90% to 110% of NAV as we previously referenced. And we'll look to maintain our leverage in that range as we grow our assets going forward.”
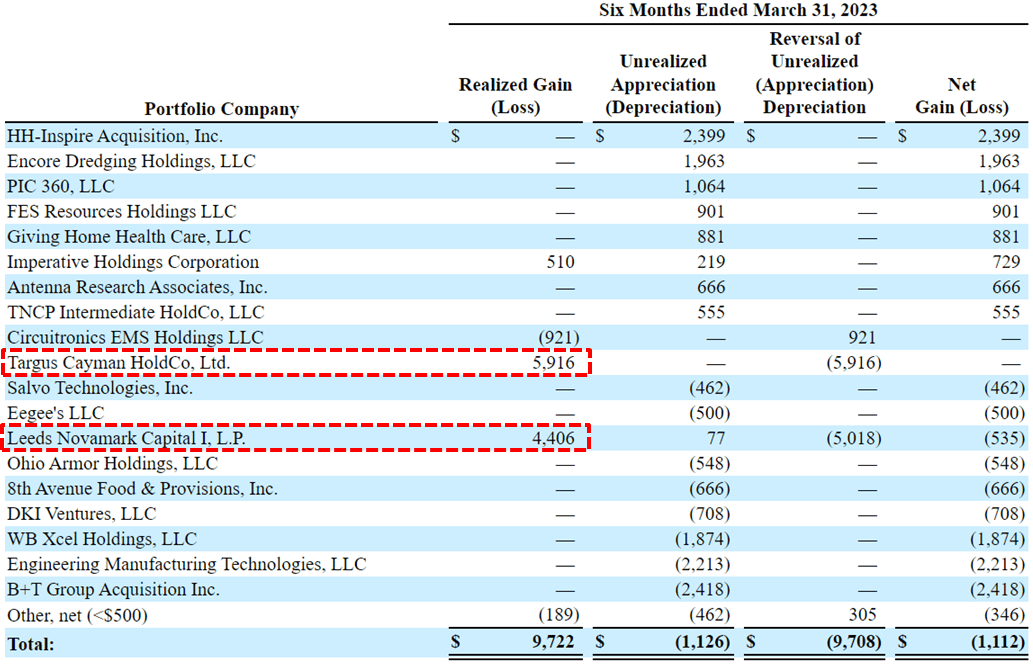
During calendar Q4 2022, there was another $9.6 million or $0.27 per share of net realized gains due to the exit of its investments in Targus Cayman and Leeds Novamark Capital , as discussed in the previous report:
From previous call: “Notable portfolio exits for the period included the sale of a couple of equity investments in Targus and Leeds Novamark Capital, which generated realized gains of $10.3 million, and the repayment of R2i, which is a highly leveraged credit, and contributed to the 35% drop in PIK income for the quarter.”
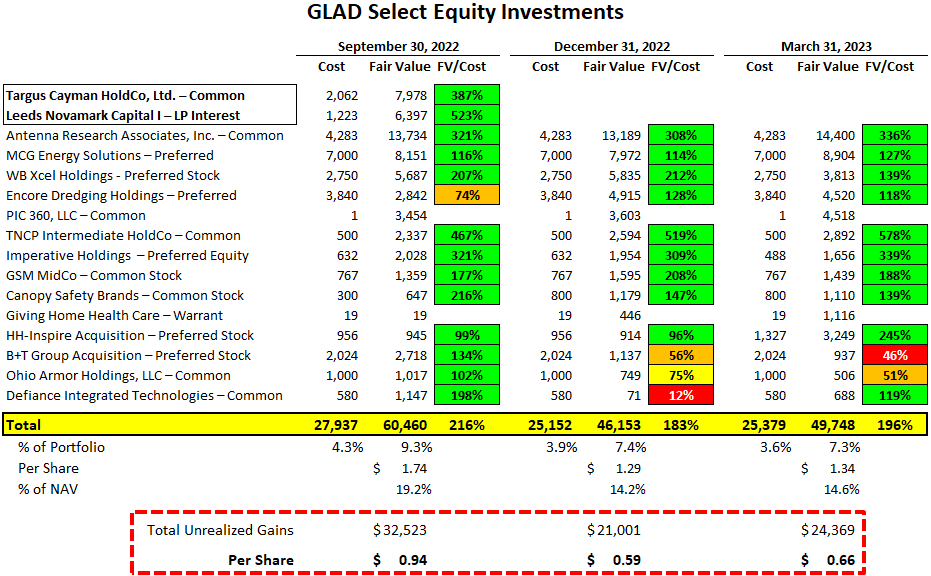
The following table shows many of GLAD’s equity investments currently accounting for over 7% of the total portfolio fair value with over $24 million of unrealized gains partially responsible for the previous NAV growth. If these investments were sold at their current fair values, they would generate around $0.66 per share of realized gains, which is significant given that the company currently pays $0.99 per share of regular dividends annually. However, GLAD has historical net realized losses of around $80 million over the last 10 years, which is around $2.16 per share using the current share count. GLAD’s net asset value (NAV or book value) has remained stable since 2012 due to offsetting unrealized gains and over-earning the dividends.
Earlier this month, GLAD announced another 7% increase in its monthly distribution from $0.0800 to $0.0825 per share plus a supplemental distribution of $0.02 per share for Q3 2023:
Bob Marcotte , President: “While increased interest rates have lifted our net interest income and supported the recent increase in our distributions , favorable lending market conditions, our continued focus on portfolio performance, and disciplined asset growth while maintaining our conservative leverage metrics will be the primary drivers of our earnings momentum in the coming quarters.”
SEC Filings
BDC Valuations
There are very specific reasons for the prices that BDCs trade driving higher and lower dividend yields mostly related to portfolio credit quality and dividend coverage potential (not necessarily historical coverage). BDCs with higher-quality credit platforms and management typically have higher-quality portfolios and investors pay higher prices. This drives higher multiples to NAV and lower yields.
As a part of assessing BDCs, it's important to take into account expense ratios. BDCs with lower operating expenses can pay higher amounts to shareholders without investing in riskier assets.
“Operating Cost as a Percentage of Available Income” is one of the many measures that I use which takes into account operating, management, and incentive fees compared to available income. “Available Income” is total income less interest expense from borrowings and is the amount of income that is available to pay operating expenses and shareholder distributions .
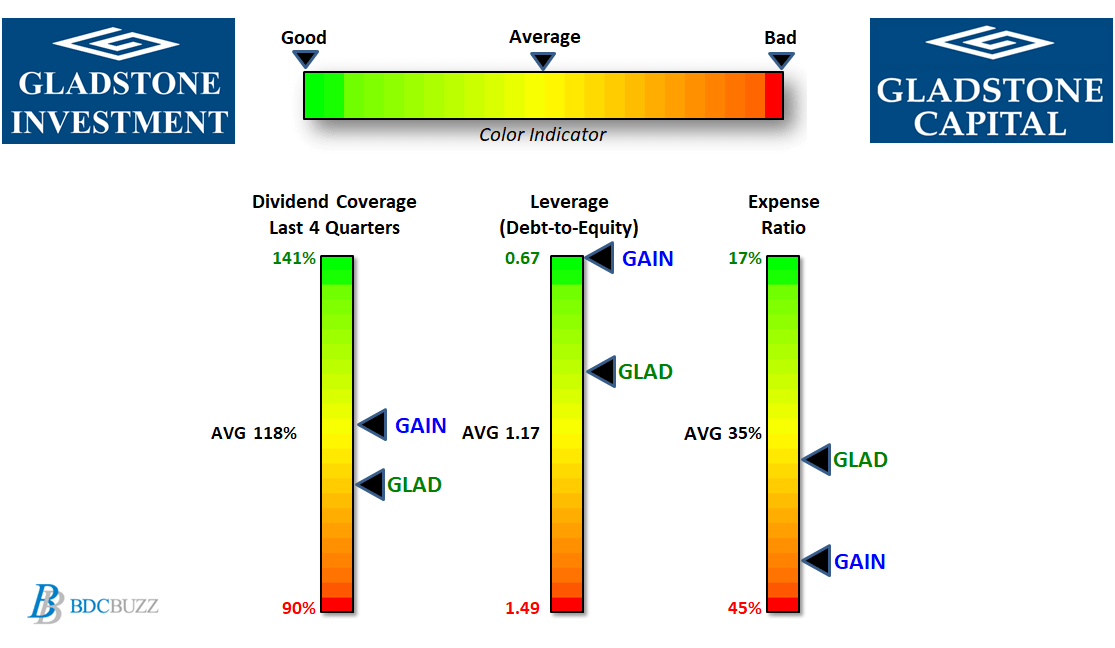
The charts below compare a few metrics for GAIN and GLAD compared to the average BDC including dividend coverage over the last four quarters, leverage or debt-to-equity, and expense ratios. As mentioned earlier, please do not focus only on historical dividend coverage especially compared to projected coverage.
GAIN has higher dividend coverage with lower leverage but also a higher expense ratio due to its 2.00% management fee plus a 20% incentive fee both of which are the highest in the BDC sector. As mentioned earlier, I own both GAIN and GLAD but they are currently trading over my target prices which will be discussed in a following article.
BDC Buzz & SEC Filings
For further details see:
Solid 10% Yield From Gladstone Capital And Gladstone Investment