CWEN - Solid Yield And Moderate Growth With Clearway Energy
2023-03-13 23:48:53 ET
Summary
- CWEN has a stated plan to raise dividends for the next few years.
- It has growth projects in place to fund these dividend raises.
- With contractual income future visibility is strong.
Clearway Energy ( CWEN ) ( CWEN.A ) is a clean energy infrastructure company which sells energy through long term power purchasing agreements. This provides excellent visibility into future earnings while funding a healthy 5% dividend. With this level of stability it makes the investment decision mostly a matter of valuation. This article will look at growth rate and risks to assess how the cashflow yield stacks up.
Let me begin by establishing a true earnings number as the industry’s use of non GAAP metrics makes this a bit tricky.
CAFD versus true earnings
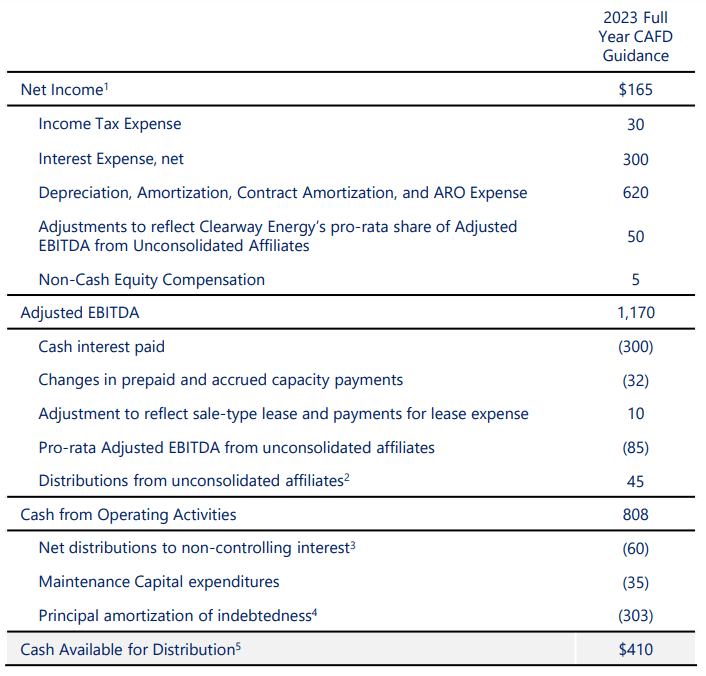
Below is Clearway’s 2023 earnings guidance.
With 202 million shares outstanding, $410 million of Cash Available For Distribution ((CAFD)) represents about $2.03 per share.
As a cash metric, CAFD is meant to measure the actual impact to cash, but as an investor I am more interested in what the company’s economic earnings are. As such I would make the following adjustments to get to a truer earnings figure.
- Add back amortization of debt. While it is a cash expense it is just the paydown of debt which is a good thing and not reducing earnings.
- Subtract equity compensation
- Subtract a portion of Depreciation and AROs
They already provide the numbers for amortization ($303 million) and stock comp ($5 million), but to get to real depreciation we have to do some calculations.
In real estate one would typically add back all of depreciation to get to FFO or AFFO, but energy assets are different. While a commercial real estate property will tend to appreciate over time when well maintained, energy assets tend to get depleted. Oil and gas fields run out of the raw resource or at least the readily accessible portion of that resource.
CWEN is mostly on the renewables side, but these assets also have limited lifespans. Traditionally the useful life of a wind turbine has been about 20 years, but technology has improved and Berkeley Lab estimates the useful life of wind power plants is now about 30 years. Solar has a roughly 30-35 year life span.
Given that these assets need to be replaced about every 30-35 years a significant portion of the depreciation is real. In my opinion, a 3% annual depreciation expense would be appropriate.
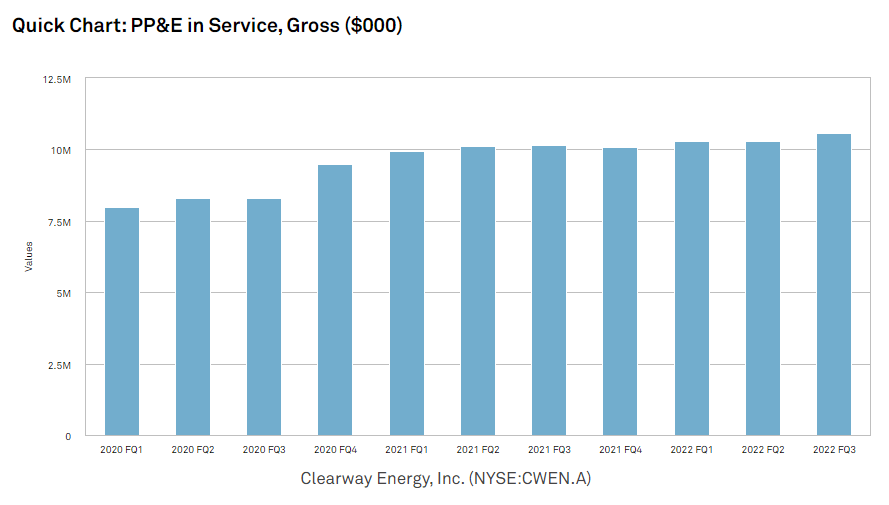
CWEN has about $10.5B of PP&E at cost.
Using a 3% annual depreciation schedule that would be a real expense of about $315 million. You may notice that the recorded level of depreciation in guidance is $620 million.
Why is guided depreciation so much higher than real depreciation?
It has to do with tax incentives for solar and wind in which the projects can have dramatically accelerated depreciation schedules which facilitates tax savings. As per the 10-K:
“Pursuant to the U.S. federal Modified Accelerated Cost Recovery System, or MACRS, wind and solar projects are generally depreciable for tax purposes over a five-year period (before taking into account certain conventions) even though the useful life of such projects is generally much longer than five years. The Tax Act also provides for immediate and 100% expensing and deductibility for eligible property acquired and placed in service after September 27, 2017, and before January 1, 2023, with phase downs permitting 80%, 60%, 40% and 20% expensing and deductibility for property acquired and placed in service during 2023, 2024, 2025 and 2026, respectively.”
Thus as long as CWEN keeps building new renewable energy projects they will continue to have abnormally high GAAP and tax depreciation.
This is a great thing because it shelters functionally all of CWEN’s taxation. As of 12/31/22 the company has accrued $481 million of NOL carry forward balance. CWEN estimates it will almost entirely shelter them from income tax through 2027.
Since depreciation is not a cash expense it is added back in to CWEN’s CAFD figure. As discussed above I would not penalize them for the entire $620 million of accelerated depreciation, but I do think about $315 million represents the true depreciation.
Finally, Asset Retirement Obligations or AROs are a noncash expense, but a real expense as the infrastructure company will have to pay them when its fields are depleted. Annual accrual to AROs appears to be about $10 million.
Back to the CAFD to true earnings calculations:
- Guided CAFD of $410 million
- Minus $315 million of real depreciation
- Minus 5 million stock compensation
- Plus $303 million amortization
- Minus $10 million of AROs
True 2023 earnings = $383 million. With 202 million shares outstanding that is true earnings of $1.90 per share. The earnings multiple depends on which class of security one buys.
CWEN or CWEN.A?
CWEN has 4 classes of common stock, but the 2 publicly traded are CWEN which is the class C and CWEN.A which is the class A.
As seen above in the Portfolio Income Solutions Arbitrage Tracker, CWEN.A trades at a substantial discount to CWEN.
These securities are pari-passu with respect to claims on earnings, dividends and liquidation preference. CWEN.A has 100X the voting power of CWEN, but has slightly less liquidity due to fewer shares of its class outstanding.
In my opinion CWEN.A is a much better deal than CWEN. I will happily take a 6% discount and more voting power for slightly less liquidity.
Using CWEN.A’s price of $29.35, it is trading at a true earnings multiple of 15.4X. The 5% dividend is well covered, but this cashflow yield alone is not enough to get me interested in a stock.
A company needs about 10% cashflow yield to outperform the market in today’s environment if it is just going to be a flat earner, so with CWEN.A trading at a 6.5% true earnings yield it needs some growth to make it over my investment hurdle.
Fortunately, the New Jersey based infrastructure company has a strong growth pipeline.
Growth
I see 3 sources of significant growth:
- Already funded deals from geothermal sale
- Acquisitions at 9.5% CAFD yield
- Amortization of debt reducing interest expense
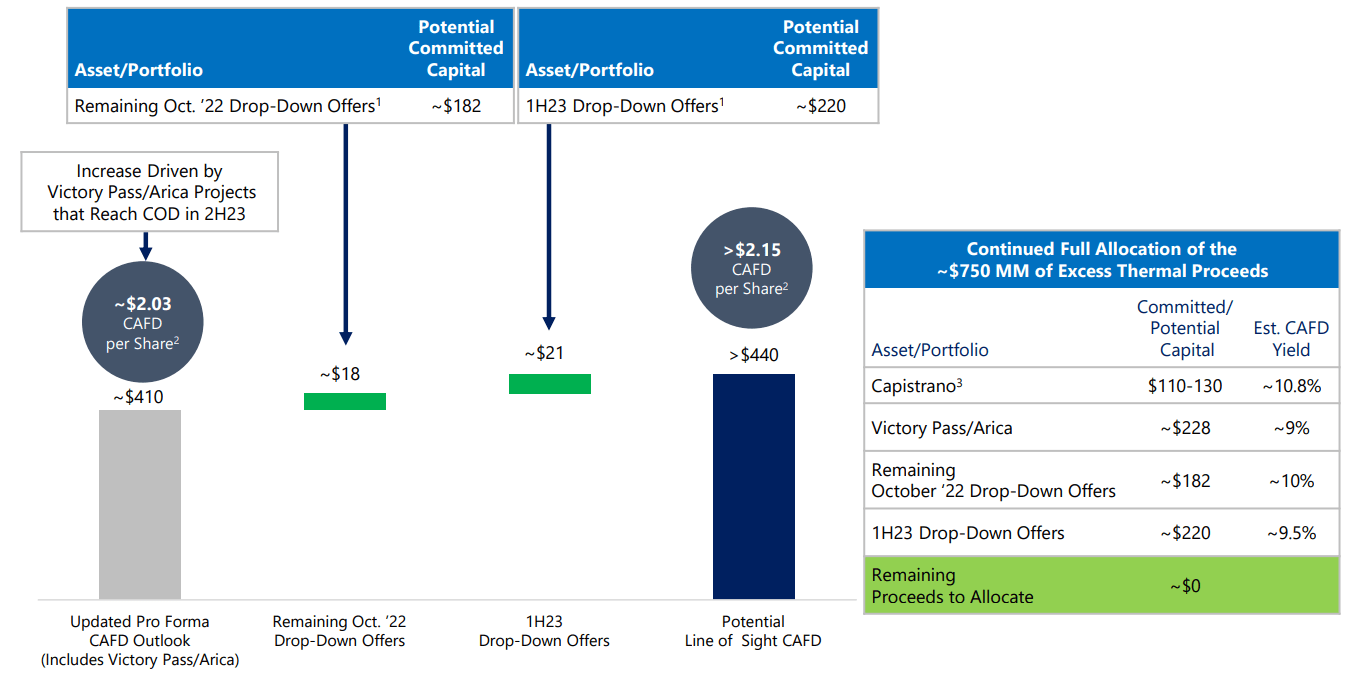
CWEN profitably sold well over $1B of geothermal assets and is still investing the proceeds. Much of this reinvestment is not in the 2023 guidance and represents forward growth. As this is cash on balance sheet it will be pure accretion to the bottom line.
With projects already in place at CAFD cap rates from 9%-10.8%, the accretion looks to be about $39 million in annual CAFD.
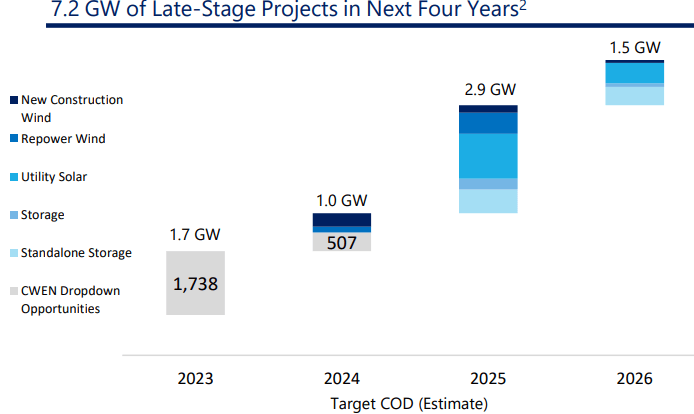
Beyond the geothermal proceeds, CWEN has a profitable spread with a roughly 6% blended cost of capital and projects available at close to 10% ROIC. Many of these are already planned with developments going out to 2026.
The 3 rd source of growth is more organic in nature as it comes from the debt amortization already in place. With CWEN paying down $303 million in debt annually, each year that is $303 million less debt on which they have to pay interest.
New debt issuance is more expensive, but CWEN’s in-place debt is around 4% so that would be about $12 million of accretion annually from debt paydown or about 6 cents per share. The ability to pay this debt down while still financing growth and dividends comes from the fact that depreciation is a non-cash expense that won’t need to be funded until over a decade down the road.
So we are accounting for the real portion of this expense in our true earnings number in addition to the maintenance capex, but since the cash portion is a ways off they get to use that to dramatically lower interest expense for the next 15 years.
The Buy Thesis
Between the 3 sources of growth, CWEN looks to have a growth rate in the high single digits for the next 5 years. That, in combination with the 5% dividend, positions it to outperform the market at current valuation. The company has a stated objective to grow dividends over time so I believe the growth to CAFD will result in proportional dividend growth to continue their trajectory.
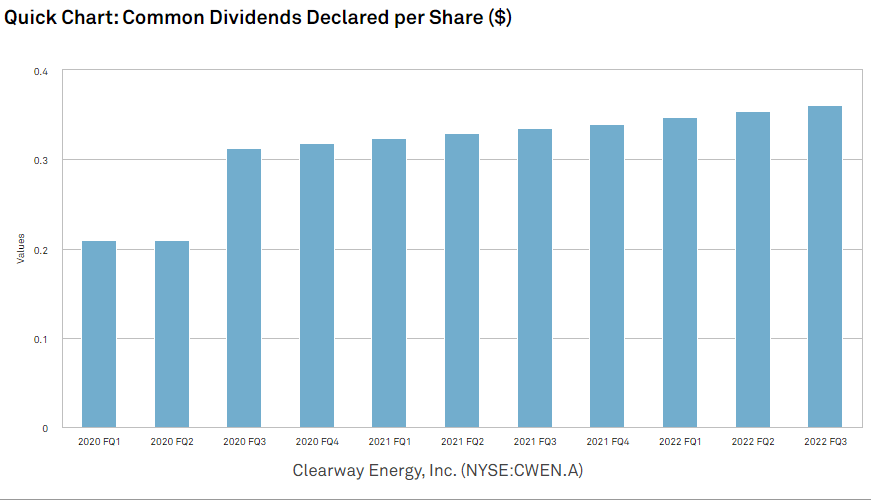
Risks to thesis
CWEN’s revenues are very long term in nature with PPAs going out as late as 2044.
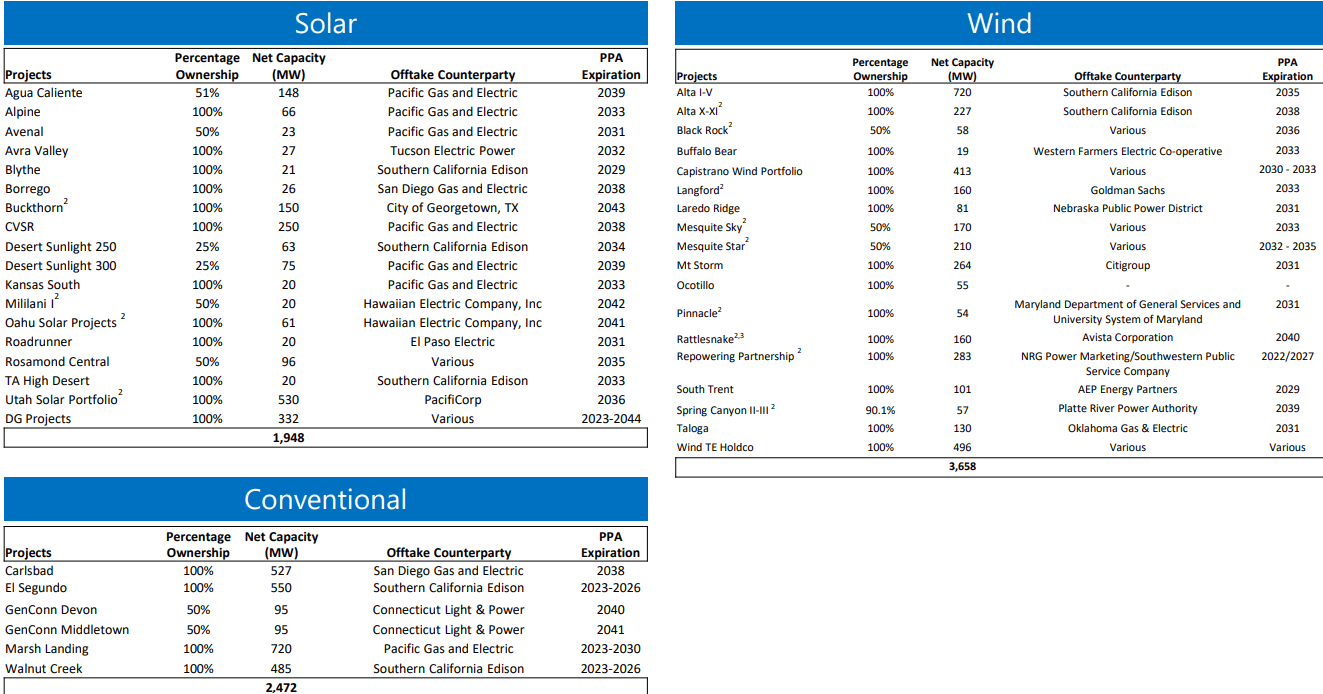
This introduces some counterparty risk. For the most part these are strong counterparties in the form of megacap companies or utilities, but things can go wrong and they have. A few years ago, PG&E ( PCG ) went bankrupt and while they have emerged and are once again paying CWEN, it did cause some significant headaches for the company.
I think there is also significant risk and upside in the useful life of renewable energy assets. These are still fairly new technologies, at least in their current engineered form, so I think there is potential for the useful life to be either longer or shorter than anticipated. This could cause additional capex requirements as assets age.
For further details see:
Solid Yield And Moderate Growth With Clearway Energy