VICI - Sorting Through The REIT Wreckage: Public Storage Healthcare Realty And 32 Others
2023-10-10 11:27:13 ET
Summary
- REITs have underperformed the overall stock market this year.
- I screened all 34 stocks listed in Value Line’s Investment Survey REIT section with revenue over $500 million, a large chart is included.
- Each was given a weighted score for FFO growth, leverage, valuation, yield, industry strength, and resistance to a recession.
- After totaling the scores, two stocks were chosen for purchase and reviewed.
- 11 REIT industries are analyzed.
Background
In this article, 34 of the largest REITs in 11 different segments are screened. Each was given a weighted score for funds from operations (FFO) growth, leverage, valuation, yield, industry strength, and resistance to a recession. After scoring each, the top four were analyzed further and then two were picked for a more detailed review and buy recommendation.
REITs have significantly trailed the overall stock market this year, though not by as much as some people think. The 34 REITs reviewed here averaged a 1.6% loss year-to-date through October 6. The Vanguard Real Estate Index Fund ( VNQ ) is down 7.0%. This is below the S&P 500 performance of a 12.2% gain during the same period. REITs have been impacted by higher interest rates, tighter financing standards, and secular trends impacting certain segments such as office buildings.
Value Line has REITs ranked 88 out of 93 for timeliness. This indicates their system is bearish on the industry over the next year.
It is very important to point out that REITs are not all the same or even similar. There are 11 different industry segments represented among the 34 companies reviewed. Each is quite different from the others. An industry review for all 11 is included below. Many economists, CEOs, and investors remained very concerned about a recession in 2024. I am in that camp. Some industries historically perform better in recessions or are more recession-resistant. Some have higher growth than others. At least one and probably two are in secular decline.
Screen of 34 REITs
The chart below shows 34 REITs listed by industry. Factors shown include annual revenues, FFO per share, FFO annual growth over four years, a leverage ratio of debt to equity, dividend yield, stock price movement this year and two valuation metrics; price to book and price to FFO.
FFO is used instead of earnings for REITs by industry experts and investors as it adds back depreciation and therefore is a more accurate depiction of shareholder return before capex. Annual revenues and FFO are from 2022 and taken from Value Line. For FFO growth, four years was used to get back to the last full year before the pandemic. The leverage ratio of interest-bearing debt to equity is not perfect. Equity is impacted by depreciation. The older the assets the more they are depreciated. This is despite the fact the majority probably appreciated in value. For that reason, the book value of equity is generally below market value.
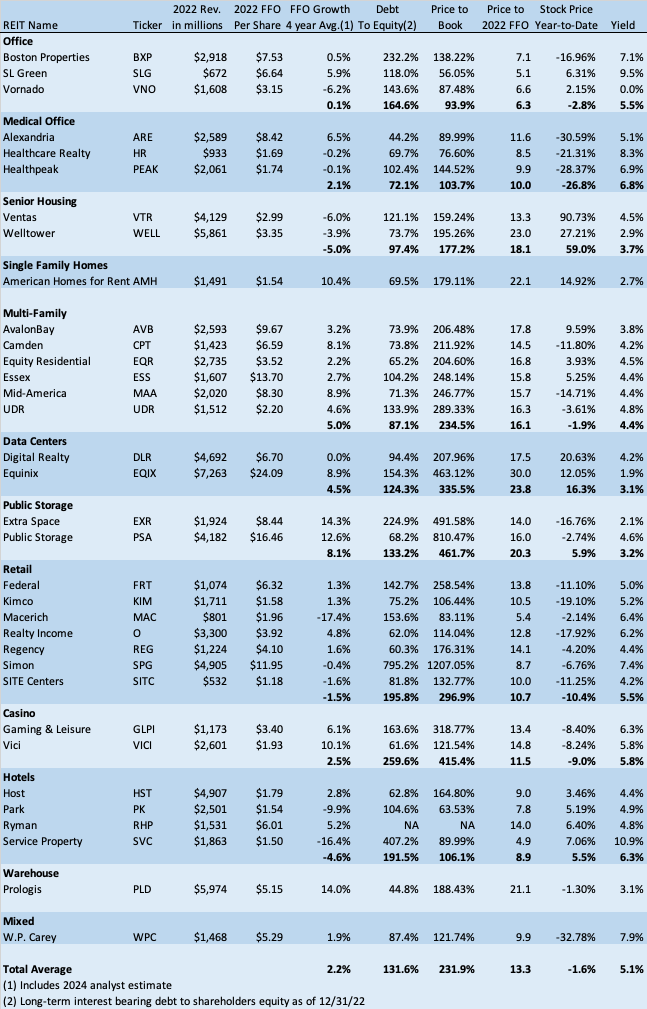
Scoring
In the next table, the six factors were rated 0 to 5, with 5 being the best. The first chart showed the REIT industry average FFO growth was 2.2% over the last four years. An average growth rate is graded a 3. For leverage, the debt-to-equity ratio was used. The industry average is 131.6%. As discussed earlier, this is not a perfect leverage analysis, and further analysis should include a debt-to-FFO ratio, interest coverage, debt maturities and pledged assets. Valuation is the most subjective and hard to score. It was determined in relation to industry peers followed by relation to REITs in general and the market in general. It is also based on price to book and price to FFO in relation to FFO growth. The industry average yield as shown in the chart above is 5.1%. Average yields are graded a 3. A discussion of the strength and recession resistance of each industry is below.
1. Office - The office rental market is by far the weakest of the 10 right now and just entering into FFO decline. The FFO growth average the past four years was flat. This is mostly due to the pandemic which got workers used to working from home. An expected return to the office has not materialized despite the pandemic being past. This article and many others put office occupancy by workers at half where it was pre-pandemic. This is only just starting to impact rents, but if it doesn't improve much, it may be disastrous. This sector was rated lowest at 1 for industry and 2 for recession resistance. It is less recession-resistant right now than normal due to occupancy issues. A recession magnifies those issues.
2. Medical Office - This includes several categories such as doctor's offices, outpatient facilities, labs and medical research facilities. Workers in these need to be on location much more than other office workers. Also, many doctor's offices are on or near hospital campuses due to better access to those facilities. However, there is a real risk of some contamination from regular office buildings if their rents fall significantly. This industry was rated a 2.5 for industry due to possible impact by the regular office market and 3.5 for recession resistance. Healthcare in general is less recession-impacted than average.
3. Senior Housing - These are nursing homes and assisted living facilities. This segment has struggled for years with onerous regulations, high costs and labor shortages. The pandemic was hard too, resulting in lower occupancy. Despite this, I have the segment rated average at 3.0 due to demographics pointing to increasing need. It is rated 3.5 in recession resistance and recessions have only a limited impact.
4. Multi-family - This has been one of the best segments the past two years exhibiting strong growth. There was a huge tailwind from higher home prices and higher mortgage rates. Both made renting much more affordable versus owning than in the past. Also, rental rates tend to eventually catch up to house prices. I am only rating this segment a 3.5 due to apparent overbuilding which is starting to drive up vacancies. This segment is rated average or 3.0 for recession resistance.
5. Data Centers - This is a newer sector and was quite strong until recently. While there has been a lull, AI development should drive demand for more and larger data centers. I don't see a recession impacting growth here much. Demand is coming from large well-funded companies that tend to think longer term. Both the segment and recession resistance are rated 4.5.
6. Public Storage - These are small warehouse units rented by individuals and small businesses. It has been an above average performer for years. Growth was juiced by the pandemic, especially in 2022, and is now falling back toward pre-pandemic levels. Since it's hard to say how far back it will drop it is rated 4.0 for strength. This segment has done relatively well in prior recessions and is rated 3.5 for recession resistance.
7. Retail - Retail is made up of several subsegments including malls, shopping centers, and single tenant buildings. You may recall, prior to the pandemic stores were closing left and right. The conventional wisdom was we have too many stores versus other countries. The pandemic changed that temporarily. More specifically $5 trillion in stimulus changed it. But that stimulus is mostly gone now and as I wrote in this article in June. Brick and mortar retailers saw a sharp drop in demand starting in May. This industry is usually heavily impacted by a recession. Both the segment strength and recession resistance are rated 1.5. The mall subsector is by far the weakest.
8. Casino - This sector was hard hit by the pandemic but is all the way back now. A proliferation of online betting may eventually hurt. Demand follows that of travel and leisure in general and is similar to hotels. Based on current trends in travel and leisure, this segment is rated 3.5 for strength. Recessions do have a large impact on this discretionary industry and it is rated 2.5 for recession resistance.
9. Hotels - Similar to casinos and also rated 3.5 for segment strength. Hotels have historically been significantly recession-impacted so rated 1.5 for recession resistance.
10. Warehouse - These have several subsectors such as for storage, distribution centers and manufacturing. This has been a powerhouse in recent years fueled by the move of retail to online. This trend is unlikely to end any time soon. This segment is rated 4.0 for strength and 3.5 for recession resistance. The online retailers will likely grow right through a recession, albeit more slowly.
11. Single Family Homes - This segment enjoyed extremely strong price appreciation in 2022 and 2021. This trend is in conjunction with much higher interest rates has made homes much less affordable. Prices have held their gains so far, but only because of a limited supply of homes for sale. Homeowners don't want to give up a 3% mortgage to buy a new home with a 7% mortgage. Eventually, rates should come down to rectify this. However, reversion to the mean is a powerful headwind. Rents should go up as they tend to follow home prices with a lag. Industry strength is rated a 2.5 due to the reversion to the mean headwind. Recession resistance is also rated a 2.5 as this segment often is impacted by recessions. Renters trade down from homes to apartments.
Cell towers are another REIT segment that is not included in this article but has struggled recently with the Sprint/T-Mobile merger reducing demand.
The chart below shows the scoring results. The figures in the first six columns are the scores. Those scores are then weighted by the factor shown at the top of the column to determine the totals.
Author
The Top 4
Before I discuss selection, it is important to note which stock you pick depends heavily on what type of investor you are. Is growth most important to you? How about dividend yield? Or perhaps value? Are you a buy and hold investor or a short-term flipper? I am probably different than most readers here as I am a deep value investor with a shorter-term horizon. My selection therefore is probably different than most. The majority of REIT investors I believe are looking for dividend growth and yield and are longer-term holders. There are two picks from the data above and analysis below. The first is for longer-term buy and hold dividend investors. The second for value investors with a short-term horizon.
The top scoring 4 were Public Storage ( PSA ), VICI ( VICI ), Healthcare Realty ( HR ), and Prologis ( PLD ). The rankings of each are not materially different. So, I took a deeper dive. Below is a brief analysis of two I didn't go with, and a more detailed analysis on the two I did.
VICI was a 2017 spinoff from Caesars. The REIT sector's leading growth it has enjoyed is mostly from smart acquisitions. It has raised capital for the acquisitions leaving it with only moderate leverage. It will likely by impacted by the proliferation of online betting. Once you factor in the growth was from large acquisitions it drops out of the top two. However, the dividend is above average and a recent stock price drop may be a good entry point.
Prologis along with Public Storage has been one of the best performers among REITs for over a decade. Growth in recent years has been above its strong historical average due to the move to online retail requiring many more distribution centers. This trend is likely to continue, though at a slower rate. The biggest issue with Prologis is its price of 21.1x to FFO. That is well above the industry average of 13.3x. It deserves that premium and is a good selection for buy and hold investors. The yield at 3.1% is lower than most, making Public Storage probably the better holding.
Public Storage ((PSA))
Public Storage is the largest self-storage operator in the U.S. As of December 31, 2022, it owned 2,869 self-storage facilities totaling 204 million net rentable square feet, all in the U.S. Unlike other REITs, their tenants are more individuals and small businesses. While most other REITs are invisible to consumers, Public Storage is a highly recognized brand. It is quickly recognized roadside by its orange colors. As such Public Storage has significant brand value in addition to its real estate value. The self-storage industry is fragmented and Public Storage believes it is the largest player, but with only a 9% share. This leaves a large runway for growth. Public Storage's properties are primarily in the larger more expensive markets. The top four are L.A., San Francisco, New York City and Miami. No one market has more than 10% of properties.
The self-storage industry benefits from several secular trends. These include baby boomer downsizing, American's continued consumer spending beyond what their homes can hold, and more RV ownership by an increasing number of retirees.
Unlike most other REITs, Public Storage has a long history of solid growth. FFO growth averaged 5.8% in the five years ended 2019, the last year before the pandemic. Over the last four years (including 2023 estimates) it surged to 12.6%. This surge is at least partially pandemic-related so growth should slow going forward. However, based on their scale, and their fragmented market, there is a good chance they can at least return to the pre-pandemic growth. Growth is both from acquisitions of properties and building new ones. Revenues in 2022 included 10% from recently acquired properties and 8% from newly constructed ones (past three years for both). Occupancy declined slightly from 95.7% on June 30, 2022 to 93.7% on June 30, 2023. Average rent per occupied foot increased by 8.3% in that period. Occupancy is being impacted by less existing home sales this year than normal. That is probably a temporary situation.
Though the pandemic surge peaked in 2022, property valuations remain stable with a cap rate of about 5.1% according to Cushman Wakefield. The industry does not appear to be overbuilding. Capacity grew by 2.4% in 2022 and an expected 3.1% in 2023.
Leverage is below the industry median with a debt-to-equity ratio of 68.2% as of December 31, 2022. However, it was 127% on that date if preferred stock is excluded from equity. As of December 31, 2022, there were 14 preferred stock issuances totaling $4.35 billion. In July, Public Storage acquired Simply Self Storage for $2.2 billion, mostly funded with debt, so leverage has increased some. This acquisition is expected to increase FFO by 1% initially. Interest bearing debt actually declined by $605 million in 2022 despite significantly higher revenues. This was due to a $2.1 billion gain on the sale of an equity investment that year. The company has little on its balance sheet that is not real estate investments or cash.
Public Storage paid a $2.00 quarterly dividend from 2017 until March 2023. It then increased the quarterly dividend by 50% to $3.00 last quarter. The yield is now 4.6%, well above peer Extra Storage which yields 2.1%. The yield on the preferreds are running in the 5 to 6% range. The dividend was 79% of funds available for distribution in the last quarter. That is a comfortable cash flow coverage of the dividend.
My two largest concerns are potential higher borrowing rates and uncertainty to how far the pandemic surge fades. Interest expense is currently under 3% with most maturities in 2026 or later. If interest rates stay high until 2027, the interest expense could go up significantly, though not enough to lower the dividend. Public Storage enjoyed a surge in FFO in 2021 and 2022 due to the pandemic. That surge has slowed but not reversed. While rents are increasing, rents on new space is now dropping and the occupancy rate has dropped. There is likely to be some reversion to the mean and this has impacted the stock price this year. Management expects FFO growth to flatten out before resuming growth. If this impacts property values it may actually benefit Public Storage through cheaper new property acquisitions.
The stock has dropped 2.7% year-to-date versus a 12% increase in the S&P 500. It closed at $263.97 on October 6, down from a peak of over $400 in April 2022. However, it is up only about 15% from where it traded just before the pandemic.
In summary, temporary factors are slowing things right now but the longer term looks quite promising. FFO growth is cooling off from a pandemic surge and will likely revert to the mean after a short-term air pocket. However, with inflation, that mean is a lot higher than before the slowdown. Occupancy is also impacted by less existing home sales (less movers needing storage), another likely temporary situation. While FFO may flatten out and possibly even decline slightly over the next year, longer term this is a strong investment. Public Storage's strong balance sheet allows for more growth from acquisition and new construction. It also has a strong growth history in a fragmented market and the best name recognition in the industry. Its brand has value beyond the real estate. Public Storage offers a better combination of growth, yield, and safety than most other REITs. You would expect to pay a premium for that and you do, but at 16x FFO it's only 20% above the peer average. Also, the company has historically traded at a PE ratio of over 30 and is currently in the mid-20s. This makes for a historically low entry point. I recommend a long position in Public Storage for buy and hold dividend investors.
Healthcare Realty Trust ((HR))
As a deep value investor my selection is HR. This one may not be the best selection longer term but it is my best pick over the next year.
As of December 31, 2022, HR owned 686 properties with a gross investment of $13.7 billion. It had another $675 million in other investments, mostly joint ventures and loans. Medical offices and outpatient facilities were 92% of their properties by investment. The rest is inpatient facilities and office space. The leases are long-term, with only about 14% expiring in 2023. Most of their properties are located on or near hospital campuses. HR has no large tenants and no geographical concentrations. Medical office space is usually more expensive than other office space due to additional amenities.
The company had a steady but unremarkable history of 2-3% average FFO growth a year until a merger in July, 2022 with Healthcare Trust of America. The stock has dropped 37% since this merger. This merger in my opinion was a mistake and caused much of the stock drop for the following reasons. First of all, they acquired a larger REIT. Smaller bolt-on acquisitions have historically performed better than acquisitions of larger companies. Secondly, management admitted at the time of the merger it would not only be dilutive, but it may take several years to become accretive. Finally, REIT mergers tend to have much less synergies than in most other industries. That's why large ones have a below average history.
While investors have punished HR for a bad merger, what remains is quite stable with a very large (8.3%) dividend. Management and the analysts expect FFO growth to pick back up in 2024 at 3-4%. The company is not currently very active with property acquisitions. Contractual rent increases are currently running 2.7% a year.
Earnings have been impacted in 2023 moderately by higher interest rates and labor costs. Adjustable rate loans are currently 14% of total loans. This will become a tailwind when rates go down but is a headwind now. They also expect a less tight labor market to reduce labor inflation going forward.
Longer term, HR should benefit from a secular trend of more procedures moving from hospitals to less expensive outpatient facilities. Outpatient procedures were held back by the pandemic but are surging now. In the last conference call, management mentioned leasing activity was picking up and is now the highest since the merger. They also mentioned" the potential to boost Healthcare Realty's same-store NOI growth to the 4% to 6% range" in 2024.
My biggest concerns revolve around dividend coverage and potential contamination from an office property meltdown. Adjusted FFO totaled $0.79 in the first half of 2023, above dividends of $0.62. However, after deducting capex and commissions, Funds Available for Distributions only covered dividends by 1.5%. I believe the current dividend is sustainable based on the trend of FFO and the moderate leverage. Also, when the merger occurred management kept the dividend at its prior level despite coverage being tight. It would be a while before it became evident it was not sustainable. Also, management is spending little on new property acquisitions. If they did lower the dividend, it would probably be to a still above average level.
The stock is down 21.3% year-to-date as of October 6, 2023, at $14.44.
In summary, HR is a REIT with a high and probably sustainable dividend and increasing growth. FFO growth was knocked back slightly by the merger but is moving higher now. Pent-up demand for outpatient procedures and a secular trend for them should increase FFO going forward at a higher rate than the historical 2-3%. Leverage is moderate. The biggest risk to FFO is potential contamination from an office property meltdown. However, this appears mostly mitigated by the location of properties on or near hospital campuses and the cost of converting regular office space to medical. Also, as a shorter-term trade, that shouldn't come into play. I recommend a long position in Healthcare Realty Trust.
For further details see:
Sorting Through The REIT Wreckage: Public Storage, Healthcare Realty And 32 Others